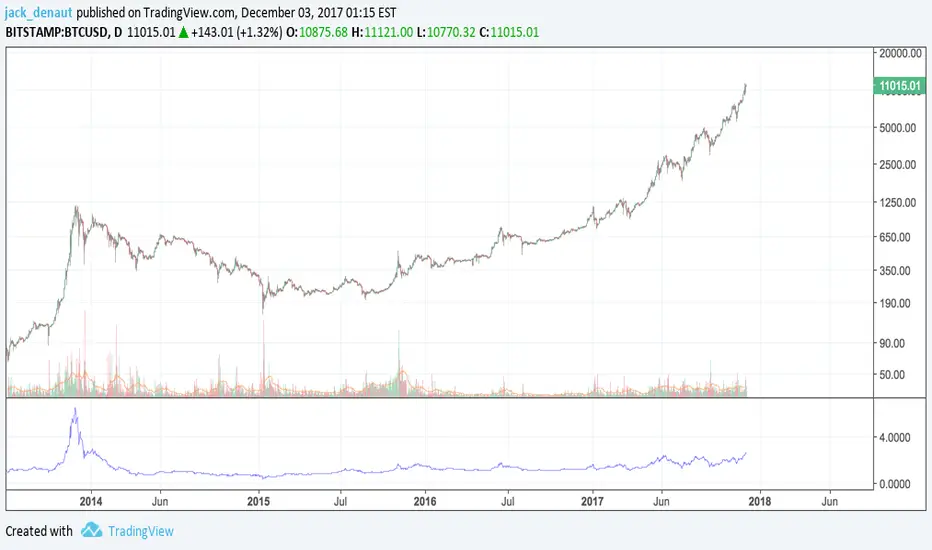
Bitcoin MultipleMultiple of Bitcoin over the 200 day average.
Inspired from: www.theinvestorspodcast.com
200
200-EMA Moving Average RibbonThis indicator plots a series of moving averages (EMA)
to create a "ribbon" that offers a great visual structure
to price action.


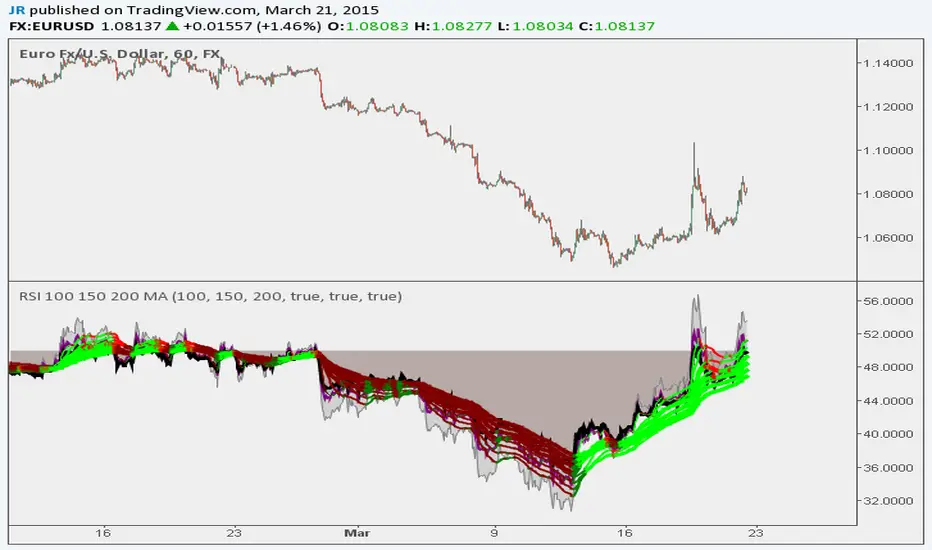
RSI 100 150 200 MA Ribbon
Following Trends and Finding Divergences
Here is a script example that uses a long length (100, 150, 200) RSI MA Ribbon to detect trend reversals using lower time frames. You can also use traditional RSI to find divergences.
Built Best for 1H to 10 Min Charting
BTCUSD