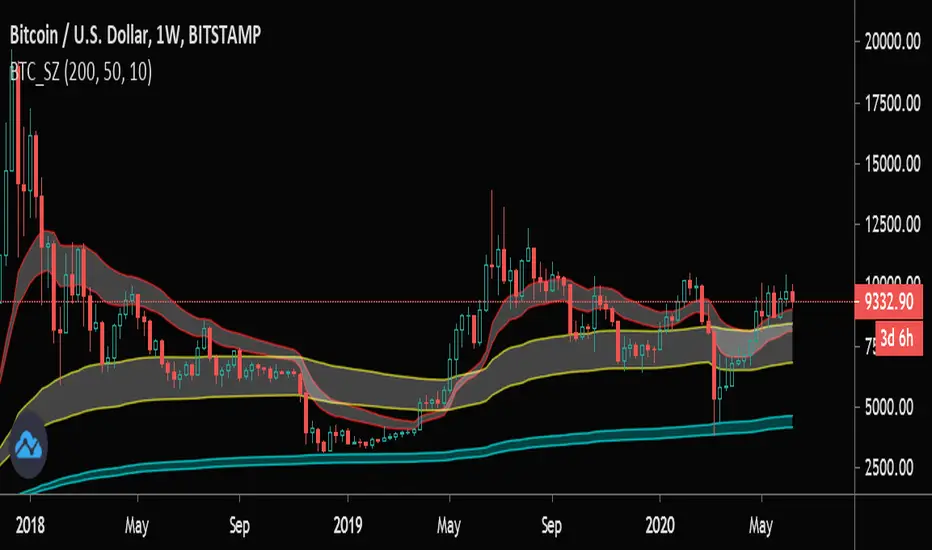
BTC SWING ZONESHigh Time Frame EVWMA Envelopes for BTC spot. Should only be used on Weekly time frame and higher.
BTFD and Chill!
Btc!
Hello VWAP "Beta"This is my 1st indicator, and my attention is to plot the VWAP "Volume-weighted average price" using the SMA "Simple Moving Average" over time... IE over the last 50,100,200 bars and just the VWAP... All of them in just one line... I have made it when I have been using the BTC/US chart, but it should work for stocks/forex or any other chart that you want to use...
I am not completely sure about this indicator and I do want to add more to this, that is how come I am posting to the community to show what I have done and people can use it and if they are open to it give me feedback or tips to make it better...
Happy trading...

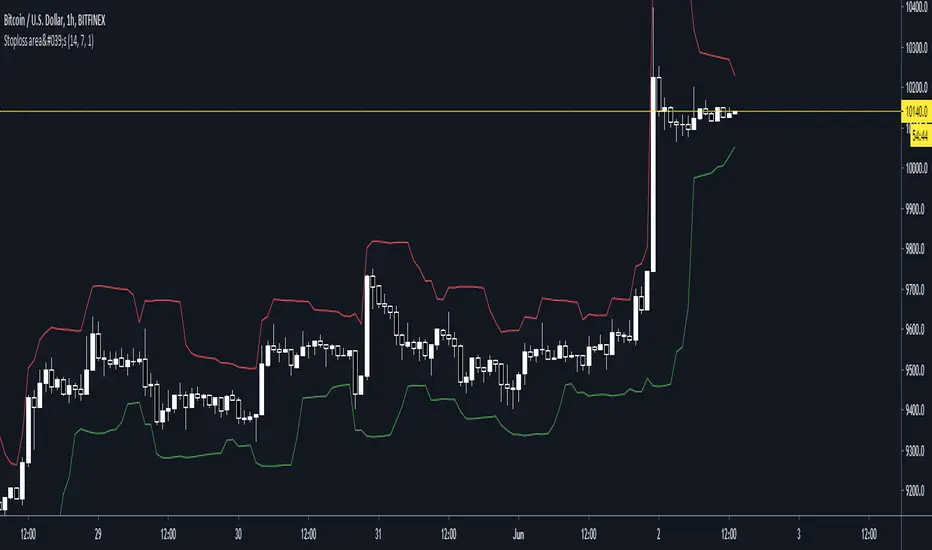
Stoploss indicatorGood for setting trailing stops and stoplosses when your taking a scalp etc, most recommended for manual trailing stops
Simple EMA trend indicatorSimple EMA trend indicator , pretty straightforward green equates to bullish and usually a retest/wick is often seen , same for the flipside viceversa


Bitcoin SpreadThis indicator display the current lowest and the highest value of btc on a set of exchanges for a define type of market.
Bitcoin Spread was originally made by @DayTradingItalia, i have bring his indicator to pine v4, add add some stuff to it:
5 Type of BTC Market : USDT Swap, USD and Futures (current/next contract)
Spread value


msoro daily DCATool to estimate PnL of your investment if you put in a fixed $ amount daily into btc for past year. It takes input as 365 days which can be changed as per need.

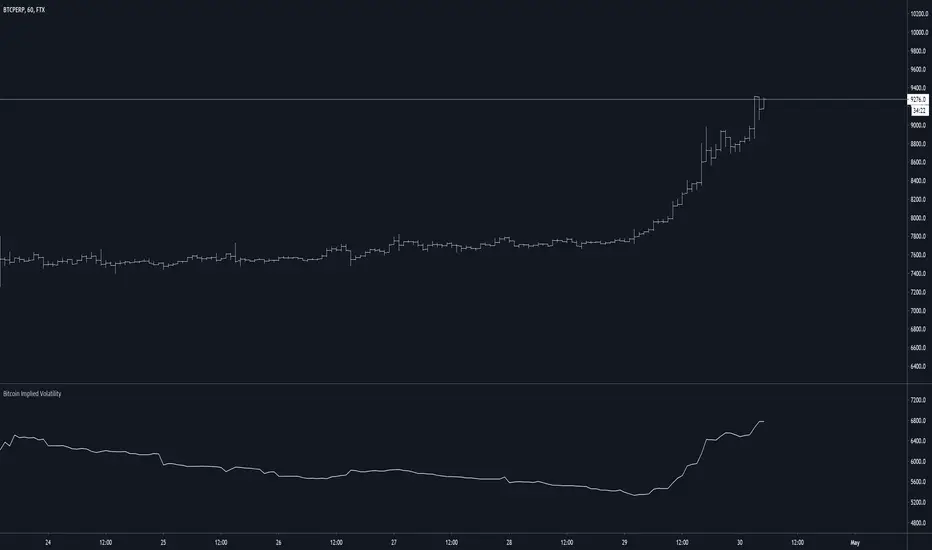
Bitcoin Implied VolatilityThis simple script collects data from FTX:BVOLUSD to plot BTC’s implied volatility as a standalone indicator instead of a chart.
Implied volatility is used to gauge future volatility and often used in options trading.
Crypto Market CorrelationThis script utilized some new functions in Pine Script, which compares the correlation between the current symbol to a basket of crypto indexes that are listed on the FTX exchange.
By tracking these indexes we can gauge the reaction across markets that have a different market cap. By that I mean we can have a better idea about where the money is flowing into a specific market.
This script uses data from FTX:BTCPERP, FTX:ALTPERP, FTX:MIDPERP, FTX:SHITPERP, FTX:EXCHPERP, FTX:DRGNPERP.
A value closer to 1 equals to more correlation, closer to 0 equals to less correlation.

eha MA CrossIn the study of time series, and specifically technical analysis of the stock market, a moving-average cross occurs when, the traces of plotting of two moving averages each based on different degrees of smoothing cross each other. Although it does not predict future direction but at least shows trends.
This indicator uses two moving averages, a slower moving average and a faster-moving average. The faster moving average is a short term moving average. A short term moving average is faster because it only considers prices over a short period of time and is thus more reactive to daily price changes.
On the other hand, a long term moving average is deemed slower as it encapsulates prices over a longer period and is more passive. However, it tends to smooth out price noises which are often reflected in short term moving averages.
There are a bunch of parameters that you can set on this indicator based on your needs.
Moving Averages Algorithm
You can choose between three types provided of Algorithms
Simple Moving Average
Exponential Moving Average
Weighted Moving Average
I will update this study with more educational materials in the near future so be informed by following the study and let me know what you think about it.
Please hit the like button if this study is useful for you.

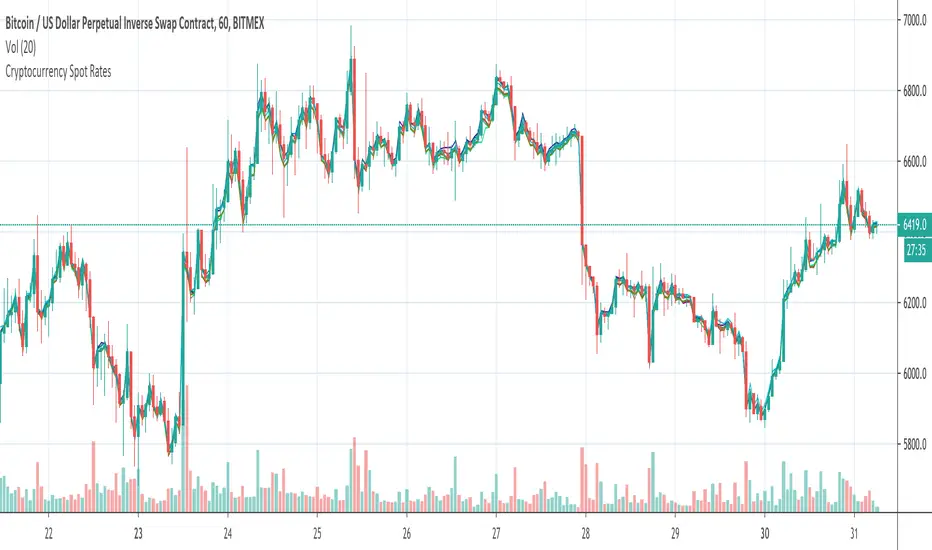
Cryptocurrency Spot RatesThis is an overlay indicator on the chart that will plot cryptocurrency spot prices of the following exchanges:
- Coinbase
- Poloniex
- OKCOIN
- Binance
- Huobi
- Bittrex
- HitBTC
- Kraken
- Bitfinex
Additionally it plots the price average of all those exchanges.
This overlay is intended to be used on charts with derivatives/futures such as BitMEX/Deribit/...
It works with all USD and Tether pairs on the main chart (for example BTCUSD, ETHUSD, BCHUSD,...)
XBT % ContangoSimilar to my other indicators, but measures XBTUSD Contango in terms of percent.
Also, built it so you could change the values that give the red and green signals. Default values are 0% or less (backwardation) indicates green. However, i found that a 0.5% setting worked will finding local bottoms for current contract of XBTH20 (March 2020). The upper value default is at 5%, and signals red when the next contract reaches over 5%.
My assumption is as BTC increases in value over time, measuring contango in terms of percent will be a better measure of the XBT futures curve.

Ichimoku Clouds Strong Bullish/Bearish signals and alertsIchimoku Clouds Strong Bullish/Bearish signals with allerts
The Ichimoku cloud was developed by Goichi Hosoda, a Japanese journalist, and published in the late 1960s. It provides more data points than the standard candlestick chart. While it seems complicated at first glance, those familiar with how to read the charts often find it easy to understand with well-defined trading signals.
We provide you easy-to-use script which helps to decrypt meaning of lines in the indicator. The script takes Ichimoku clouds indicator formulas to calculate Tenkan, Kijun, SenkouA, SenkouB values and examines them in order to produce buy ( Bullish ) and sell ( Bearish ) signals which are displayed at the chart
The most appropriate time frame is 30m
Custom alerts are added to send you a notice with a webhook when bullish or bearish signal arrives.
You can easily add weak and neutral signals alerts by removing "//" in a specified place
Feel free to copy and use this script for your ideas and trading. You can modify the script by adding Parabolic SAR in order to increase accuracy of positions closure

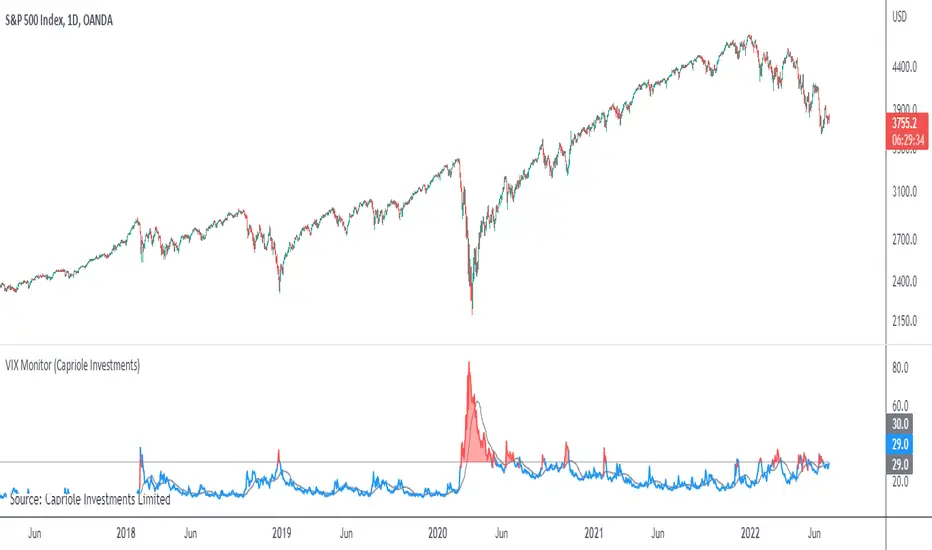
VIX MonitorSimple VIX Monitor to track spikes.
Spikes in VIX are often followed by big moves up in stocks.
Useful when paired with "Correlation & Beta" Indicator.
For Bitcoin Traders: when Bitcoin is highly correlated to Stocks (such as now) it could be a good opportunity for a short-term long trade.
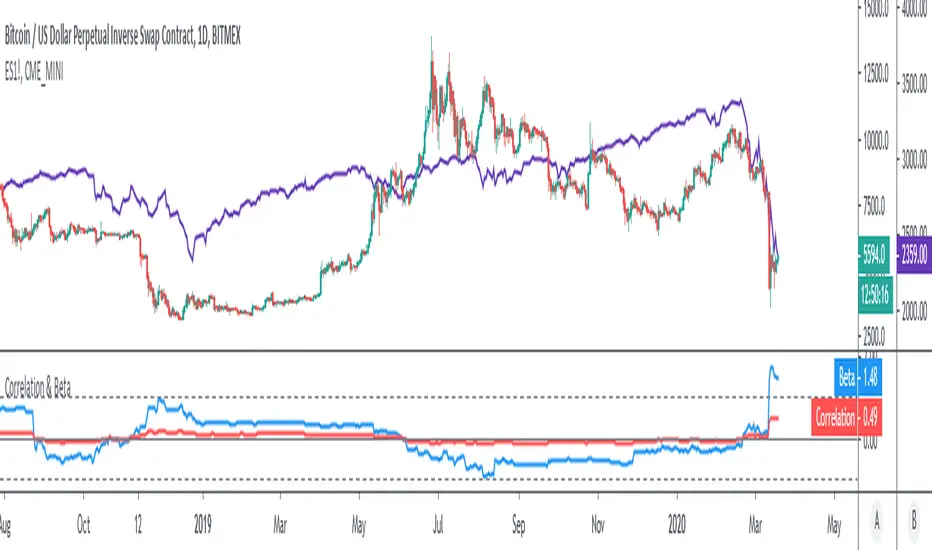
Correlation & BetaDisplay the correlation coefficient and/or Beta of an asset to a specified market.
Options to:
- Specify market (S&P500 futures by default)
- Display one or other metrics
- Modify assessment period (200 bars by default)
- Calculate on price, returns or log-returns
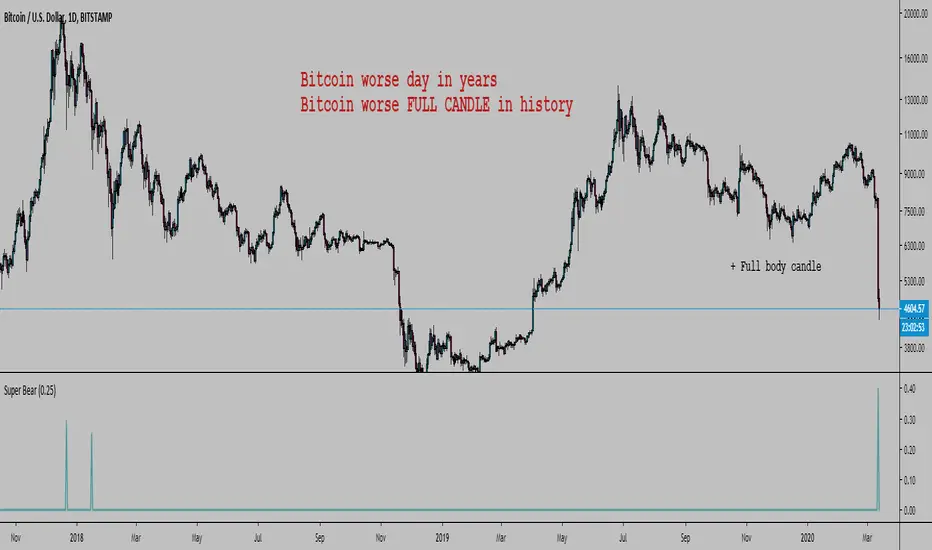
Bitcoin Worse DaysHello, here is a simple script to scan for BTC worse days.
In input you tell the script what are the minimum percent drops to look for.
By default it is 0.3, here I set it at 0.25 or it would not show anything except the 12 March (which is 40.07%).
The indicator has a precision of 1% I think.
It does not look at how low the body closed, it will show all days that closed below where they opened looking at how far below the high of the day the low was.
It can also work on any timeframe.
Here were the previous worse days from the late 2017 crash start of the bear market:
You could modify the script and look for the worse bodies with open - close instead of high - low
You could also add a filter to only look at days where the body is > 90% the whole candle (in this case it's got to be about 99%)
We can look back at BTC past a bit
Every bear market started with a large drop so we can expect...
As you can see we can look at the weekly chart too:
I won't lie, I am pretty happy. Russia, China bat eating community, and Greta were a big help. Thanks guys.

BTC FS Diff / Percentage (XBTH20)Shows price difference by a percentage of future (BITMEX:XBTH20) and spot index (BITMEX:XTB) .

Bitcoin CME Gaps [NeoButane]Simple script that checks for gaps in price from CME. tickerid(x, y, sess) doesn't seem to be applying correctly for the ticker specified at the moment so there are a couple of 'gaps' peppered on lower timeframes.
Gaps are legitimate price levels to look as a support or resistance. The theory is that volume needs to be gap filled, but I currently believe it's an easy entry/exit trade for those who can move the market. I don't think there is sound analysis behind the why, but it is real.

Intraday S/RPlots yesterday's low and high, and the current day's open, as intraday support/resistance levels.

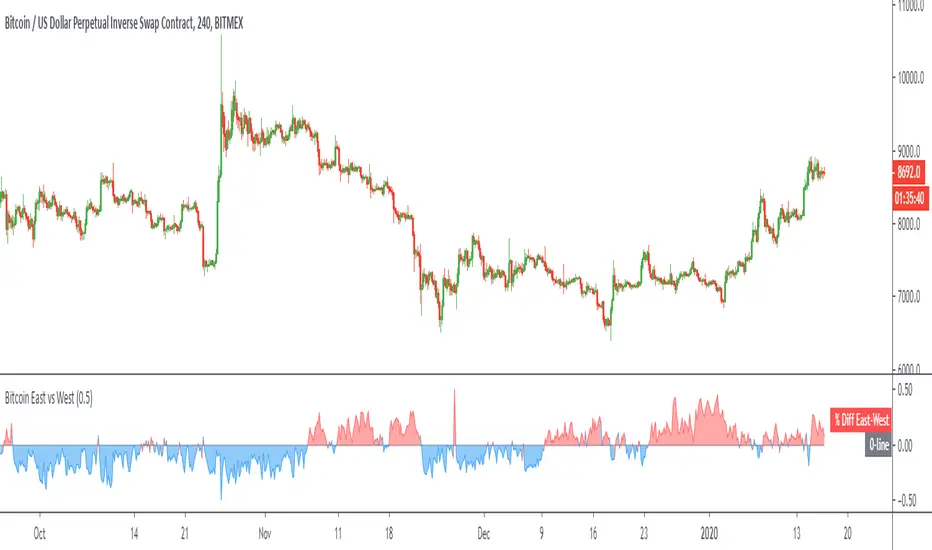
Bitcoin East vs WestPlots the volume weighted price difference between the top spot exchanges in the "East" (Asian markets) versus the "West" (US/UK/EU markets).
Optional: view the volume difference between the two.