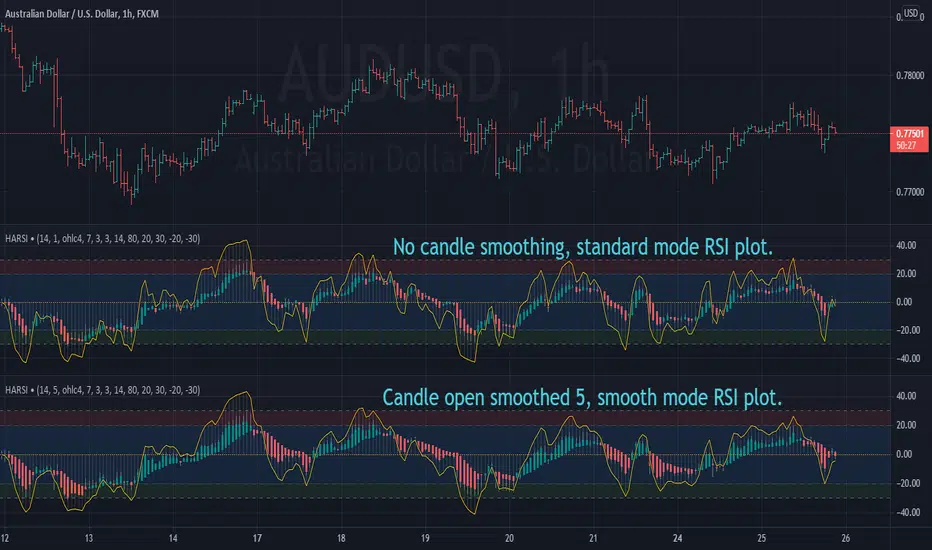
Heikin Ashi RSI OscillatorIntroducing HARSI - the RSI based Heikin Ashi candle oscillator.
...that's right, you read it correctly. This is Heikin Ashi candles in an oscillator
format derived from RSI calculations, aimed at smoothing out some of the
inherent noise seen with standard RSI indicators.
Science!
We likes it we does.
Included plot options for standard RSI plot overlay, and a smoothed variant with
it's own seperate length from the candles, oh and histogram option, for reasons.
Articles and further reading:
investopedia.com - RSI
investopedia.com - Heikin Ashi
This is a REALTIME indicator, so any values used for conditions should use
history 1, or alternatively, alerts should be called using once-per-bar-close.
Candles
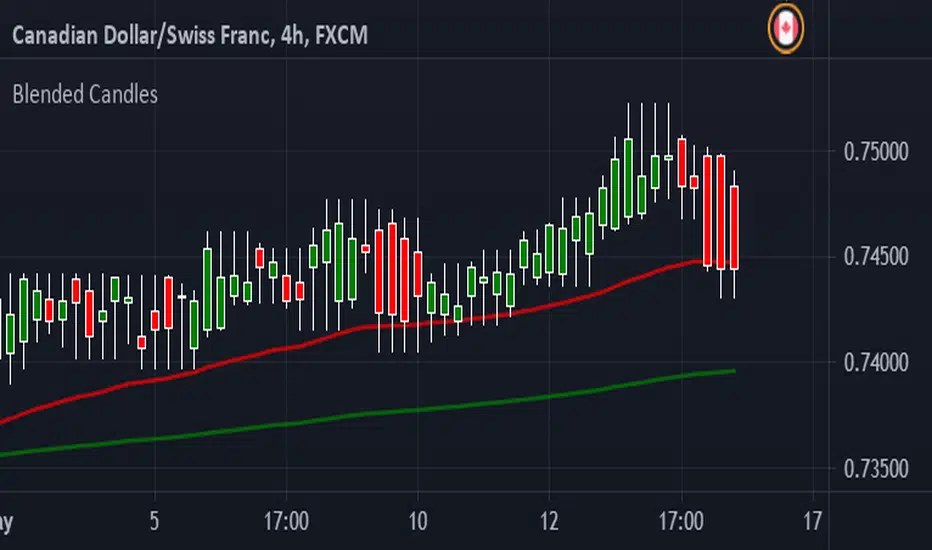
Blended CandlesHave been looking at YouTube and found a few videos about Blended Candles. Couldn't find a script here so I decided to script something myself.
I have also added a couple of EMA's, saves having to put them in individually.
You can Look Back as far back as you want but I find that each time frame looks better if you keep it to multiple of the next
IE : 1 min - look back 5 (5 min) up to 15 (15 min)
5 min - look back 3 (15 min) up to 12 (1 hour)
15 min - look back 4 (1 hour) up to 16 ( 4 hours)
1 hour - look back 4 (4 hours) up to 8 (8 hours - 1 trading session)
4 hour - look back 2 (8 hours - 1 trading session) up to 6 ( 1 Day)
1 day - look back 5 ( 1 week)
Shooting stars, Hammers and Doji's are very easy to recognize
Long wicks on top - Bearish
Long wick on bottom - Bullish
Support and Resistance is easier to spot as well :-)
Hope this helps someone - defiantly helps me time entries
Comments welcome and Happy Trading
ERSIInstead of the RSI which only uses the close of the market to calculate RSI, this indicator uses the Open, Close, High and Low individually to give four unique data points which are then drawn as candlesticks in place of the regular RSI.

PRIME - ShadoW ZoneZ with RSI LevelsIn This experimental study, we've taken RSI data, Volume Profile, and Trend analysis, combining them into one unique package that will allow a trader to analyze market trend lines and their proposed channels, trend momentum through candle color augmentation similar to "Pulse", and Visible Volume index price levels on chart for the current sequence. Below are explanations of each function within the system.
The Semafor is used to spot future multi-level Supports and Resistance zones.
It is also useful to spot HL or LL or HH or LH zones at different Depth settings.
The red zones are the extreme places where the market has a higher chance of reversing while the green zones have the lowest setting with lower chances of the market reversal
Automatic Trend Lines
The indicator takes in 2 timeframes to detect High and Low values from which to draw the trend lines of each timeframe.
As the values change with price movement, the lines are updated. They are color coded for uptrend and downtrend based on the direction of each individual line. Trend lines can be set up to color with only the default value on the configurations panel.
- Toggle on/off Color Coded
- Change Default, Uptrend, Downtrend color
- Change Line Width
- Change Line Style
- Toggle on/off Line Extensions
- Change Extended Line Width
- Change Extended Line Style
- Toggle On/Off labels for 7 data points of each timeframe
Automatic Trend Sights
This is a neat feature that may help you get a better feel for the direction the current movement is heading towards in correlation with the short or medium length timeframe trends. The sight draws a line from the middle vertical point of the trend coordinates towards the current price. They are toggled off by default but can be enabled in the configurations panel.
- Toggle on/off sight on each timeframe
- Change Width
- Change Line Style
Support & Resistance Levels, the main aim of the study. Level calculations are based on Relative Strength Index ( RSI ) threshold levels of oversold/overbought and bull/bear zones, where all threshold values are customizable through the user dialog box. Background of the levels can be colored optionally.
RSI Weighted Colored Bars and/or Mark Overbought/Oversold Bars , Bar colors can be painted to better emphasis RSI values. Darker colors when the oscillator is in oversold/overbought zones, light colors when oscillator readings are below/above the bull/bear zone respectively, and remain unchanged otherwise. Besides the colors, with “Display RSI Overbought/Oversold Price Bars” option little triangle shapes can be plotted on top or bottom of the bars when RSI is in oversold/overbought zones .
Disclaimer:
Trading success is all about following your trading strategy and the indicators should fit within your trading strategy, and not to be traded upon solely
The script is for informational and educational purposes only. Use of the script does not constitute professional and/or financial advice. You alone have the sole responsibility of evaluating the script output and risks associated with the use of the script. In exchange for using the script, you agree not to hold dgtrd TradingView user liable for any possible claim for damages arising from any decision you make based on use of the script

Renko + CandlesThis indicator has been designed to show you both candle chart and Renko chart in one place.
I think most of you are familiar with candle chart which is working with the time and price movements but Renko chart is based on price differences and is not related to the "time" parameter.
so if you see a Renko brick is appear up(or down) to the previous brick it means that a certain and fixed price movement has been occurred (which mostly calculate by ATR). and also this indicator works in any time frame.
Remember because we want both charts we have time parameter in this indicator, and if the price doesn't move up or down a certain percentage from previous bars, it will plot a renko bar beside the previous one.
you can use this indicator to see if the price moves up or down.
Or you can determine the important support and resistances with much less noises.
it can be used as a confirmation for you to keep your positions or exit.
go ahead and discover it...
If you have any questions, don't hesitate! ask in the comments section below.

Z CandlesScript to change candle color based on z-score.
Inputs:
'src': Price source that will be standardized.
'n': Number of periods used in calculation of z-score (mean and st. dev.).

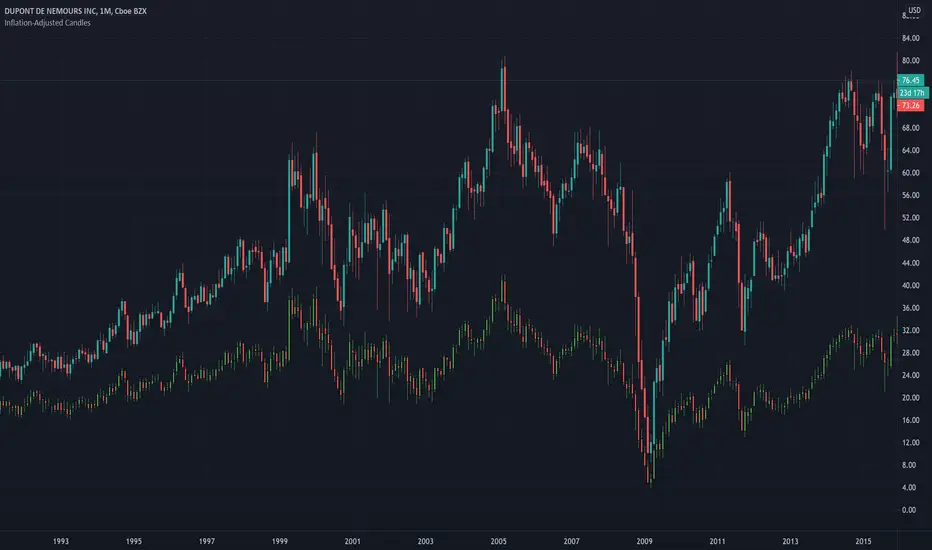
Inflation-Adjusted CandlesDeflates time series of historical open, close, high, low prices. This adjusts price data for inflation and removes the effect of price inflation.
inflation-adjusted price for period 't' = (price / cpi ) * 100
Historical CPI is pulled from Quandl.
Free Multiple Timeframe Chart Candle Resolution by Emiliano MesaFree Multiple Timeframe Chart Resolution by Emiliano Mesa
This indicator allows free users to have a multiple timeframe candlestick graph without the need of upgrading to PRO, PRO+, or Premium accounts. Furthermore you can even apply indicators to the chart, and has a much more historic data than similar indicators with the same purpose I have previously seen in the platform, which is a huge plus.
How to use?
1) Install the indicator
2) The background color, must be the same color as your actual TradingView chart background. For example, as mine is the white theme, then ill choose the white background.
3) Set a small timeframe for your real TradingView chart, this must always be less than the timeframe set in the indicator
4) Set a bigger timeframe in the indicator, this is done in the "Timeframe Wanted"
5) Expand the indicator window as much as you want
For the best results, try to make the wanted resolution 3 times bigger than the real chart resolution. For instance if using 3 minute real resolution I suggest a 9 minute multiple time frame wanted resolution for the indicator. If you are using 5 minutes, ill suggest a 15 minute, and so on
Add an indicator over the indicator?
1) When clicking in the indicator name, you will see 3 dots. Click them
2) Select "Add indicator on indicator/Strategy"
3) Select the indicator you whish to add
4) Select if the indicator will work with close,open,high, or low. More options will come in future updates.
Enjoy!
Indicator by Emiliano Mesa

Flunki RSI Candles 2x LinReg 2x BandsHerewith ;
RSI as Candles
With Linear Regression and a multiplied Linear Regression
With Adaptive Deviation Bands
Background highlighter highlights breaking of the slow / wide band.
I like it for scalping tops and bottoms on low time frames, but have a play..
The linear regression slopes show trend and divergence, might include divergence flags later....
Last script of 2020, wew.

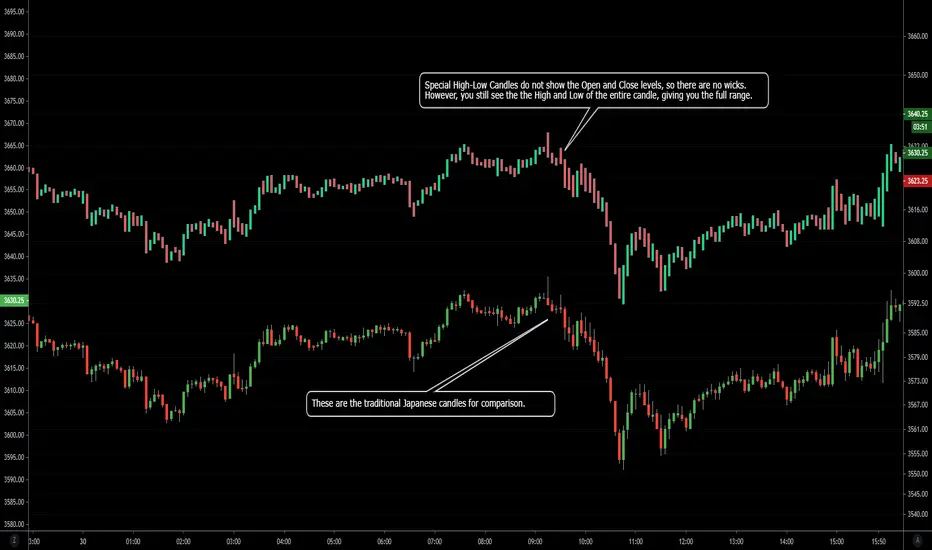
NSDT Special High-Low CandlesThis is an interesting take on candlesticks. These special High-Low Candles do not show the Open and Close levels, so there are no wicks. However, you still see the the High and Low of the entire candle, giving you the full range.
Since this is an indicator, be sure to hide the chart candles to avoid overlap. Or choose offsetting colors to see the traditional candles under the indicator candles.
Impulse Guage Indicator for HA CandlesThis script uses Heikin Ashi candles to smooth out the candles, then counts how many consecutive candles in a row are the same colour (red or green). It then takes each count and multiples it by the difference between close and open, to provide a weighted movement.
Where larger moves create greater impulses.

Finnie's RSI Waves + Volume Colored CandlesUsing RSI and 4 exponential moving averages, I created this indicator so that you can spot inconsistencies between price action and RSI. There's a lot of misunderstanding surrounding RSI, most people think if something's 'oversold' buying is a guarantee win. This definitely isn't the case as there's many more variable to consider. In addition, with this indicator, candles are colored based off of volume.
INDICATOR USE:
1. Determine trend
2. Find relative support/resistance
3. Once at support/resistance look for entries:
-RSI crossing over the Short EMA (CYAN) is your fist buy/sell signal
-Short EMA (CYAN) crossing Medium EMA (YELLOW) is your second
-RSI crossing Long EMA (PINK) is your final and most accurate signal
4. Once you've made an entry, you can follow step 3. in reverse for an exit
COLORED CANDLES:
Dark Green candles = Strong Bullish volume
Light Green = Average Bullish volume
Dark Red candles = Strong Bearish volume
Light Red = Average Bearish Volume
Orange/blue means volume is conflicting with price action
I plan to add a Colored DOT over each crossover as a visual buy/sell signal if anyone has any suggestions that'd be great :)
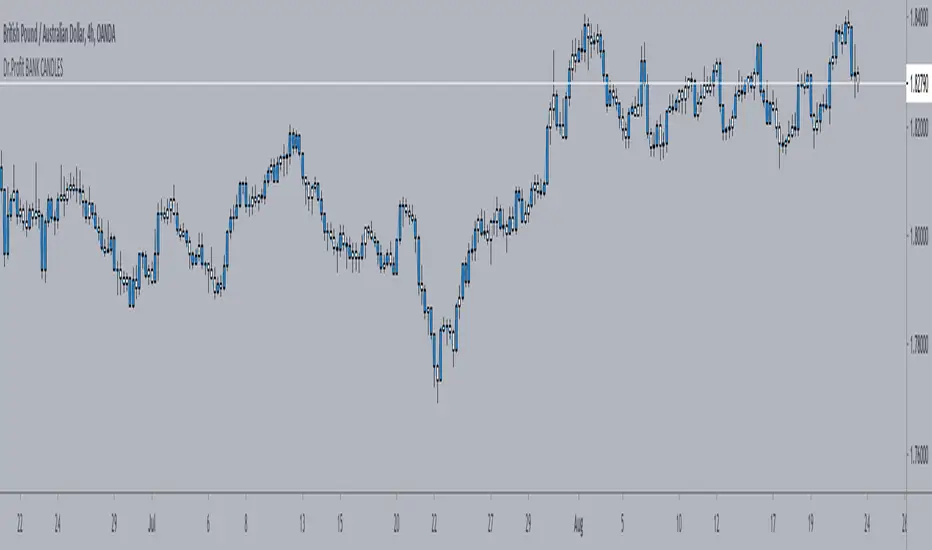
Dr.Profit BANK CANDLESThe Dr. Profit BANK CANDLES will identify the low momentum candles (LMC) and high momentum candles (HMC) needed to detect where the banks are most likely to consume supply/demand according to the base. You may chose to only show HMC or LMC in the INPUT SECTION.
HMC are your "INTRO" candles. You can view these candles as AGGRESSIVE and high in Volume.
LMC are your weak candles with very little volume. You should never take a trade based off a LMC
Candles for VSACandles in which the open is equal to the previous close. (For VSA theory)
Свечи в которых открытие равно предыдущему закрытию. (Сделано для анализа по ВСА).

Candlestick Pattern IdentifierMy script builds upon another user-submitted script by rebuilding the logic used to identify candlestick patterns. The logic in my script is a mix of strict and lax guidelines to mitigate false flags and present valid buy and sell signals.
-To use this indicator, simply add it to any chart. It will identify trends on any time frame although the lower you go, the more signals you'll see and the higher probability of those signals being false flags. You can also disable any candlestick patterns that you feel are not as useful.
- This indicator works best with Stocks and also with Forex markets to a lesser extent.
- This indicator works the best on the Daily chart and also works (with varying degrees of success) on any timeframe at or above 1 hour. I've found that this indicator works the best when used in tandem with the Daily and Hourly charts with the Hourly chart being used to determine an entry point while the Daily chart is used for long term trend analysis.

MinichartsA further improvement of the Sparklines indicator, which shows the last 6 candles of 4 different instruments (can be customized on the user's choice).
Use cases are remain the same as for the Sparklines :
Merge of two instances
A screener
* on the preview
If you have any questions you can contact me either via private messages here or via Telegram

BoredWoreders GUIDED LIGHTSHello BoredWorkers here.
We've been on a journey to create the most perfectly simple indicator for newbies to profit NO MATTER WHAT and we're ending our journey successfully here soon.
So we will be releasing indicators, apart of or, that were a part of our journey.
The guided lights indicator is a favorite.
This indicator is simple. It displays the current power any candle you're currently watching. No matter the time frame. It only displays strong signals.
Example - You've jumped in a daily trade setup. While watching the daily candle the guided lights indicator will light up the colors of a traffic light.
The green light will display when the candle is in a strong up push.
The yellow light will display when the candle up push is weakening or is weak.
The yellow light will display when the candle down push is weakening or is weak.
The red light will display when the candle is in a strong down push.
- Arrows are added to the yellow lights to help you determine candle directions.
- If the light is lit and turns off. That only means its stop pushing but its not a reversal back to when it lit. New support or new resistance unless the colors say otherwise.
Have fun! We enjoyed it. Latch it directly under your chart. And watch the magic!
PS Unless you're more experienced don't trade during no light phase.

Up or Down?I read somewhere that candles can easily confuse the eye, making it easy to lose focus. We get distracted by the size of the candle body and the candle's color without paying attention to its true range and how it compares to that of the previous candle.
With Up or Down? you get two signals. The blue arrow below lets you know that the candle's current low and high price are both higher than that of the previous candle -- the range is trending up. Conversely, the red arrow lets you know the low and high are both lower -- the range is trending down.
I designed it with pullbacks in mind. Determine the trend with your favorite indicator. Or use Up or Down? to give you an impression of it. A lot of blue arrows consistently rising broken up by only a few red arrows would indicate an uptrend. Then, wait for signals that don't fit the trend (ie, red arrows in an uptrend). Buy in at the first candle that confirms a return to the trend. (Your mileage may vary.)

Candle Color GeneratorCandle Color Generator:
This indicator is designed to highlight the candle colors based on the combinations of Parabolic SAR (PSAR) and 2 Hull Moving Averages (HMA).
Colors:
Yellow, Red, and Green colors are used to describe the candle colors depends on its position to PSAR and 2 HMAs.
PSAR:
PSAR position above or below candle position is differentiated by Red and Green colors
HMAs:
As default settings 20 HMA is considered as lower period and 50 HMA is considered period for the calculation
Trade What You See:
This indicator will help to see how the setup of particular instrument coming up. Users/Traders can use and trade based on what they see and interpret from it.
Disclaimer:
Idea of publishing this script is to identify the strength of the instrument using multiple confirmation.
Using this indicator, changing inputs (show/hide/change period), and trading decisions are up to the users/traders.
Courtesy:
Thanks to inventors of HMA (Alan Hull), PSAR(Welles Wilder) as these inputs are used to make some calculations

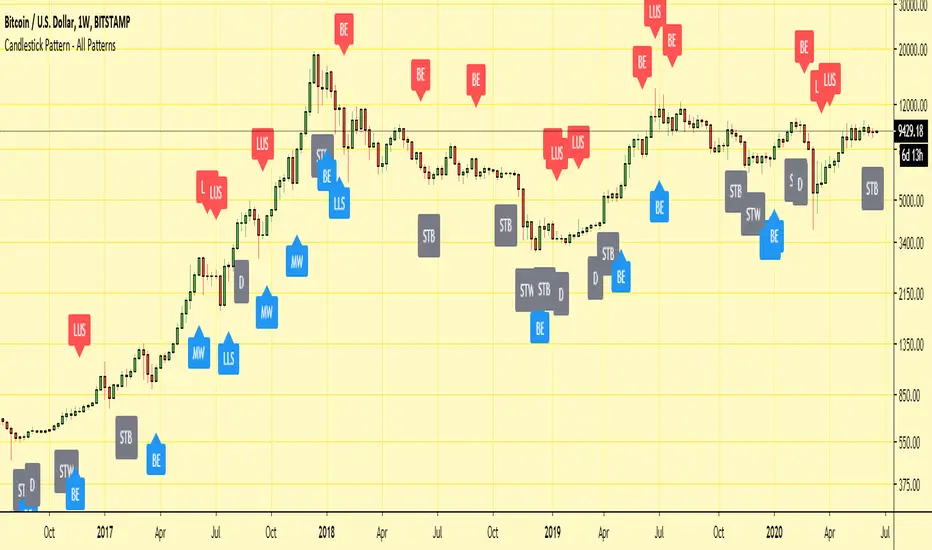
Candlestick Pattern - All PatternsHi,
Here I have collated all of the in-built TradingView candlestick patterns into one indicator.
It works on all time frames and can be useful for candlestick traders to quickly spot patterns forming on any chart.
It also allows for all individual patterns to be set up as seperate alerts within the same indicator.
Any issues/suggestions/requests let me know.
Enjoy!
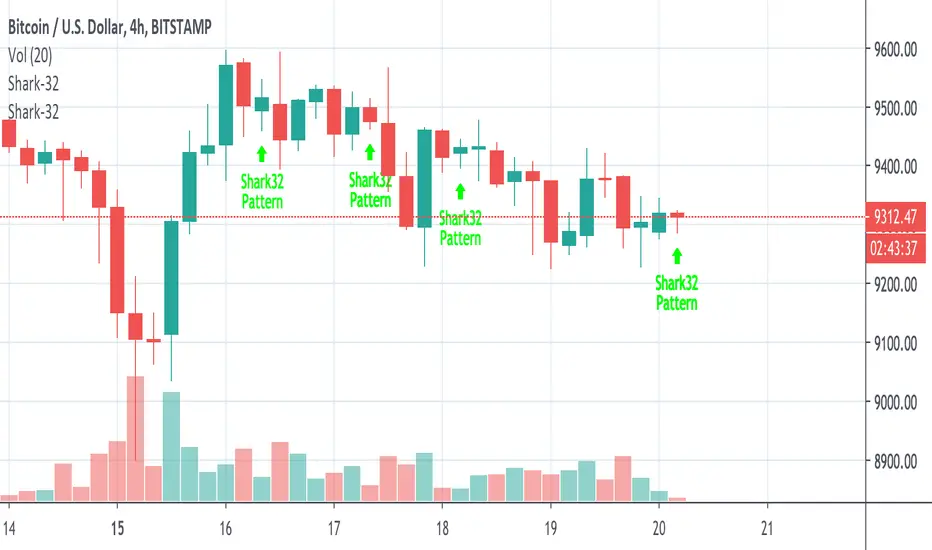
Shark-32 Pattern for Candle sticks AnalysisThis script is the perfect strategy for the all mighty shark-32 pattern.
It shows the power tussle between demand and supply before either of them finally gives up.
Hide Active BarWe are not supposed to make trading decisions based on active bars (bars that have not closed), right? Well sometimes my trigger finger gets a little twitchy when I'm awaiting an entry and an active candle starts to pull away or I'm in a trade and an active candle pushes against me.
Therefore, I made a VERY simple indicator that ghosts the active bar. You can see the outline but the body is transparent to emphasize that you should await its close before deciding what to do...
Very simple script but hopefully it will help me (and others) to remain a little calmer in the moment.
In case the bar recolour does not show in the main image - here it is below.
EMA CandlesIndicator that draws EMA candles as overlay. Uses the EMA values for Open, Close, High, and Low each individually to draw each EMA candle. Set at 30 bar EMA by default.