Multi Timeframe Moving Average [xdecow]This indicator plots a moving average of 4 different timeframes.
The types of averages available are: SMA, EMA, DEMA, VWMA, RMA, WMA.
Double Exponential Moving Average (DEMA)

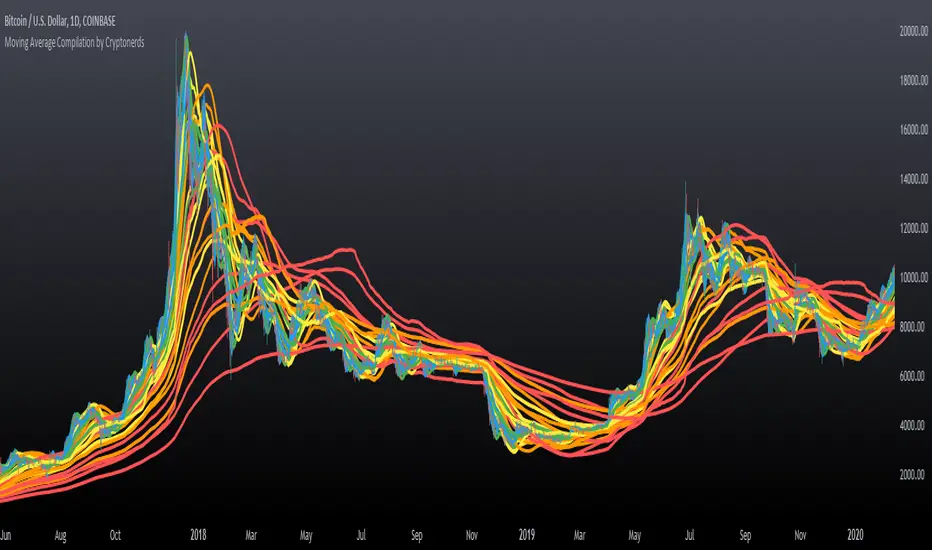
Moving Average Compilation by CryptonerdsThis script contains all commonly used types of moving averages in a single script. To our surprise, it turned out that there was no script available yet that contains multiple types of moving averages.
The following types of moving averages are included:
Simple Moving Averages (SMA)
Exponential Moving Averages (EMA)
Double Exponential Moving Averages (DEMA)
Display Triple Exponential Moving Averages (TEMA)
Display Weighted Moving Averages (WMA)
Display Hull Moving Averages (HMA)
Wilder's exponential moving averages (RMA)
Volume-Weighted Moving Averages (VWMA)
The user can configure what type of moving averages are displayed, including the length and up to five multiple moving averages per type. If you have any other request related to adding moving averages, please leave a comment in the section below.
If you've learned something new and found value, leave us a message to show your support!
Multi Time Frame Moving Averages [Anan]Hello friends,
All your popular moving average now in one indicator, also no need to open a lot of tabs to see where is that moving average at that time frame,
with multi time frame feature, now u can see up to six multi time frame MA in the same chart with option to show/hide it
list of moving averages:
SMA
Smooth SMA
SuperSmooth MA
EMA
DEMA
TEMA
Triangular MA
QEMA
RMA
Hull MA
KAMA
WMA
VWMA
VWAP
CTI
LSMA
VIDYA
Blackman Filter
Adaptive RSI
also there is an option to see the Average of four lengths, i backtest this and found it super great !

FishNet Doubled hullMA Reactive ColorsMoving averages are used to determine trend. These moving averages are designed to determine trend with reactive coloring and utilizes a unique version of the Hull moving average. This is one of many iterations of fishnet MAs I have made in the past.
I first found fishnet MAs, which is a lot of moving averages of increasing length, from @TusenPix
YMMV on actionable information :p

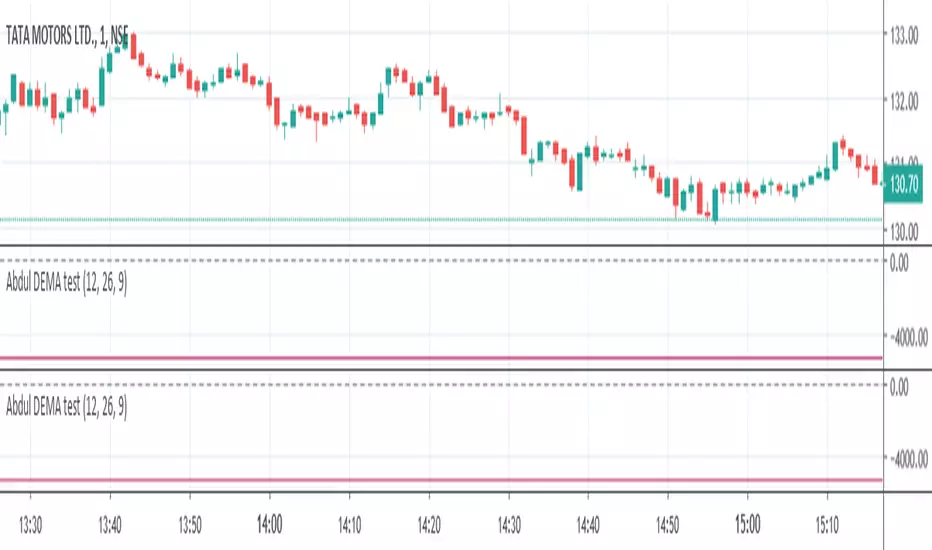
TEMA, DEMA and SMA with crosses with alert functionality
Just a crude but functioning ma indicator with bullish and bearish crosses and alert functionality.

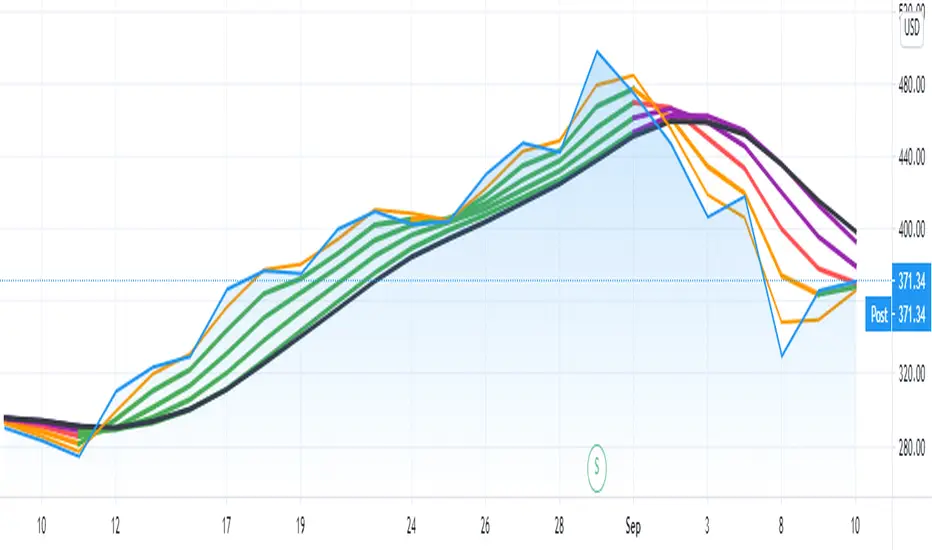
Tillson T1 to T4 This is to expand on a previous publication on Tillson's T3 and add a T4 signal.
For the filter f = (1+a)x-ax^2
T1 = f
T2 = f*f
T3 = f*f*f
T4 = f*f*f*f
The above plotted produces a ribbon set of moving averages.
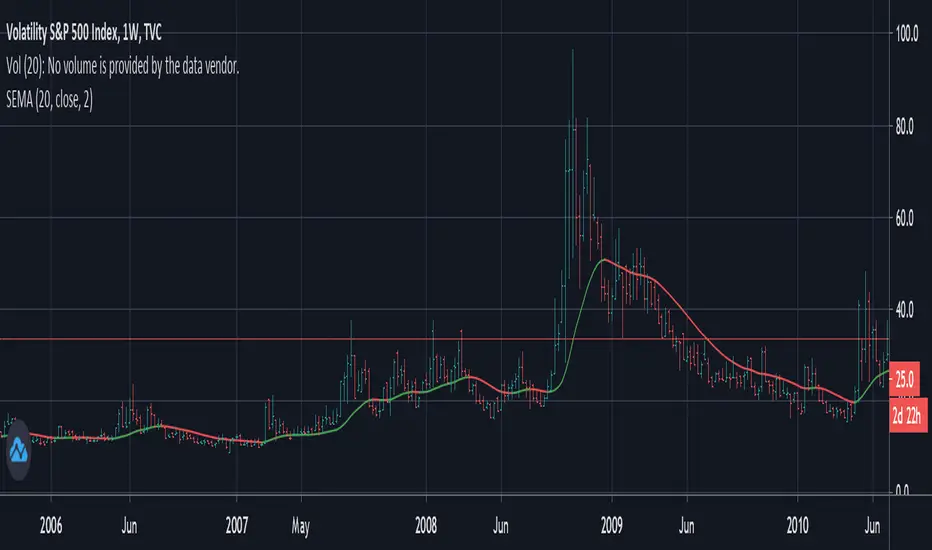
Slow/Smooth Exponential Moving Average [SEMA}An almost impossibly smooth moving average that is convenient for any application where a moving average is needed and where noise reduction is more important than responsiveness to very recent data. You get to choose what the S stands for.
Built by taking a weighted difference between two EMA's in such a way that the contribution of the latest value is cancelled out, while staying a proper moving average with all weights greater than zero, and with the first moment picked to be the same for a given length as the sma. Still has a somewhat ema-like behaviour in the sense that old values are gradually forgotten over time.
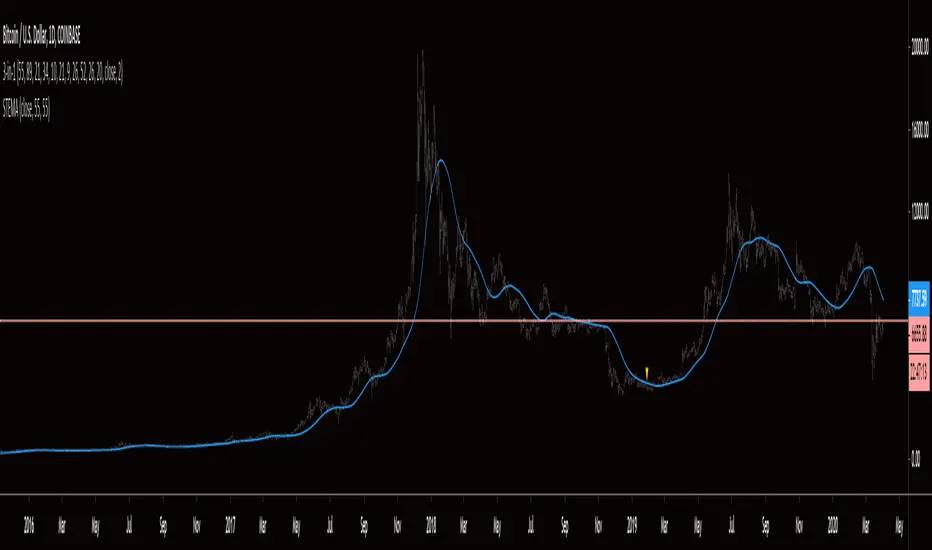
Smoothed Triple EMAThis indicator is exactly as it sounds, a smoothed triple EMA . In my personal use, it is applied to strategies to indicate direction of entries. A simple example would be if price is above the STEMA, look for long entries, if price is below the STEMA, look for short entries. Shortly, I will share a strategy that makes use of this indicator. You are welcome to message me if you have any questions. Thanks for checking it out an may the probabilities be with you!
EMA Cross <Johnson Lim>EMA Cross basically is for someone who just need to spot as a guideline whether there are 'opportunity' to buy in or out. I had been using this for few years and it always helps for me at the stage of screening typically on Crypto space.

Trend-Corrected EMAEMA is a lagging indicator, but we can do better by correcting it with its first and second derivative, which may be more theoretically sound than how DEMA and TEMA are trying to achieve the same.

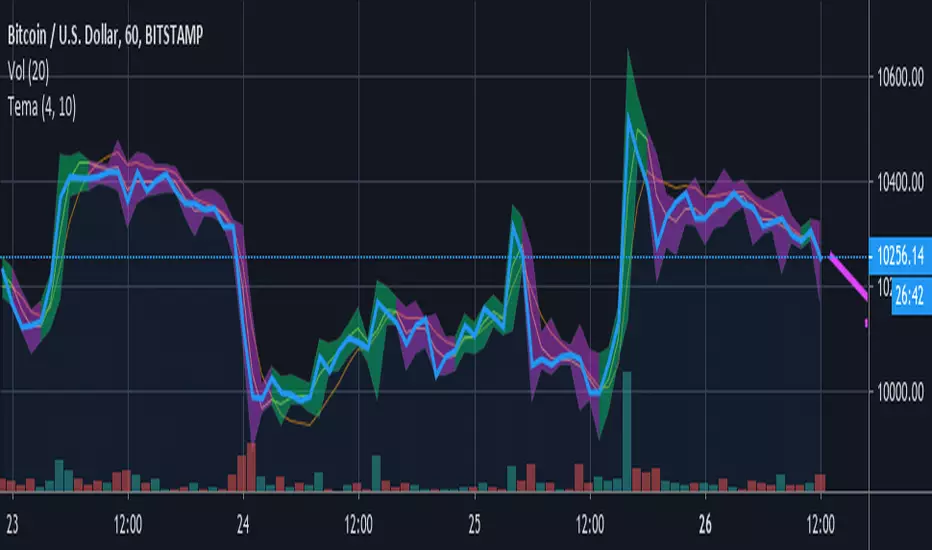
Team TemaTema highlights bars based on the triple ema ( tema ) with two different length qualifiers.
The tema is believed to react quicker to price fluctuations than the simple moving average ( sma ), the exponential moving average ( ema ), and the double ema ( dema ). The shorter length tema crossing over the longer one is believed to indicate a bullish trend ahead, highlighted in green. The shorter length crossing below the longer one may indicate a bearish trend is on the way.
Benefits.
It has been found that most traders lose money because they panic early, and don't let profits run. Tema helps me to filter out trading noise , reduce stress and stay in profitable trades longer . Highlighting the candle wicks reveals trends in highs and lows that may be difficult to see otherwise. I like being able to adjust the settings and look back to see how much noise would have been good to filter out.
Things to watch out for.
Like other moving averages, the tema is a lagging indicator , vulnerable to false signals, especially during a large move up or down . Use with other indicators that are better designed for detecting tops and bottoms. Adjust the lengths to filter out what you think may be wrong signals. The settings are subjective , and it depends on the security and the time period. Manually create a note or reminder with your favorite settings for each. You may choose how much price fluctuation to filter out by going into settings, marked with the gear icon.
Unconfirmed sentiment arrow.
Tema draws an arrow of current sentiment , based on the unconfirmed price action of the faster tema. It shows where it thinks prices are presently going, barring other factors. Its main purpose is to extend a line from the end of the tema, so it is not difficult to see. Remember, it is probably wrong until the last bar closes. And even then, buyers or sellers could come along at any moment and change the outlook.
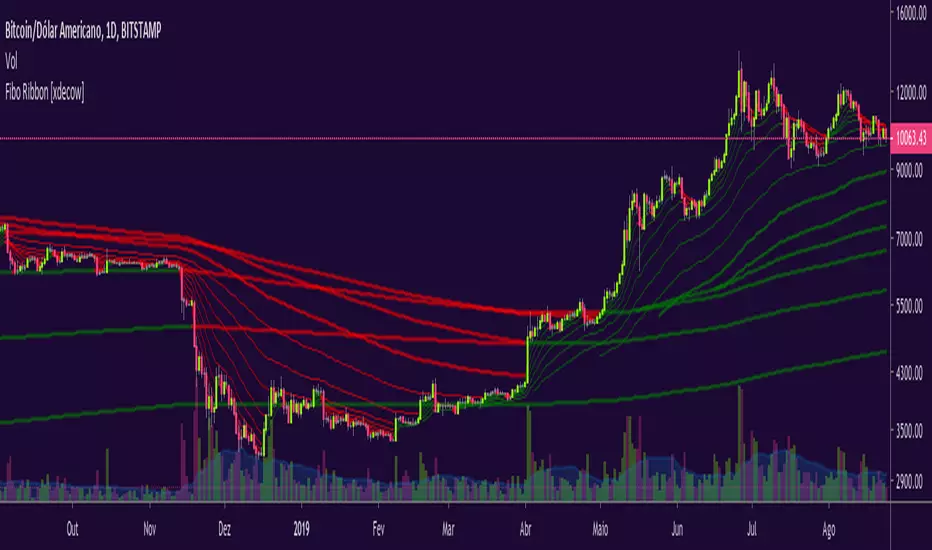
Fibo Ribbon [xdecow]Fibonacci emas sequence:
2, 3, 5, 8, 13, 21, 34, 55, 89, 144, 233, 377, 610, 987, 1597
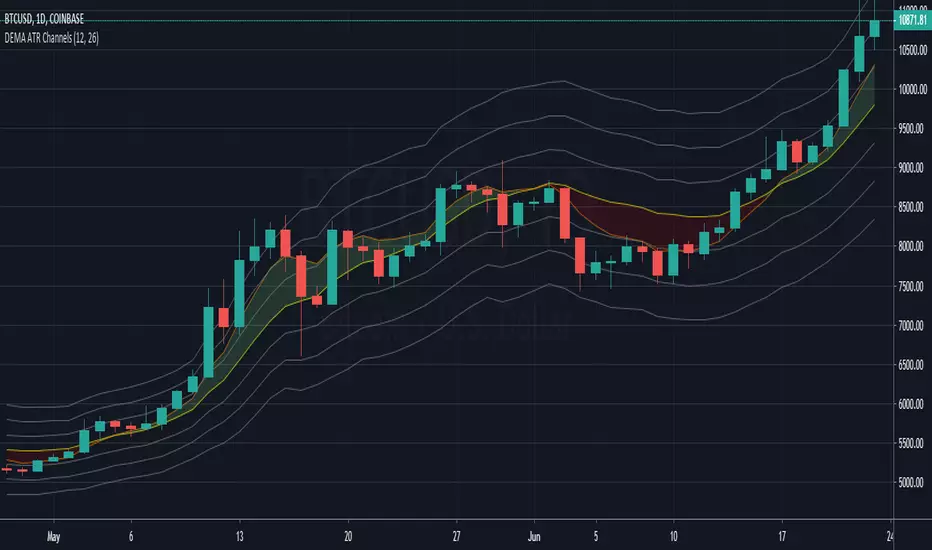
DEMA ATR Channels - New IndicatorA Double Exponential Moving Average (DEMA) with three sets of channel lines each one Average True Range (ATR) apart, above and below the DEMA.
Similar to my "ATR Channels" indicator, but using a DEMA instead of an EMA for the base. In addition, this indicator also plots a fast DEMA as well as a fill between the two. Fully customizable, you can toggle both DEMAs, the fill, and each set of ATR Channels.
ATR channel idea from Kerry Lovvorn as mentioned in Elder's "New Trading for a Living", page 93: "Kerry Lovvorn likes to plot 3 sets of lines around a moving average: at one, two, and three ATRs above and below an EMA . These can be used for setting up entry points and stops, as well as profit targets."
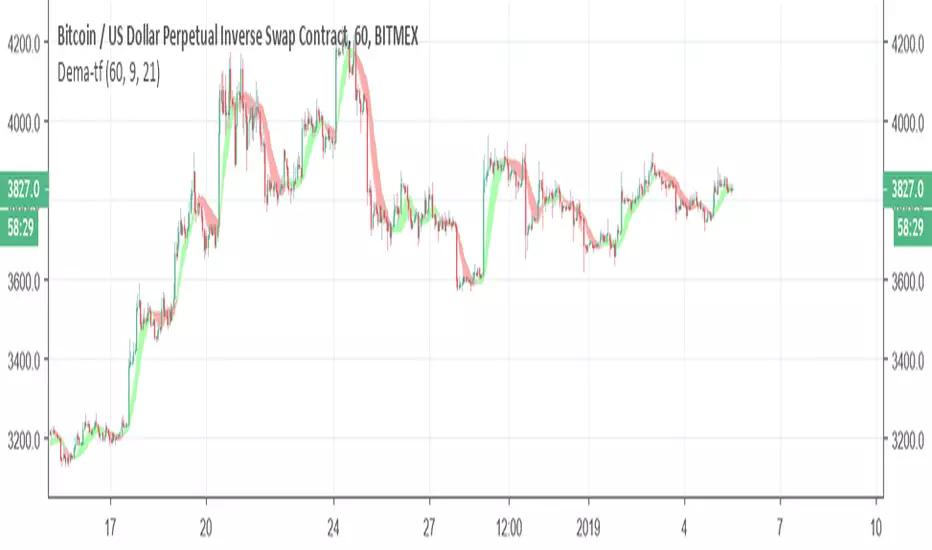
Dema-tfNice Dema with TF function
design to help you to see trends better and to use it as a backbone for indicator that you choose with DEMA
can help you to see trend or filter bad signals
make the TF =to the graph timset or higher
The mTF is non repainting
DEMARSIV1 alerts and take profitThis version is the same as DEMARSI with following differences
I add take profit to short and long when DEMA MTF 1 is crossing DEMA MTF 2 (they are calculated different that why when you increase int2 in min to longer time the difference between them increse)
if you want the TP to be on signal of fast and slow DEMA RSI 2 (just change the code inside) by putting the long cond to be as the buy cond
for any questions please ask

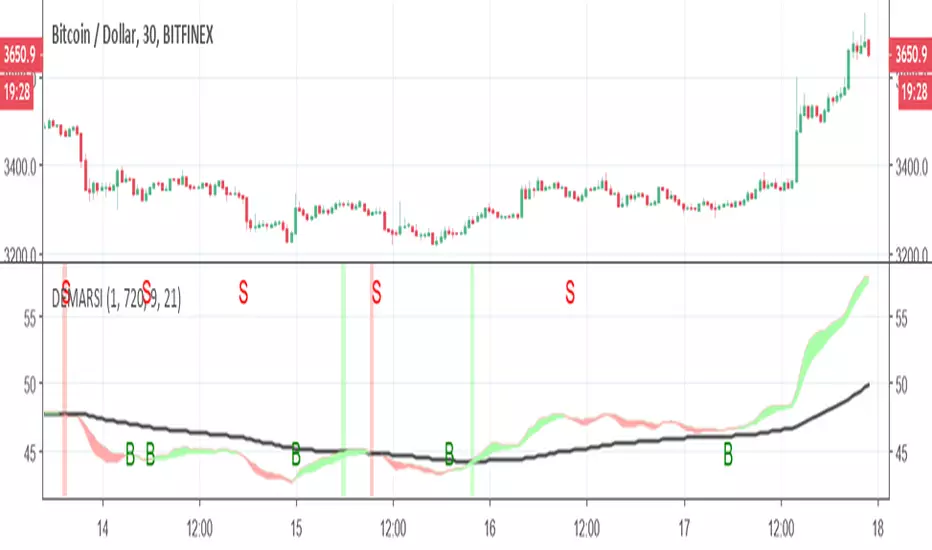
DEMARSIThis is little tricky indicator but you need to understand how its work in order to make it easy to understand
The black line is DEMA RSI hybrid which is made on the MTF length that is not repainting.
The green and red zones are also DEMA RSI that is calculated in different way (the cross between the fast and the slow moving create the color change and the signal.
you can buy or sell using the signals shown (no alerts given) but it easy to add. the since the first MTF DEMA RSI is slower the the other ones we can use it as base . so lets say you enter in green and the second DEMA is still above the black line the trend is still forward and even if you get sell signal you still can hold the coin as it expected to rise further . on the other hand once you get sell signal in red and its fall down bellow black line then it the true end of the buy period. you need to find best condition for your purpose which mean to play with setting (here I put 240 MTF over rsiDEma kegth 21) , other options can be better (did not test it).
here without the cross signals of dema rsi 2
here with MTF 120
DEMA-MTF with alerts This model based on DEMA with non repainting MTF
if you want to change the MTF use int2
buy and sell show in triangke signals
alerts included
you can smooth the signal with len1 if needed


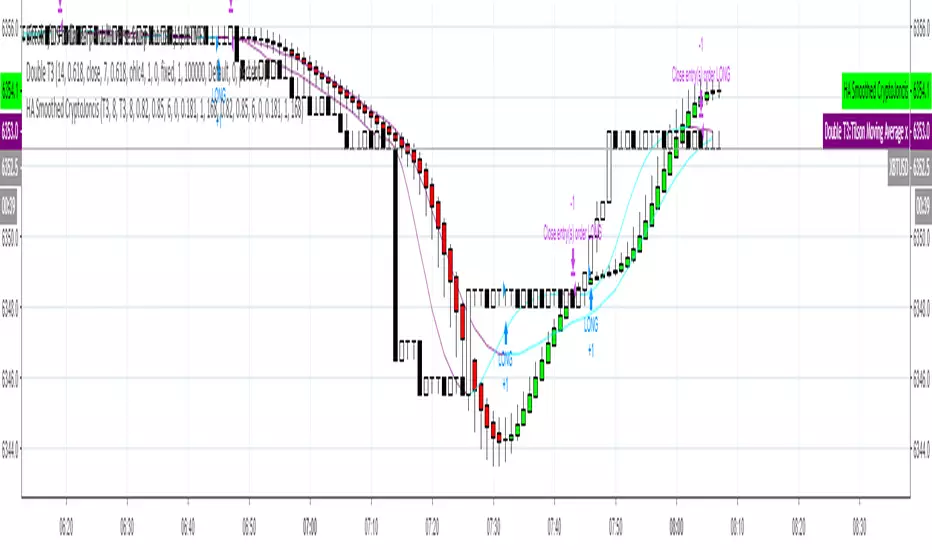
Heikin-Ashi Smoothed with option to change MA types CryptoJoncisPine Script version=3
Author CryptoJoncis
Heikin-Ashi Smoothed
The Heikin-Ashi Smoothed study is based upon the standard Heikin-Ashi study with additional moving average calculations. The following is the calculation formula for the bars:
1. The current bar Open, High, Low, Close values are smoothed individually by using the moving average type specified by the Moving Average Type 1 Input with a length/period specified by the Moving Average Period 1 Input.
2. The Heikin-Ashi bar Open, High, Low, Close values are set using the smoothed values from step 1. This is performed using the standard Heikin-Ashi formula.
3. The final Heikin-Ashi Open, High, Low, Close values are calculated by doing a second smoothing of the bar values from step 2 by using the moving average type specified by the Moving Average Type 2 Input with a length/period specified by the Moving Average Period 2 Input.
If you choose to tick the box where it offers to use only one smoothed HA then it skips the third/final step and you do not need to choose the second MA type for it to work.
Remember, using FRAMA, always make sure you use even number for length.
For simple Heikin-Ashi, please tick single smoothed and DEFAULT (Not smoothed as there are no MA used)
Heikin-Ashi bars are calculated:
1. Close = (Open + High + Low + Close) / 4
This is the average price of the current bar.
2. Open = (Open of Previous Bar + Close of Previous Bar) / 2
This is the midpoint of the previous bar.
3. High = Max of (High, Open, Close)
Highest value of the three.
4. Low = Min of (Low, Open, Close)
Lowest value of the three.
Any questions/suggestions/errors or spelling mistakes? Please leave a comment and let me know. I will try to fix it.
This took me few days to finish, so I hope you will find it useful.
Would you like to have more MA type choices? Please comment down with any other which aren't included in this indicator and I will research them and add.
MA included in this script:
Tillson Moving Average (T3)
Double Exponential Moving Average (DEMA)
Arnaud Legoux Moving Average (ALMA)
Least Squares Moving Average (LSMA)
Simple Moving Average (SMA)
Exponential Moving Average (EMA)
Weighted Moving Average (WMA)
Smoothed Moving Average (SMMA)
Triple Exponential Moving Average (TEMA)
Hull Moving Average (HMA)
Adaptive moving average (AMA)
Fractal Adaptive Moving Average (FAMA)
Variable Index Dynamic Average (VIDYA)
Triangular Moving Average (TRIMA)
You can use,publish,modify this code in any way as you wish, but only if you reference me after.
You are not allowed to sell it as it is.
If this code is useful to you, then consider to buy me a coffee (or better a pint of beer) by donating Bitcoin or Etherium to:
BTC: 3FiBnveHo3YW6DSiPEmoCFCyCnsrWS3JBR
ETH: 0xac290B4A721f5ef75b0971F1102e01E1942A4578
References:
www.sierrachart.com
www.investopedia.com
www.binarytribune.com
www.investopedia.com
www.stockfetcher.com
www.mql5.com
www.incrediblecharts.com
help.cqg.com
www.blastchart.com
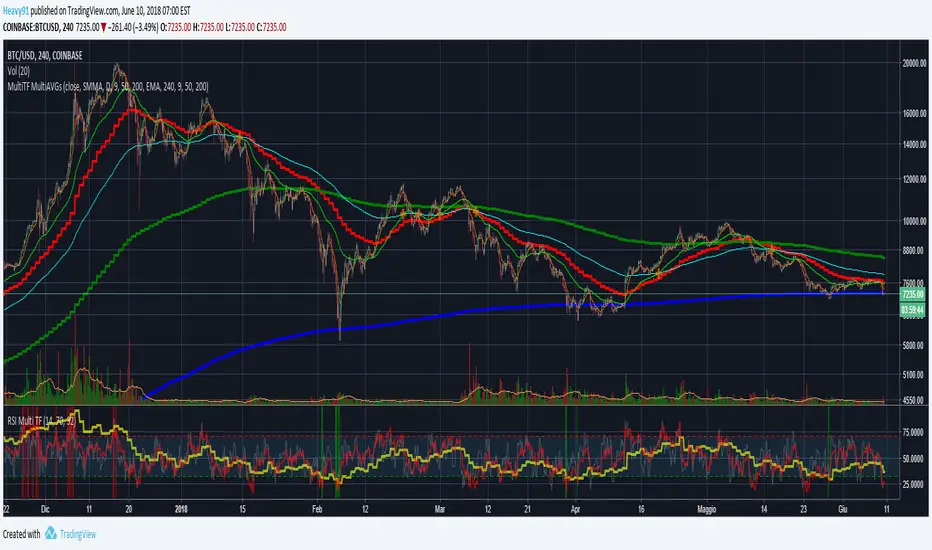
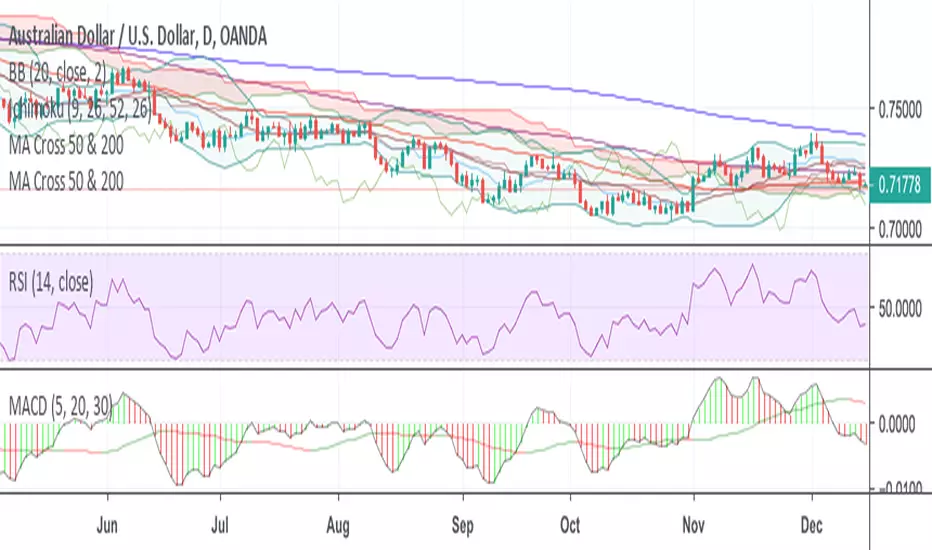
Ultimate 'Multi-Timeframe' Multi-AveragesPlots different kinds of averages (EMA, SMA, SMMA, WMA, VWMA) referred to a fixed timeframe/period indipendent from the one that you are watching (example: plot daily EMA on the 4h chart).
Highlights the crossing of averages.