Divergence
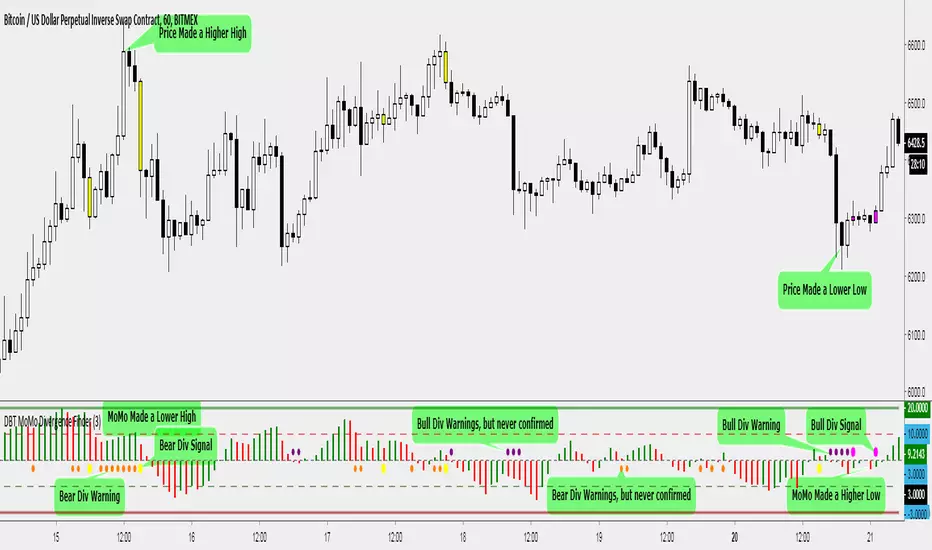
DBT MoMo Divergence FinderThis is a variation of the DBT MoMo created to help find divergence patterns on any time frame.
A divergence is found when price makes a higher high, but the MoMo makes a lower high (bear divergence) or when price makes a lower low, but the MoMo makes a higher low (bull divergence).
This indicator has warning signals and confirmation signals when a divergence is found. Due to the extreme difficulty in coding a divergence indicator properly there are still false signals. Make sure to use basic technical analysis to confirm a divergence signal before trading it.
This indicator allows you to make alerts for Bull and Bear divergence signals, also crossing above 10 or below -10 signals.
You may use this indicator for momentum, but I do not recommend it. If you would like to use this indicator to find momentum signals please use the original version of the DBT MoMo. This indicator was made specifically to showcase divergence signals.
In the settings there is an option to change the histogram colors to match your warning colors.
The default colors are made for a dark background, if you trade on a light background like myself please feel free to change the colors to suit your needs.
Use at your own risk. This is not financial advise and this indicator is not guaranteed to make you profits. Please message me if you have any questions or feedback. Enjoy.
This indicator is apart of my indicators package, if you would like a trial access please feel free to message me.
RSI or MFI %BPlots where RSI or MFI is inside its Bollinger Bands. Various strategies: good to see the trend (above/below average), overbought/oversold conditions (you could work a strategy around RSI getting out of overbought/oversold conditions as shown in the screenshot), divergences, etc...
I will also publish a Bollinger Bands width of RSI to identify areas of squeeze in volatility
Enjoy!

08-2018 Stochastic 5m [ALERT SETUP] [INDICATOR]This is an accumulation of small buy orders and a complete sell order strategy, that can be used for manual trading or for a trading bot. The strategy is based on stockastic divergences ( an indicator that I made myself and is published on my profile earlier ), and I added my personnal touch of course. Note that the bullish and bearish stochastic divergences are calculated separately and can be configured in the inputs.
To be used with a 5m timeframe, and on a flat or bullish pair.
Everyone can favorite the script, apply it to the chart, but only I can see or modify the code. If you need anything, leave a comment, thanks :D
More info about the script, such as inputs description, how to configure the script, strategy explanation, alert configuration can be found here : blockchainfiesta.com
--------------------------------------------------------------------------------------------------------------
I do commission work: TradingView Pine Script development & Reverse Engineering.
contact@blockchainfiesta.com.
You can also send me a message in TradingView or Discord (discord.gg)
Bitcoin address: 19sVQvCDmVfEACq7BiMnWSMqFPZ8qfSQ2K
ETH address: 0xc8a5d3a63a05db0c2363ea1c08b37a01cce9ebfb


EMA Cross for Long and Short with Stoch/MACD/RSI + IchimokuPrimary and Secondary EMA Cross analysis for Long and Short with Stoch/MACD/RSI Analysis + Ichimoku Cloud
The script will let you choose to show (or not):
*Primary EMA Trend
*Secondary EMA Trend
*Stochastic Alerts
*MACD Alerts
*RSI Alerts
*LONG or SHORT Alerts
It will also let you configure the EMA periods. ichimoku, MACD and RSI seetings
The cost to the tool is 0.005BTC.
For custom scripts send me a PM.

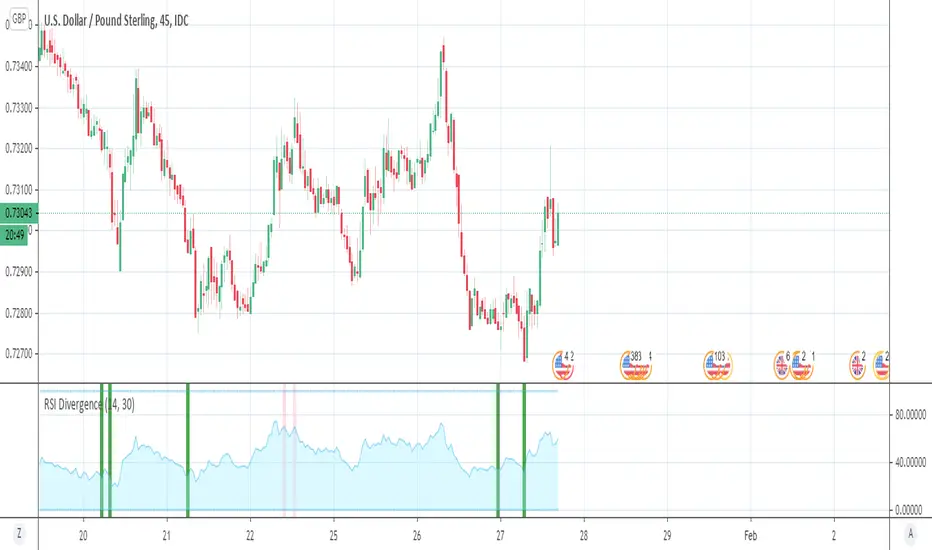
RSI DivergenceSimple RSI Divergence with adjustable lookback period.
Highlights bars with higher price but lower RSI (bearish) or lower price but higher RSI (bullish) than the highest/lowest points in the lookback period.

Moving Average Convergence/Divergence LineMACD Line instead of MACD histogram or area. This gives more opportunities to catch divergences.
I showed regular MACD Histogram on top and then this indicator on bottom and showed with the red and green lines where you could catch multiple bearish and bullish divergences using this indicator vs a regular MACD histogram.
Send me a private message to join my trading group.
Thank you.

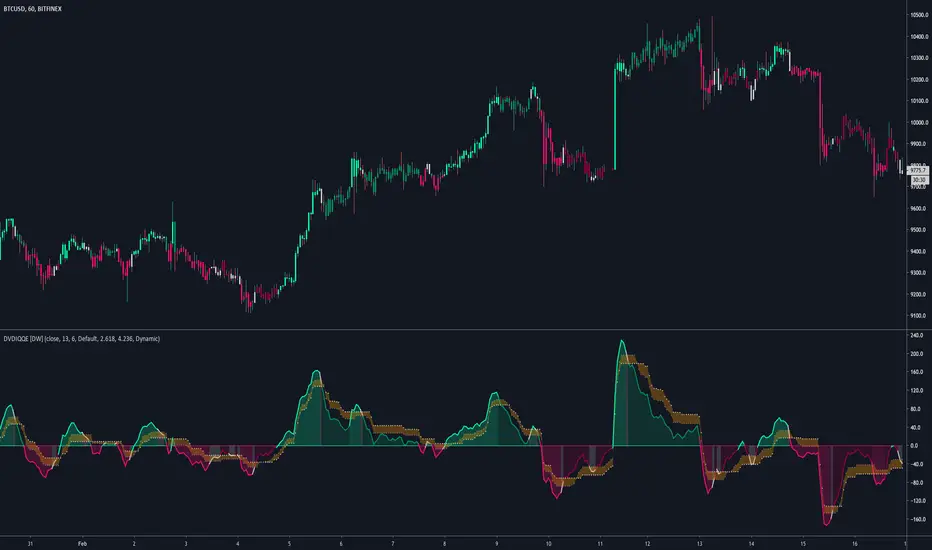
DVDIQQE [DW]This is an experimental study inspired by the Quantitative Qualitative Estimation indicator designed to identify trend and wave activity.
In this study, rather than using RSI for the calculation, the Dual Volume Divergence Index oscillator is utilized.
First, the DVDI oscillator is calculated by taking the difference between PVI and its EMA, and NVI and its EMA, then taking the difference between the two results.
Optional parameters for DVDI calculation are included within this script:
- An option to use tick volume rather than real volume for the volume source
- An option to use cumulative data, which sums the movements of the oscillator from the beginning to the end of TradingView's maximum window to give a more broad picture of market sentiment
Next, two trailing levels are calculated using the average true range of the oscillator. The levels are then used to determine wave direction.
Lastly, rather than using 0 as the center line, it is instead calculated by taking a cumulative average of the oscillator.
Custom bar colors are included.
Note: For charts that have no real volume component, use tick volume as the volume source.
SIMPLE DIVERGENCESimple Divergence Indicator built specifically for the Quick-Fire Strategy, but can be used to compliment any strategy and/or timeframe. Please learn what divergence is and how to chart on your own before using. Thank you.
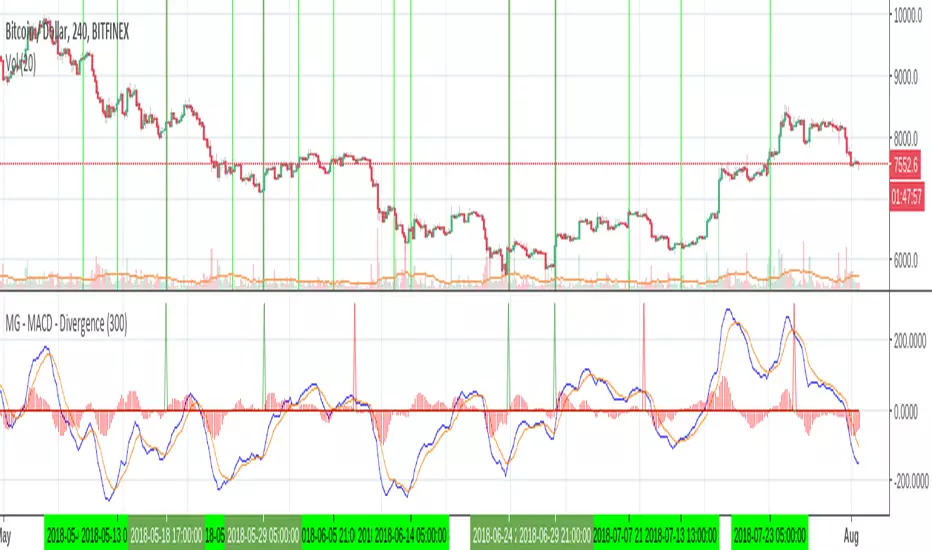
MG - MACD - Divergence - 1.0The MACD indicator can produce some powerful divergence signals which can be useful confirmation for entering / exiting a trade.
This indicator generates and alert and plots (if enabled), when a divergence is detected. For example, if bullish (above zero) and two bearish MACD crosses are detected with the second being lower than the first, a bearish divergence alert is triggered. Theoretically a good place to take profit / possibly enter a short position if you have further confirmation.
Can also be configured to include continuation signals i.e. a bullish trend with two bullish MACD crosses where the second is higher than the first. This could indicate more bullish action ahead.
In order to illustrate how this indicator helps to sift out a good amount of false signals, I have highlighted in the above image in dark green, all of the divergence buy signals highlighted by the indicator and in light green, the rest of the MACD buy signals.

Volume Plus (Volume+)View Total Volume, Bull Volume, and/or Bear Volume. View Volume Effectiveness to reveal how Volume has effected the price. View the Moving Average of any of the above metrics, selecting one or more types of moving averages(SMA, EMA, RMA, SWMA, VWMA, WMA, or ALMA). Create nearly infinite crossovers by activating the Secondary Moving Average and choosing a longer or shorter Length. Use the highlighter to quickly filter out noise and focus the events you're searching for, by choosing one or more highlight-scenarios from the Highlighting Menu. Use the Average Amplifier to fine tune your Highlighting results.
Use as an ordinary Volume Indicator
Show the Bullish volume within Total Volume
Show the Bearish volume within Total Volume
Show the Bullish and Bearish volume simultaneously within Total Volume
Create crossovers like this one, Bullish Volume Average with Bearish Volume Average
Show the gas mileage of volume, the Volume Effectiveness
Create crossovers like this, Volume Effectiveness 14 with Volume Effectiveness 60
Use Amplifiers to show things that are usually out of scale with one another, like Volume Effectiveness with Volume
Use the Highlighter to show anything, like here, when Bearish Volume was above average AND Volume Effectiveness was under average
From left to right, the Indicator Values are as follows:
1) Total True Volume (red, green, or gray when viewed alongside Bulls/Bears)
2) Volume Winner - Bulls v/s Bears (red or green)
3) Volume Loser - Bulls v/s Bears (red or green)
4) Volume Effectiveness (blue)
5) Design Spacer - Ignore This (green)
6) Design Spacer - Ignore This (red)
7) Total True Volume Primary Moving Average (dark gray)
8) Total True Volume Secondary Moving Average (dark gray)
9) Inferred Bullish Volume Primary Moving Average (dark green)
10) Inferred Bullish Volume Secondary Moving Average (dark green)
11) Inferred Bearish Volume Primary Moving Average (dark red)
12) Inferred Bearish Volume Secondary Moving Average (dark red)
13) Volume Effectiveness Primary Moving Average (blue)
14) Volume Effectiveness Secondary Moving Average (blue)
Click the sprocket and you'll find the following settings (which are explained below):
Total True Volume - This is your everyday, ordinary volume indicator, a total sum of the volume from each candle.
Inferred Bullish Volume - This subtracts Bearish Volume out of the Total True Volume. But without the bull-volume data from the exchange, we can only forensically infer the bullish volume by evaluating OHLC data to guess what ratio of upward v/s downward movement happened within the candle.
Inferred Bearish Volume - This subtracts Bullish Volume out of the Total True Volume. But without the bear-volume data from the exchange, we can only forensically infer the bearish volume by evaluating OHLC data to guess what ratio of downward v/s upward movement happened within the candle.
Volume Effectiveness - This shows how much price movement occurred for each unit of Volume, by dividing the Price Change of each candle by the Total True Volume of each candle. If this volume were gas-mileage, then Volume would be the gas and Price would be the mileage.
• Inferred Effectiveness - Rather than using the Price Change divided by the Total True Volume, this method of determining Volume Effectiveness uses the Total Price-Mileage divided by the Total True Volume. The Total Price-Mileage is determined by figuring the high minus low, the wick times two, and the tail times two, and ad

EdgeAnalysisGroup: Rare DivergenceThese are rare RSI Divergence situations that will rarely show, but has a very high success ratio for most tested timeframes. It is a lot better at calling the Shorts than Longs currently. More versions coming soon.
If you have any questions feel free to reach out to me or any Edge Analysis Group staff. Enjoy the latest free script!

DBT BandsThe DBT Bands were designed in cooperation with RollinInCrypto. They are bands that find bull and bear divergences. These divergences are perfect in conjunction with the bands for sideways trading. Once a gold ray has formed it is signaling a bear divergence and you should take a short position if price action is confirming a bear move. Maintain a tight stop and target the mid or lower bands. Once a purple ray has formed it is signaling a bullish divergence and you should be looking for a long position if price action is confirming the move. Maintain a tight stop and target the mid or upper band. This indicator is best used on a 15min or 30min time frame on BTCUSD. Do not trade divergences in very strong trends, the divergence is typically not strong enough to reverse the trend. It is best to trade these divergence in a clear sideways pattern when the bands are not too expanded and price is consolidating.
Use at your own risk. This is not financial advise and this indicator is not guaranteed to make you profits. Please message me if you have any questions or feedback. Enjoy.
This is the Official release of the DBT Bands. It will be available on my website upon launch. Please do not ask for access. If you would like access please go to my website once it releases, Thank You.

Dane: RSI MACD StrategyRSI / MACD Divergence Strategy . Published for customer verification and acceptance. Unfortunately, access can only be provided to the customer.
For those interested in custom development services, please visit the backtest-rookies (.com) website for more information.
Features
RSI & Price divergence detection
Open a trade window when trade conditions are met
Enter the trade on confirmation
Stop losses / take profit custom levels based of daily pivot values

Longs Shorts & Divergence (LSD) (Ratio, Diff, Total) [cI8DH]This indicator automatically identifies the ticker for the current chart and shows margins at Bitfinex (or any other exchange if listed on Tradingview). So if your chart is reading EOSUSD at Kraken, this indicator will show EOSUSDSHORTS and EOSUSDLONGS at Bitfinex.
Features:
- Total of longs + shorts ("could" be an indicator of market attractiveness)
- Difference between longs and shorts (good if you want to have only one chart)
- Longs to total margin ratio in percentage
- Highlighting of indicator background when margins diverge too much from price (sensitivity of divergence is adjustable, divergence can be applied to longs, -shorts, longs+shorts, longs-shorts)
- Price factoring (gives a consistent metric when switching between different coins)
- Tickers can be set to a fixed value or automatically extracted from the current chart (fixed is useful for hybrid tickers)
- Margin exchange can be modified (default is Bitfinex)
- Offset for longs (helps with scaling)
Read the description in the TA below for getting access to this script.

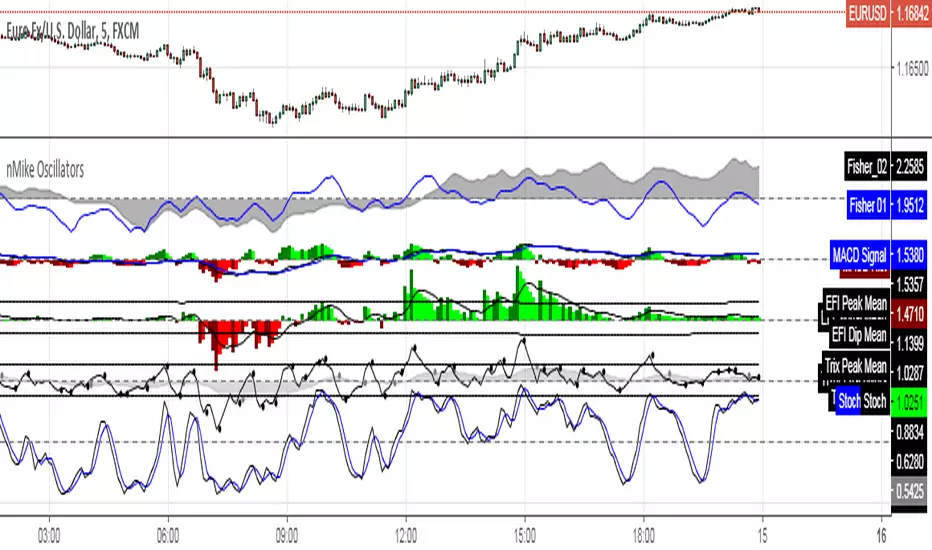
[RS]nMikes Divergence OscillatorsOscillator Package used for nMike's trading system.
Note: this is still in development, so use at your own discretion.
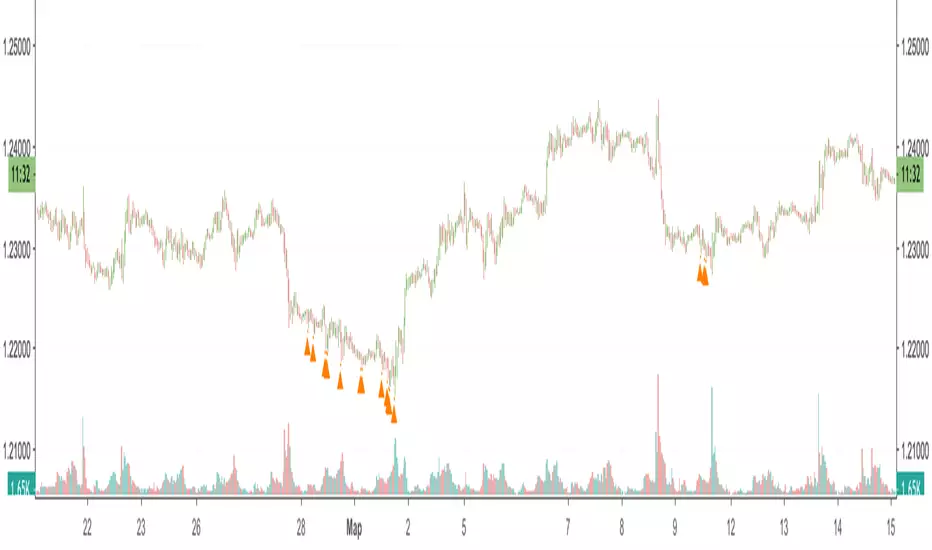
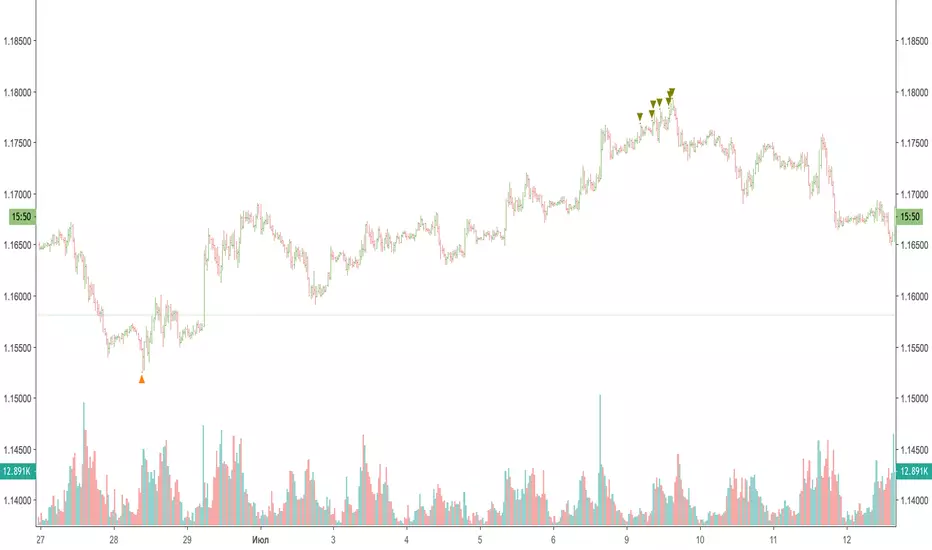
Divergence FlagUsed to spot divergences in the RSI. Currently does not deal with any hidden divergences.
Bearish Divergence
White means comparing Price and RSI to candle with lowest Price in the range and RSI is higher but Price is lower
Yellow means comparing Price and RSI to candle with lowest RSI in the range and and RSI is higher but Price is lower
Bullish Divergence
Red means comparing Price and RSI to candle with highest Price in the range and RSI is lower but Price is higher
Orange means comparing Price and RSI to candle with highest RSI in the range and and RSI is lower but Price is higher
Range and Colours and be Changed in Inputs. White and Red take preference over Yellow and Orange respectively.


