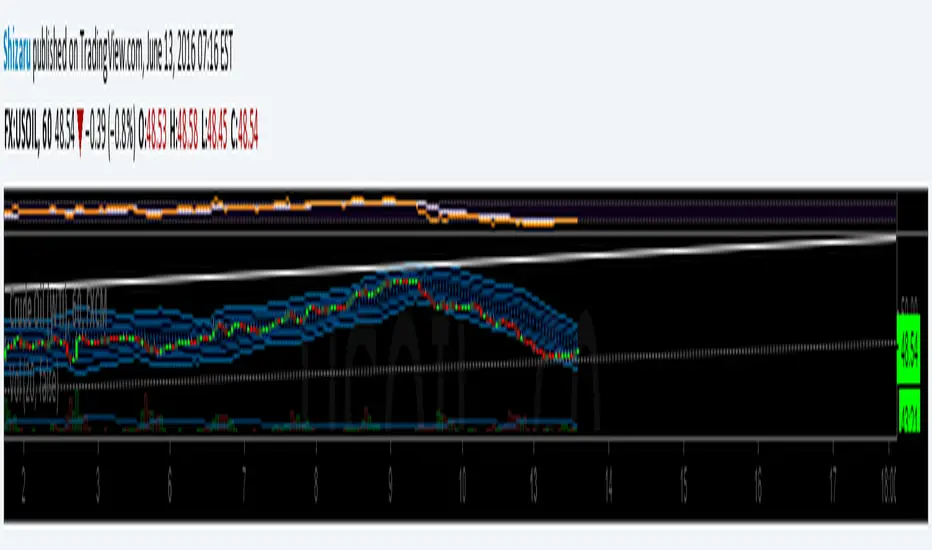
Gain/Loss TrackerHi,
This script's purpose is to provide a really quick view of gain/loss of a buying price.
As it is my first script, it is not perfect.
You have to select % scale and input your buying price in the options.
I'll continue to work on it to :
- make an auto selection of % scale (if possible)
- render different colors (positive/negative differentiation in relation to the buying price)
Updates 11/10/2017
- default precision set to 8 (for satoshis)
Easy

Directional Movement Index 4 colors (DMI 4c)It is a normal Directional Movement Index, but instead of using lines for +DI and -DI it uses histogram and 4 colors. It also contains an horizontal line (default value @20) to indicate when a trend is confirmed or not.

RSI DivergenceRSI DIVERGENCE is a difference between a fast and a slow RSI. Default values are 5 for the fast one and 14 for the slow one.
You can use this indicator in 2 different ways:
normal RSI : check double or triple top/bottom on a chart meanwhile RSI is descending/ascending (check the example on chart)
signal line : when RSI Divergence cross zero line from bottom to top you get a buy signal (the line become green), vice versa when the RSI Divergence cross zero line in the opposite way you get a sell signal (the line become red)


Fractal Dimension Adaptive Moving Average (D-AMA)etfhq.com
Overall the D-AMA produced results that were near identical to that of the FRAMA but the D-AMA is a slightly faster average.
It is very difficult to pick between the FRAMA and the D-AMA but becuase the FRAMA offers a slightly longer trade duration it the best Moving Average we have tested so far.

Bollinger Bands Fibonacci ratiosThe Fibonacci Bollinger Bands indicator is based on the same principles as the standard Bollinger Bands indicator developed by John Bollinger. The Fibonacci Bollinger Bands indicator bases its upper and lower bands on volatility just like the Bollinger Bands indicator does, but instead of using standard deviation as the measure of volatility, a Wilders Smoothed ATR is used in its place.
The middle band is a moving average used to establish the intermediate-term trend. The 3 upper bands are constructed by using the Wilders Smoothed ATR and multiplying it by each of the Fibonacci factors (1.618, 2.618, and 4.236) and then adding the results to the middle band. The 3 lower bands are constructed in the same manner as the upper bands except their results are subtracted from the middle band.
Fractal Adaptive Moving Average (real one)Ignore the other one (it contains some errors).
On this FRAMA you can play with length, SC and FC.
Just read on below links to understand more about this super useful moving average:
etfhq.com
etfhq.com
www.quantshare.com
