Random Coin Toss Strategy📌 Overview
This strategy is a probability-based trading simulation that randomly decides trade direction using a coin-toss mechanism and executes trades with a customizable risk-reward ratio. It's designed primarily for testing entry frequency and risk dynamics, not predictive accuracy.
🎯 Core Concept
Every N bars (configurable), the strategy performs a pseudo-random coin toss.
Based on the result:
If heads → Buy
If tails → Sell
Once a position is opened, it sets a Stop-Loss (SL) and Take-Profit (TP) based on a multiple of the current ATR (Average True Range) value.
⚙️ Configurable Inputs
ATR Length Period for ATR calculation, determines volatility basis.
SL Multiplier SL distance = ATR × multiplier (e.g., 1.0 means 1x ATR) .
TP Multiplier TP distance = ATR × multiplier (e.g., 2.0 = 2x ATR) .
Entry Frequency Bars to wait between each new coin toss decision.
Show TP/SL Zones Toggle on/off for drawing visual TP and SL zones.
Box Size Number of bars used to define the width of the TP/SL boxes.
🔁 Entry & Exit Logic
Entry:
Happens only when no current position exists and it's the correct bar interval.
Entry direction is randomly decided.
Exit:
Positions exit at either:
Take-Profit (TP) level
Stop-Loss (SL) level
Both are calculated using the configured ATR-based distances.
🖼️ Visual Features
TP and SL zones:
Rendered as shaded rectangles (boxes) only once per trade.
Green box for TP zone, red box for SL zone.
Automatically deleted and redrawn for each new trade to avoid chart clutter.
ATR Display Table:
A minimal info table at the top-right shows the current ATR value.
Updates every few bars for performance.
🧪 Use Cases
Ideal for risk-reward modeling, strategy prototyping, and understanding how volatility-based SL/TP behavior affects results.
Great for backtesting frequency, RR tweaks (e.g., 2:5 or 3:1), and execution structure in random conditions.
⚠️ Disclaimer
Since the trade direction is random, this script is not meant for predictive trading but serves as a powerful experiment framework for studying how SL, TP, and volatility interact with random chance in a controlled, repeatable system.
Educational

Holy GrailThis is a long-only educational strategy that simulates what happens if you keep adding to a position during pullbacks and only exit when the asset hits a new All-Time High (ATH). It is intended for learning purposes only — not for live trading.
🧠 How it works:
The strategy identifies pullbacks using a simple moving average (MA).
When price dips below the MA, it begins monitoring for the first green candle (close > open).
That green candle signals a potential bottom, so it adds to the position.
If price goes lower, it waits for the next green candle and adds again.
The exit happens after ATH — it sells on each red candle (close < open) once a new ATH is reached.
You can adjust:
MA length (defines what’s considered a pullback)
Initial buy % (how much to pre-fill before signals start)
Buy % per signal (after pullback green candle)
Exit % per red candle after ATH
📊 Intended assets & timeframes:
This strategy is designed for broad market indices and long-term appreciating assets, such as:
SPY, NASDAQ, DAX, FTSE
Use it only on 1D or higher timeframes — it’s not meant for scalping or short-term trading.
⚠️ Important Limitations:
Long-only: The script does not short. It assumes the asset will eventually recover to a new ATH.
Not for all assets: It won't work on assets that may never recover (e.g., single stocks or speculative tokens).
Slow capital deployment: Entries happen gradually and may take a long time to close.
Not optimized for returns: Buy & hold can outperform this strategy.
No slippage, fees, or funding costs included.
This is not a performance strategy. It’s a teaching tool to show that:
High win rate ≠ high profitability
Patience can be deceiving
Many signals = long capital lock-in
🎓 Why it exists:
The purpose of this strategy is to demonstrate market psychology and risk overconfidence. Traders often chase strategies with high win rates without considering holding time, drawdowns, or opportunity cost.
This script helps visualize that phenomenon.

Turtle Trading Strategy (Simplified)This TradingView script is a powerful implementation of the classic Turtle Trading strategy, designed to help traders capitalize on significant market trends. Built using Pine Script, it can function as an indicator to highlight the specific entry and exit signals derived from the Turtle rules, or as a fully automated strategy to execute trades based on these signals. Users can fine-tune critical parameters like the lookback periods for breakouts and exits, enabling them to adapt the strategy to different market conditions and asset classes. The script leverages Pine Script's robust capabilities to accurately calculate and display the Turtle System's core logic, including position sizing based on volatility (ATR), providing a clear and systematic approach to trend-following directly on their TradingView charts.

JAN - OCT [old] Engulfing Pattern Strategyold engulfing that is bad and shouldnt be used and if you do use it, then proceed at your own pearl. and i have to keep making this description longer other it wont publish which is annoying so this is just words to make the description longer so i can publish

Tuga SupertrendDescription
This strategy uses the Supertrend indicator enhanced with commission and slippage filters to capture trends on the daily chart. It’s designed to work on any asset but is especially effective in markets with consistent movements.
Use the date inputs to set the backtest period (default: from January 1, 2018, through today, June 30, 2025).
The default input values are optimized for the daily chart. For other timeframes, adjust the parameters to suit the asset you’re testing.
Release Notes
June 30, 2025
• Updated default backtest period to end on June 30, 2025.
• Default commission adjusted to 0.1 %.
• Slippage set to 3 ticks.
• Default slippage set to 3 ticks.
• Simplified the strategy name to “Tuga Supertrend”.
Default Parameters
Parameter Default Value
Supertrend Period 10
Multiplier (Factor) 3
Commission 0.1 %
Slippage 3 ticks
Start Date January 1, 2018
End Date June 30, 2025

✅ 200 EMA + RSI Pullback + Volume Surge (Full Strategy)200 EMA Trend + RSI Pullback + Volume Surge Strategy (Advanced)
📖 Strategy Description:
This strategy is designed to identify high-probability entries in trending markets using a combination of trend-following and momentum re-entry principles. It works effectively for intraday and swing trading on equities, indices, and crypto.
🔍 Entry Logic:
✅ Long Entry Conditions:
Trend Confirmation:
Price must be above the 200 EMA, indicating a bullish trend.
RSI Pullback:
RSI must drop below a defined level (default 40), indicating a healthy pullback in an uptrend.
Volume Surge:
Current volume must be above 1.5× the 20-period average, confirming strong buying activity.
Entry Triggered on Candle Close:
Ensures reliable confirmation instead of premature entries.
Short Entry Conditions (reverse logic):
Price below the 200 EMA
RSI above threshold (default 60)
Volume surge
Entry only after candle close
Exit Conditions:
Take Profit (TP):
Book profits at 2% move (configurable).
Stop Loss (SL):
Protect capital at 1% loss (configurable).
Trailing Stop Loss (TSL):
Follows the price with a 1.5% trail to lock in profits.
Time-Based Exit:
Closes position automatically after a fixed number of candles (default: 5 bars).
Alerts:
Built-in alerts notify when a Long or Short setup is triggered, allowing traders to act or automate execution.
Best Used On:
Timeframes: 15-minute, 1-hour, or Daily
Markets: NIFTY, BANKNIFTY, RELIANCE, INFY, BTC/USD, ETH/USD
Styles: Intraday, Swing, Trend-followinG
Ideal For:
Traders who follow pullback entries in strong trends
Users looking for automated alerts and exits
Strategies requiring volume confirmation + trend bias

Ticker Pulse Meter + Fear EKG StrategyDescription
The Ticker Pulse Meter + Fear EKG Strategy is a technical analysis tool designed to identify potential entry and exit points for long positions based on price action relative to historical ranges. It combines two proprietary indicators: the Ticker Pulse Meter (TPM), which measures price positioning within short- and long-term ranges, and the Fear EKG, a VIX-inspired oscillator that detects extreme market conditions. The strategy is non-repainting, ensuring signals are generated only on confirmed bars to avoid false positives. Visual enhancements, such as optional moving averages and Bollinger Bands, provide additional context but are not core to the strategy's logic. This script is suitable for traders seeking a systematic approach to capturing momentum and mean-reversion opportunities.
How It Works
The strategy evaluates price action using two key metrics:
Ticker Pulse Meter (TPM): Measures the current price's position within short- and long-term price ranges to identify momentum or overextension.
Fear EKG: Detects extreme selling pressure (akin to "irrational selling") by analyzing price behavior relative to historical lows, inspired by volatility-based oscillators.
Entry signals are generated when specific conditions align, indicating potential buying opportunities. Exits are triggered based on predefined thresholds or partial position closures to manage risk. The strategy supports customizable lookback periods, thresholds, and exit percentages, allowing flexibility across different markets and timeframes. Visual cues, such as entry/exit dots and a position table, enhance usability, while optional overlays like moving averages and Bollinger Bands provide additional chart context.
Calculation Overview
Price Range Calculations:
Short-Term Range: Uses the lowest low (min_price_short) and highest high (max_price_short) over a user-defined short lookback period (lookback_short, default 50 bars).
Long-Term Range: Uses the lowest low (min_price_long) and highest high (max_price_long) over a user-defined long lookback period (lookback_long, default 200 bars).
Percentage Metrics:
pct_above_short: Percentage of the current close above the short-term range.
pct_above_long: Percentage of the current close above the long-term range.
Combined metrics (pct_above_long_above_short, pct_below_long_below_short) normalize price action for signal generation.
Signal Generation:
Long Entry (TPM): Triggered when pct_above_long_above_short crosses above a user-defined threshold (entryThresholdhigh, default 20) and pct_below_long_below_short is below a low threshold (entryThresholdlow, default 40).
Long Entry (Fear EKG): Triggered when pct_below_long_below_short crosses under an extreme threshold (orangeEntryThreshold, default 95), indicating potential oversold conditions.
Long Exit: Triggered when pct_above_long_above_short crosses under a profit-taking level (profitTake, default 95). Partial exits are supported via a user-defined percentage (exitAmt, default 50%).
Non-Repainting Logic: Signals are calculated using data from the previous bar ( ) and only plotted on confirmed bars (barstate.isconfirmed), ensuring reliability.
Visual Enhancements:
Optional moving averages (SMA, EMA, WMA, VWMA, or SMMA) and Bollinger Bands can be enabled for trend context.
A position table displays real-time metrics, including open positions, Fear EKG, and Ticker Pulse values.
Background highlights mark periods of high selling pressure.
Entry Rules
Long Entry:
TPM Signal: Occurs when the price shows strength relative to both short- and long-term ranges, as defined by pct_above_long_above_short crossing above entryThresholdhigh and pct_below_long_below_short below entryThresholdlow.
Fear EKG Signal: Triggered by extreme selling pressure, when pct_below_long_below_short crosses under orangeEntryThreshold. This signal is optional and can be toggled via enable_yellow_signals.
Entries are executed only on confirmed bars to prevent repainting.
Exit Rules
Long Exit: Triggered when pct_above_long_above_short crosses under profitTake.
Partial exits are supported, with the strategy closing a user-defined percentage of the position (exitAmt) up to four times per position (exit_count limit).
Exits can be disabled or adjusted via enable_short_signal and exitPercentage settings.
Inputs
Backtest Start Date: Defines the start of the backtesting period (default: Jan 1, 2017).
Lookback Periods: Short (lookback_short, default 50) and long (lookback_long, default 200) periods for range calculations.
Resolution: Timeframe for price data (default: Daily).
Entry/Exit Thresholds:
entryThresholdhigh (default 20): Threshold for TPM entry.
entryThresholdlow (default 40): Secondary condition for TPM entry.
orangeEntryThreshold (default 95): Threshold for Fear EKG entry.
profitTake (default 95): Exit threshold.
exitAmt (default 50%): Percentage of position to exit.
Visual Options: Toggle for moving averages and Bollinger Bands, with customizable types and lengths.
Notes
The strategy is designed to work across various timeframes and assets, with data sourced from user-selected resolutions (i_res).
Alerts are included for long entry and exit signals, facilitating integration with TradingView's alert system.
The script avoids repainting by using confirmed bar data and shifted calculations ( ).
Visual elements (e.g., SMA, Bollinger Bands) are inspired by standard Pine Script practices and are optional, not integral to the core logic.
Usage
Apply the script to a chart, adjust input settings to suit your trading style, and use the visual cues (entry/exit dots, position table) to monitor signals. Enable alerts for real-time notifications.
Designed to work best on Daily timeframe.

S4_IBS_Mean_Rev_3candleExitOverview:
This is a rules-based, mean reversion strategy designed to trade pullbacks using the Internal Bar Strength (IBS) indicator. The system looks for oversold conditions based on IBS, then enters long trades , holding for a maximum of 3 bars or until the trade becomes profitable.
The strategy includes:
✅ Strict entry rules based on IBS
✅ Hardcoded exit conditions for risk management
✅ A clean visual table summarizing key performance metrics
How It Works:
1. Internal Bar Strength (IBS) Setup:
The IBS is calculated using the previous bar’s price range:
IBS = (Previous Close - Previous Low) / (Previous High - Previous Low)
IBS values closer to 0 indicate price is near the bottom of the previous range, suggesting oversold conditions.
2. Entry Conditions:
IBS must be ≤ 0.25, signaling an oversold setup.
Trade entries are only allowed within a user-defined backtest window (default: 2024).
Only one trade at a time is permitted (long-only strategy).
3. Exit Conditions:
If the price closes higher than the entry price, the trade exits with a profit.
If the trade has been open for 3 bars without showing profit, the trade is forcefully exited.
All trades are closed automatically at the end of the backtest window if still open.
Additional Features:
📊 A real-time performance metrics table is displayed on the chart, showing:
- Total trades
- % of profitable trades
- Total P&L
- Profit Factor
- Max Drawdown
- Best/Worst trade performance
📈 Visual markers indicate trade entries (green triangle) and exits (red triangle) for easy chart interpretation.
Who Is This For?
This strategy is designed for:
✅ Traders exploring systematic mean reversion approaches
✅ Those who prefer strict, rules-based setups with no subjective decision-making
✅ Traders who want built-in performance tracking directly on the chart
Note: This strategy is provided for educational and research purposes. It is a backtested model and past performance does not guarantee future results. Users should paper trade and validate performance before considering real capital.

Random State Machine Strategy📌 Random State Machine Strategy (Educational)
This strategy showcases a randomized entry model driven by a finite state machine, integrated with user-defined exit controls and a full-featured moving average filter.
🧠 Trade Entry Logic
Entries occur only when:
A random trigger occurs (~5% probability per bar)
The state machine accepts a new transition (sm.step())
Price is:
Above the selected MA for long entries
Below the selected MA for short entries
This ensures that entries are both stochastically driven and trend-aligned, avoiding frequent or arbitrary trades.
⚙️ How It Works
Randomized Triggers
A pseudo-random generator (seeded with time and volume) attempts to trigger state transitions.
Finite State Machine
Transitions are managed using the StateMachine from robbatt/lib_statemachine — credit to @robbatt for the modular FSM design.
Controlled Reset
The state machine resets every N bars (default: 100) if at least two transitions have occurred. This prevents stale or locked states.
Backtest Range
Define a specific test window using Start and End Date inputs.
Risk & Exits
Specify risk in points and a target risk/reward ratio. TP is auto-computed. Timed and MA-based exits can be toggled.
🧪 How to Use
Enable Long or Short trades
Choose your Moving Average type and length
Set Risk per trade and R/R ratio
Toggle TP/SL, timed exit, or MA cross exit
Adjust the State Reset Interval to suit your signal frequency
📘 Notes
Educational use only — not financial advice
Random logic is used to model structure, not predict movement
Thanks to @robbatt for the lib_statemachine integration

Multi-Indicator Trend-Following Strategy v6Multi-Indicator Trend-Following Strategy v6
This strategy uses a combination of technical indicators to identify potential trend-following trade entries and exits. It is intended for educational and research purposes.
How it works:
Moving Averages (EMA): Entry signals are generated on crossovers between a fast and slow exponential moving average.
RSI Filter: Confirms momentum with a threshold above/below 50 for long/short entries.
Volume Confirmation: Requires volume to exceed a moving average multiplied by a user-defined factor.
ATR-Based Risk Management: Stop loss and take profit levels are calculated using the Average True Range (ATR), allowing for dynamic risk control based on market volatility.
Customizable Inputs:
Fast/Slow MA lengths
RSI length and levels
MACD settings (used in calculation, not directly in signal)
Volume MA and multiplier
ATR period and multipliers for stop loss and take profit
Notes:
This strategy does not guarantee future results.
It is provided for analysis and backtesting only.
Alerts are available for buy/sell conditions.
Feel free to adjust parameters to explore different market conditions and asset classes.

magic wand STSM"Magic Wand STSM" Strategy: Trend-Following with Dynamic Risk Management
Overview:
The "Magic Wand STSM" (Supertrend & SMA Momentum) is an automated trading strategy designed to identify and capitalize on sustained trends in the market. It combines a multi-timeframe Supertrend for trend direction and potential reversal signals, along with a 200-period Simple Moving Average (SMA) for overall market bias. A key feature of this strategy is its dynamic position sizing based on a user-defined risk percentage per trade, and a built-in daily and monthly profit/loss tracking system to manage overall exposure and prevent overtrading.
How it Works (Underlying Concepts):
Multi-Timeframe Trend Confirmation (Supertrend):
The strategy uses two Supertrend indicators: one on the current chart timeframe and another on a higher timeframe (e.g., if your chart is 5-minute, the higher timeframe Supertrend might be 15-minute).
Trend Identification: The Supertrend's direction output is crucial. A negative direction indicates a bearish trend (price below Supertrend), while a positive direction indicates a bullish trend (price above Supertrend).
Confirmation: A core principle is that trades are only considered when the Supertrend on both the current and the higher timeframe align in the same direction. This helps to filter out noise and focus on stronger, more confirmed trends. For example, for a long trade, both Supertrends must be indicating a bearish trend (price below Supertrend line, implying an uptrend context where price is expected to stay above/rebound from Supertrend). Similarly, for short trades, both must be indicating a bullish trend (price above Supertrend line, implying a downtrend context where price is expected to stay below/retest Supertrend).
Trend "Readiness": The strategy specifically looks for situations where the Supertrend has been stable for a few bars (checking barssince the last direction change).
Long-Term Market Bias (200 SMA):
A 200-period Simple Moving Average is plotted on the chart.
Filter: For long trades, the price must be above the 200 SMA, confirming an overall bullish bias. For short trades, the price must be below the 200 SMA, confirming an overall bearish bias. This acts as a macro filter, ensuring trades are taken in alignment with the broader market direction.
"Lowest/Highest Value" Pullback Entries:
The strategy employs custom functions (LowestValueAndBar, HighestValueAndBar) to identify specific price action within the recent trend:
For Long Entries: It looks for a "buy ready" condition where the price has found a recent lowest point within a specific number of bars since the Supertrend turned bearish (indicating an uptrend). This suggests a potential pullback or consolidation before continuation. The entry trigger is a close above the open of this identified lowest bar, and also above the current bar's open.
For Short Entries: It looks for a "sell ready" condition where the price has found a recent highest point within a specific number of bars since the Supertrend turned bullish (indicating a downtrend). This suggests a potential rally or consolidation before continuation downwards. The entry trigger is a close below the open of this identified highest bar, and also below the current bar's open.
Candle Confirmation: The strategy also incorporates a check on the candle type at the "lowest/highest value" bar (e.g., closevalue_b < openvalue_b for buy signals, meaning a bearish candle at the low, suggesting a potential reversal before a buy).
Risk Management and Position Sizing:
Dynamic Lot Sizing: The lotsvalue function calculates the appropriate position size based on your Your Equity input, the Risk to Reward ratio, and your risk percentage for your balance % input. This ensures that the capital risked per trade remains consistent as a percentage of your equity, regardless of the instrument's volatility or price. The stop loss distance is directly used in this calculation.
Fixed Risk Reward: All trades are entered with a predefined Risk to Reward ratio (default 2.0). This means for every unit of risk (stop loss distance), the target profit is rr times that distance.
Daily and Monthly Performance Monitoring:
The strategy tracks todaysWins, todaysLosses, and res (daily net result) in real-time.
A "daily profit target" is implemented (day_profit): If the daily net result is very favorable (e.g., res >= 4 with todaysLosses >= 2 or todaysWins + todaysLosses >= 8), the strategy may temporarily halt trading for the remainder of the session to "lock in" profits and prevent overtrading during volatile periods.
A "monthly stop-out" (monthly_trade) is implemented: If the lres (overall net result from all closed trades) falls below a certain threshold (e.g., -12), the strategy will stop trading for a set period (one week in this case) to protect capital during prolonged drawdowns.
Trade Execution:
Entry Triggers: Trades are entered when all buy/sell conditions (Supertrend alignment, SMA filter, "buy/sell situation" candle confirmation, and risk management checks) are met, and there are no open positions.
Stop Loss and Take Profit:
Stop Loss: The stop loss is dynamically placed at the upTrendValue for long trades and downTrendValue for short trades. These values are derived from the Supertrend indicator, which naturally adjusts to market volatility.
Take Profit: The take profit is calculated based on the entry price, the stop loss, and the Risk to Reward ratio (rr).
Position Locks: lock_long and lock_short variables prevent immediate re-entry into the same direction once a trade is initiated, or after a trend reversal based on Supertrend changes.
Visual Elements:
The 200 SMA is plotted in yellow.
Entry, Stop Loss, and Take Profit lines are plotted in white, red, and green respectively when a trade is active, with shaded areas between them to visually represent risk and reward.
Diamond shapes are plotted at the bottom of the chart (green for potential buy signals, red for potential sell signals) to visually indicate when the buy_sit or sell_sit conditions are met, along with other key filters.
A comprehensive trade statistics table is displayed on the chart, showing daily wins/losses, daily profit, total deals, and overall profit/loss.
A background color indicates the active trading session.
Ideal Usage:
This strategy is best applied to instruments with clear trends and sufficient liquidity. Users should carefully adjust the Your Equity, Risk to Reward, and risk percentage inputs to align with their individual risk tolerance and capital. Experimentation with different ATR Length and Factor values for the Supertrend might be beneficial depending on the asset and timeframe.

Hybrid: RSI + Breakout + DashboardHybrid RSI + Breakout Strategy
Adaptive trading system that switches modes based on market regime:
Ranging: Buys when RSI < 30 and sells when RSI > 70.
Trending: Enters momentum breakouts only in the direction of the 200-EMA bias, with ADX confirming trend strength.
Risk Management: Trailing stop locks profits and caps drawdown.
Optimized for BTC, ETH, and SOL on 1 h–1 D charts; back-tested from 2017 onward. Educational use only—run your own tests before deploying live funds.

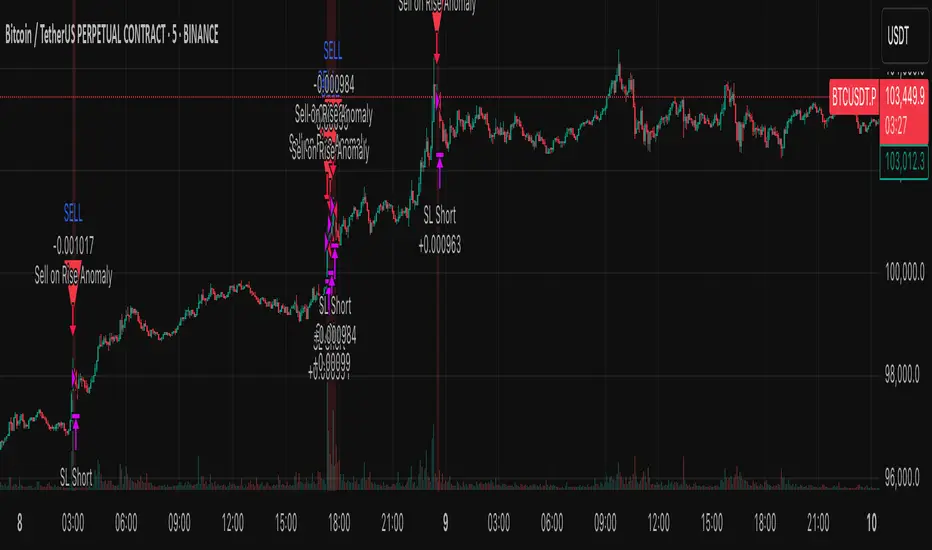
Anomaly Counter-Trend StrategyA mean-reversion style strategy that automatically spots unusually large price moves over a configurable lookback period and takes the opposite side, with full risk-management, commission and slippage modeling—built in Pine Script® v6.
🔎 Overview
ACTS monitors the percent-change over the past N minutes and, when that move exceeds your chosen threshold, enters a counter-trend position (short on a strong rise; long on a sharp fall). It’s ideal for markets that often “overshoot” and snap back, and can be applied on any symbol or timeframe.
⚙️ Key Features
Anomaly Detection: Detect abnormal price swings based on a user-defined % change over a lookback period.
Counter-Trend Entries: Auto-enter short on rise anomalies, long on fall anomalies (with seamless flat↔reverse transitions).
Risk Management: Configurable stop-loss and take-profit in ticks per trade.
Realistic Modeling: Simulates commissions (0.05 % default), slippage (2 ticks), and percent-of-equity sizing.
Immediate Bar-Close Execution: Orders processed on bar close for faster fills.
Visual Aids: Optional on-chart BUY/SELL triangles and background highlights during anomaly periods.
⚙️ Inputs
Input Default Description
Percentage Threshold (%) 2.00 Min % move over lookback to trigger an anomaly.
Lookback Period (Minutes) 15 Number of minutes over which to measure change.
Stop Loss (Ticks) 100 Distance from entry for stop-loss exit.
Take Profit (Ticks) 200 Distance from entry for take-profit exit.
Plot Trade Signal Shapes (on/off) true Show BUY/SELL triangles on chart.
Highlight Anomaly Background true Shade background during anomaly bars.
📊 How to Use
Add to Chart: Apply the script to any ticker & timeframe.
Tune: Adjust your percentage threshold and lookback to match each instrument’s volatility.
Review Backtest: Check built-in strategy performance (drawdown, Sharpe, etc.) under the Strategy Tester tab.
Go Live: Once optimized, link to alerts or your trade execution system.
⚠️ Disclaimer
This script is provided “as-is” for educational purposes and backtesting only. Past performance does not guarantee future results. Always backtest thoroughly, manage your own risk, and consider market conditions before live trading.
Enjoy experimenting—and may your counter-trend entries catch the next big snapback!
Timeframe StrategyThis is a multi-timeframe trading strategy inspired by Ross Cameron's style, optimized for scalping and trend-following across various timeframes (1m, 5m, 15m, 1h, and 1D). The strategy integrates a comprehensive set of technical indicators, dynamic risk management, and visual tools.
Core Features
Dynamic Take Profit, Stop Loss & Trailing Stop
> Separate settings per timeframe for:
-TP% (Take Profit)
-SL% (Stop Loss)
-Trailing Stop %
-Cooldown bars
> Configurable via UI inputs.
>Smart Entry Conditions
Bullish entry: EMA9 crossover EMA20 and EMA50 > EMA200
Bearish entry: EMA9 crossunder EMA20 and EMA50 < EMA200
>Additional confirmation filters:
-Volume Filter (enabled/disabled via UI)
-Time Filter (e.g., only between 15:00–20:00 UTC)
-Spike Filter: rejects high-volatility candles
-RSI Filter: above/below 50 for trend confirmation
-ADX Filter (only applied on 1m, e.g., ADX > 15)
-Micro-Volatility Filter: minimum range percentage (1m only)
-Trend Filter (1m only): price must be above/below EMA200
>Trailing Stop Logic
-Configurable for each timeframe.
- Optional via toggle (use_trailing).
>Trade Cooldown Logic
-Prevents consecutive trades within X bars, configurable per timeframe.
>Technical Indicators Used
-EMA 9 / 20 / 50 / 200
-VWAP
-RSI (14)
-ATR (14) for volatility-based spike filtering
-Custom-calculated ADX (14) (manually implemented)
>Visual Elements
🔼/🔽 Entry signals (long/short) plotted on the chart.
📉 Table in bottom-left:
Displays current values of EMA/VWAP/volume/ATR/ADX.
> Optional "Tab info" panel in top-right (toggleable):
-Timeframe & strategy settings
-Live status of filters (volume, time, cooldown, spike, RSI, ADX, range, trend)
-Uses emoji (✅ / ❌) for quick diagnostics.
>User Customization
-Inputs per timeframe for all key parameters.
-Toggle switches for:
-Trailing stop
-Volume filter
-Info table visibility
This strategy is designed for active traders seeking a balance between momentum entry, risk control, and adaptability across timeframes. It's ideal for backtesting quick reversals or breakout setups in fast markets, especially at lower timeframes like 1m or 5m.

External Signals Strategy Tester v5External Signals Strategy Tester v5 – User Guide (English)
1. Purpose
This Pine Script strategy is a universal back‑tester that lets you plug in any external buy/sell series (for example, another indicator, webhook feed, or higher‑time‑frame condition) and evaluate a rich set of money‑management rules around it – with a single click on/off workflow for every module.
2. Core Workflow
Feed signals
Buy Signal / Sell Signal inputs accept any series (price, boolean, output of request.security(), etc.).
A crossover above 0 is treated as “signal fired”.
Date filter
Start Date / End Date restricts the test window so you can exclude unwanted history.
Trade engine
Optional Long / Short enable toggles.
Choose whether opposite signals simply close the trade or reverse it (flip direction in one transaction).
Risk modules – all opt‑in via check‑boxes
Classic % block – fixed % Take‑Profit / Stop‑Loss / Break‑Even.
Fibonacci Bollinger Bands (FBB) module
Draws dynamic VWMA/HMA/SMA/EMA/DEMA/TEMA mid‑line with ATR‑scaled Fibonacci envelopes.
Every line can be used for stops, trailing, or multi‑target exits.
Separate LONG and SHORT sub‑modules
Each has its own SL plus three Take‑Profits (TP1‑TP3).
Per TP you set line, position‑percentage to close, and an optional trailing flag.
Executed TP/SLs deactivate themselves so they cannot refire.
Trailing behaviour
If Trail is checked, the selected line is re‑evaluated once per bar; the order is amended via strategy.exit().
3. Inputs Overview
Group Parameter Notes
Trade Settings Enable Long / Enable Short Master switches
Close on Opposite / Reverse Position How to react to a counter‑signal
Risk % Use TP / SL / BE + their % Traditional fixed‑distance management
Fibo Bands FIBO LEVELS ENABLE + visual style/length Turn indicator overlay on/off
FBB LONG SL / TP1‑TP3 Enable, Line, %, Trail Rules applied only while a long is open
FBB SHORT SL / TP1‑TP3 Enable, Line, %, Trail Rules applied only while a short is open
Line choices: Basis, 0.236, 0.382, 0.5, 0.618, 0.764, 1.0 – long rules use lower bands, short rules use upper bands automatically.
4. Algorithm Details
Position open
On the very first bar after entry, the script checks the direction and activates the corresponding LONG or SHORT module, deactivating the other.
Order management loop (every bar)
FBB Stop‑Loss: placed/updated at chosen band; if trailing, follows the new value.
TP1‑TP3: each active target updates its limit price to the selected band (or holds static if trailing is off).
The classic % block runs in parallel; its exits have priority because they call strategy.close_all().
Exit handling
When any strategy.exit() fires, the script reads exit_id and flips the *_Active flag so that order will not be recreated.
A Stop‑Loss (SL) also disables all remaining TPs for that leg.
5. Typical Use Cases
Scenario Suggested Setup
Scalping longs into VWAP‐reversion Enable LONG TP1 @ 0.382 (30 %), TP2 @ 0.618 (40 %), SL @ 0.236 + trailing
Fade shorts during news spikes Enable SHORT SL @ 1.0 (no trail) and SHORT TP1,2,3 on consecutive lowers with small size‑outs
Classic trend‑follow Use only classic % TP/SL block and disable FBB modules
6. Hints & Tips
Signal quality matters – this script manages exits, it does not generate entries.
Keep TV time zone in mind when picking start/end dates.
For portfolio‑style testing allocate smaller default_qty_value than 100 % or use strategy.percent_of_equity sizing.
You can combine FBB exits with fixed‑% ones for layered management.
7. Limitations / Safety
No pyramiding; the script holds max one position at a time.
All calculations are bar‑close; intra‑bar touches may differ from real‑time execution.
The indicator overlay is optional, so you can run visual‑clean tests by unchecking FIBO LEVELS ENABLE.

Sharpe Ratio Forced Selling StrategyThis study introduces the “Sharpe Ratio Forced Selling Strategy”, a quantitative trading model that dynamically manages positions based on the rolling Sharpe Ratio of an asset’s excess returns relative to the risk-free rate. The Sharpe Ratio, first introduced by Sharpe (1966), remains a cornerstone in risk-adjusted performance measurement, capturing the trade-off between return and volatility. In this strategy, entries are triggered when the Sharpe Ratio falls below a specified low threshold (indicating excessive pessimism), and exits occur either when the Sharpe Ratio surpasses a high threshold (indicating optimism or mean reversion) or when a maximum holding period is reached.
The underlying economic intuition stems from institutional behavior. Institutional investors, such as pension funds and mutual funds, are often subject to risk management mandates and performance benchmarking, requiring them to reduce exposure to assets that exhibit deteriorating risk-adjusted returns over rolling periods (Greenwood and Scharfstein, 2013). When risk-adjusted performance improves, institutions may rebalance or liquidate positions to meet regulatory requirements or internal mandates, a behavior that can be proxied effectively through a rising Sharpe Ratio.
By systematically monitoring the Sharpe Ratio, the strategy anticipates when “forced selling” pressure is likely to abate, allowing for opportunistic entries into assets priced below fundamental value. Exits are equally mechanized, either triggered by Sharpe Ratio improvements or by a strict time-based constraint, acknowledging that institutional rebalancing and window-dressing activities are often time-bound (Coval and Stafford, 2007).
The Sharpe Ratio is particularly suitable for this framework due to its ability to standardize excess returns per unit of risk, ensuring comparability across timeframes and asset classes (Sharpe, 1994). Furthermore, adjusting returns by a dynamically updating short-term risk-free rate (e.g., US 3-Month T-Bills from FRED) ensures that macroeconomic conditions, such as shifting interest rates, are accurately incorporated into the risk assessment.
While the Sharpe Ratio is an efficient and widely recognized measure, the strategy could be enhanced by incorporating alternative or complementary risk metrics:
• Sortino Ratio: Unlike the Sharpe Ratio, the Sortino Ratio penalizes only downside volatility (Sortino and van der Meer, 1991). This would refine entries and exits to distinguish between “good” and “bad” volatility.
• Maximum Drawdown Constraints: Integrating a moving window maximum drawdown filter could prevent entries during persistent downtrends not captured by volatility alone.
• Conditional Value at Risk (CVaR): A measure of expected shortfall beyond the Value at Risk, CVaR could further constrain entry conditions by accounting for tail risk in extreme environments (Rockafellar and Uryasev, 2000).
• Dynamic Thresholds: Instead of static Sharpe thresholds, one could implement dynamic bands based on the historical distribution of the Sharpe Ratio, adjusting for volatility clustering effects (Cont, 2001).
Each of these risk parameters could be incorporated into the current script as additional input controls, further tailoring the model to different market regimes or investor risk appetites.
References
• Cont, R. (2001) ‘Empirical properties of asset returns: stylized facts and statistical issues’, Quantitative Finance, 1(2), pp. 223-236.
• Coval, J.D. and Stafford, E. (2007) ‘Asset Fire Sales (and Purchases) in Equity Markets’, Journal of Financial Economics, 86(2), pp. 479-512.
• Greenwood, R. and Scharfstein, D. (2013) ‘The Growth of Finance’, Journal of Economic Perspectives, 27(2), pp. 3-28.
• Rockafellar, R.T. and Uryasev, S. (2000) ‘Optimization of Conditional Value-at-Risk’, Journal of Risk, 2(3), pp. 21-41.
• Sharpe, W.F. (1966) ‘Mutual Fund Performance’, Journal of Business, 39(1), pp. 119-138.
• Sharpe, W.F. (1994) ‘The Sharpe Ratio’, Journal of Portfolio Management, 21(1), pp. 49-58.
• Sortino, F.A. and van der Meer, R. (1991) ‘Downside Risk’, Journal of Portfolio Management, 17(4), pp. 27-31.

Gold ORB Strategy (15-min Range, 5-min Entry)The Gold ORB (Opening Range Breakout) Strategy is designed for day traders looking to capitalize on the price action in the early part of the trading day, specifically using a 15-minute range for identifying the opening range and a 5-minute timeframe for breakout entries. The strategy trades the Gold market (XAU/USD) during the New York session.
Opening Range: The strategy defines the Opening Range (ORB) between 9:30 AM EST and 9:45 AM EST using the highest and lowest points during this 15-minute window.
Breakout Entries: The strategy enters trades when the price breaks above the ORB high for a long position or below the ORB low for a short position. It waits for a 5-minute candle close outside the range before entering a trade.
Stop Loss and Take Profit: The stop loss is placed at 50% of the ORB range, and the take profit is set at twice the ORB range (1:2 risk-reward ratio).
Time Window: The strategy only executes trades before 12:00 PM EST, avoiding late-day market fluctuations and consolidations.

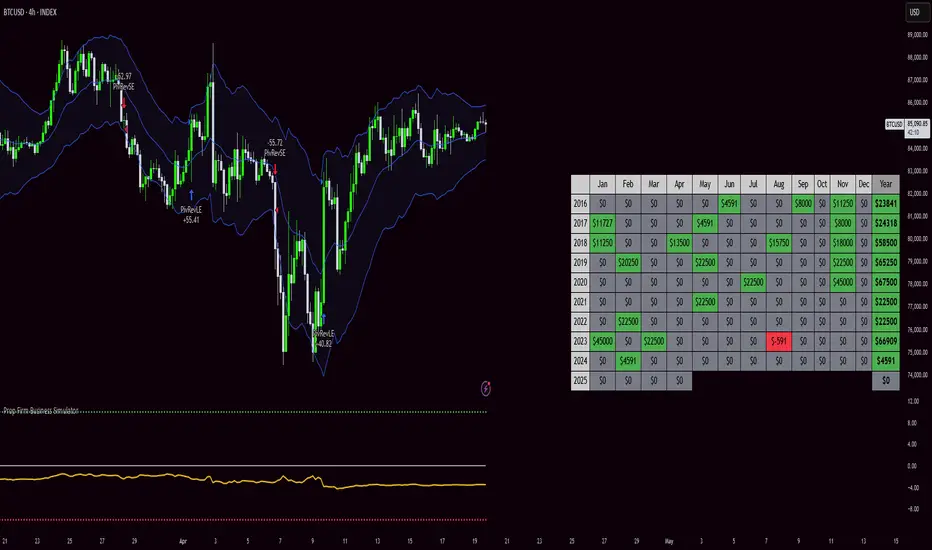
Prop Firm Business SimulatorThe prop firm business simulator is exactly what it sounds like. It's a plug and play tool to test out any tradingview strategy and simulate hypothetical performance on CFD Prop Firms.
Now what is a modern day CFD Prop Firm?
These companies sell simulated trading challenges for a challenge fee. If you complete the challenge you get access to simulated capital and you get a portion of the profits you make on those accounts payed out.
I've included some popular firms in the code as presets so it's easy to simulate them. Take into account that this info will likely be out of date soon as these prices and challenge conditions change.
Also, this tool will never be able to 100% simulate prop firm conditions and all their rules. All I aim to do with this tool is provide estimations.
Now why is this tool helpful?
Most traders on here want to turn their passion into their full-time career, prop firms have lately been the buzz in the trading community and market themselves as a faster way to reach that goal.
While this all sounds great on paper, it is sometimes hard to estimate how much money you will have to burn on challenge fees and set realistic monthly payout expectations for yourself and your trading. This is where this tool comes in.
I've specifically developed this for traders that want to treat prop firms as a business. And as a business you want to know your monthly costs and income depending on the trading strategy and prop firm challenge you are using.
How to use this tool
It's quite simple you remove the top part of the script and replace it with your own strategy. Make sure it's written in same version of pinescript before you do that.
//--$$$$$$$$$$$$$$$$$$$$$$$$$$$$$$$$$$$$$$$$$$$$$$$$--//--------------------------------------------------------------------------------------------------------------------------$$$$$$
//--$$$$$--Strategy-- --$$$$$$--// ******************************************************************************************************************************
//--$$$$$$$$$$$$$$$$$$$$$$$$$$$$$$$$$$$$$$$$$$$$$$$$--//--------------------------------------------------------------------------------------------------------------------------$$$$$$
length = input.int(20, minval=1, group="Keltner Channel Breakout")
mult = input(2.0, "Multiplier", group="Keltner Channel Breakout")
src = input(close, title="Source", group="Keltner Channel Breakout")
exp = input(true, "Use Exponential MA", display = display.data_window, group="Keltner Channel Breakout")
BandsStyle = input.string("Average True Range", options = , title="Bands Style", display = display.data_window, group="Keltner Channel Breakout")
atrlength = input(10, "ATR Length", display = display.data_window, group="Keltner Channel Breakout")
esma(source, length)=>
s = ta.sma(source, length)
e = ta.ema(source, length)
exp ? e : s
ma = esma(src, length)
rangema = BandsStyle == "True Range" ? ta.tr(true) : BandsStyle == "Average True Range" ? ta.atr(atrlength) : ta.rma(high - low, length)
upper = ma + rangema * mult
lower = ma - rangema * mult
//--Graphical Display--// *-*-*-*-*-*-*-*-*-*-*-*-*-*-*-*-*-*-*-*-*-*-*-*-*-*-*-*-*-*-*-*-*-*-*-*-*-*-*-*-*-*-*-*-*-*-*-*-*-*-*-*-*-*-*-*-*-*-*-*-*-*-*-*-*-*-*-*-*-*-*-*-*-$$$$$$
u = plot(upper, color=#2962FF, title="Upper", force_overlay=true)
plot(ma, color=#2962FF, title="Basis", force_overlay=true)
l = plot(lower, color=#2962FF, title="Lower", force_overlay=true)
fill(u, l, color=color.rgb(33, 150, 243, 95), title="Background")
//--Risk Management--// *-*-*-*-*-*-*-*-*-*-*-*-*-*-*-*-*-*-*-*-*-*-*-*-*-*-*-*-*-*-*-*-*-*-*-*-*-*-*-*-*-*-*-*-*-*-*-*-*-*-*-*-*-*-*-*-*-*-*-*-*-*-*-*-*-*-*-*-*-*-*-*-*-*-$$$$$$
riskPerTradePerc = input.float(1, title="Risk per trade (%)", group="Keltner Channel Breakout")
le = high>upper ? false : true
se = lowlower
strategy.entry('PivRevLE', strategy.long, comment = 'PivRevLE', stop = upper, qty=riskToLots)
if se and upper>lower
strategy.entry('PivRevSE', strategy.short, comment = 'PivRevSE', stop = lower, qty=riskToLots)
The tool will then use the strategy equity of your own strategy and use this to simulat prop firms. Since these CFD prop firms work with different phases and payouts the indicator will simulate the gains until target or max drawdown / daily drawdown limit gets reached. If it reaches target it will go to the next phase and keep on doing that until it fails a challenge.
If in one of the phases there is a reward for completing, like a payout, refund, extra it will add this to the gains.
If you fail the challenge by reaching max drawdown or daily drawdown limit it will substract the challenge fee from the gains.
These gains are then visualised in the calendar so you can get an idea of yearly / monthly gains of the backtest. Remember, it is just a backtest so no guarantees of future income.
The bottom pane (non-overlay) is visualising the performance of the backtest during the phases. This way u can check if it is realistic. For instance if it only takes 1 bar on chart to reach target you are probably risking more than the firm wants you to risk. Also, it becomes much less clear if daily drawdown got hit in those high risk strategies, the results will be less accurate.
The daily drawdown limit get's reset every time there is a new dayofweek on chart.
If you set your prop firm preset setting to "'custom" the settings below that are applied as your prop firm settings. Otherwise it will use one of the template by default it's FTMO 100K.
The strategy I'm using as an example in this script is a simple Keltner Channel breakout strategy. I'm using a 0.05% commission per trade as that is what I found most common on crypto exchanges and it's close to the commissions+spread you get on a cfd prop firm. I'm targeting a 1% risk per trade in the backtest to try and stay within prop firm boundaries of max 1% risk per trade.
Lastly, the original yearly and monthly performance table was developed by Quantnomad and I've build ontop of that code. Here's a link to the original publication:
That's everything for now, hope this indicator helps people visualise the potential of prop firms better or to understand that they are not a good fit for their current financial situation.
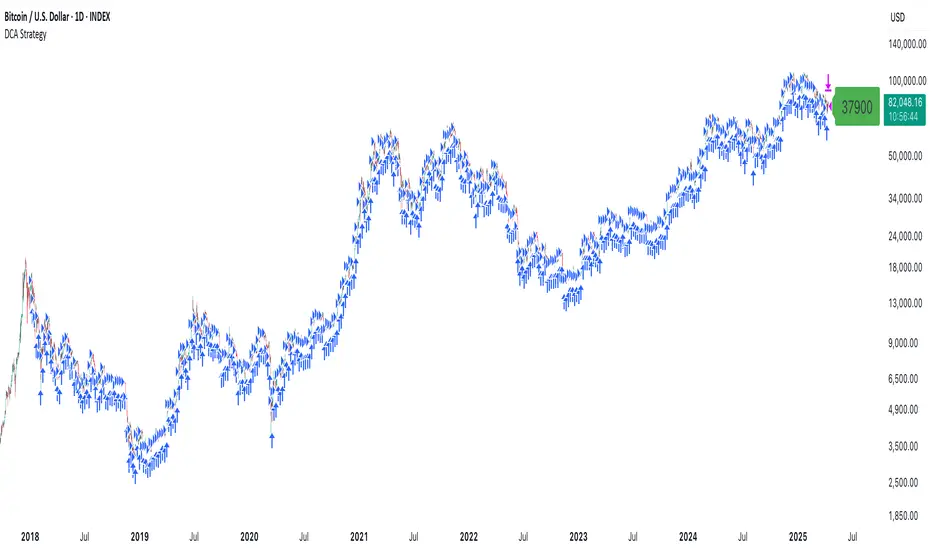
DCA StrategyThis strategy makes it easy for you to backtest and automate the DCA strategy based on 2 triggers:
Day of the week
Every X candles
This way you can set up your DCA strategy the way you like and automate on any exchange or even a DEX, which offers an API.
The strategy is auto selling on the last candle, otherwise you won't see any performance numbers because all positions will still be open (non conclusive).
Settings
Start Date & End Date
Use those dates to help you with your backtest period. It also helps when automating, to start at a specific time to mimic what you have already done on your own portfolio and thus be in sync in TV as well.
Capital to invest per trade
Set how capital to use per DCA buy signal. Hover over the tooltip to understand, which currency is used.
Close All on last candle
When backtesting, you must close open positions, otherwise the Strategy Tester won't show you any numbers. This is why the strategy automatically closes all positions on the last candle for your convenience (ON per default).
BUT, when automating, you cannot have this checked because it would sell all of your asset on every candle open. So turn this OFF when automating.
Use Day of Week Mode
This checkbox switches between the "Day of Week" mode or the "Every X Candles" mode.
Day of Week
Opens a long position at the start of the weekday you have set it to.
Hover over the tooltip to understand, which number to use for the day of the week you need.
Every X Candles
Opens a long position after every x candles. Always at the start of every such candle.
On the daily chart, this number represents "1 day", on the 1h chart, it's "1 hour" and so on.
Properties
Initial Capital
DCA has a special quirk and that is that it invests more and more and more funds the longer it runs. But TradingView takes the Initial Capital number to calculate Net Profit, thus the Initial Capital number has to grow with every additional dollar (money) that is being invested over time, otherwise the Net Profit number will be wrong.
Sadly PineScript does not allow to set the Initial Capital number dynamically. So you have to set it manually.
To that end, this strategy shows a Label on the last candle, which shows the Invested Capital. You must take that number and put it into the Initial Capital input and click Ok .
If you don't do this, your Net Profit Number will be totally wrong!
The label must show green .
If it shows red it means you need to change the Initial Capital number before looking at the performance numbers.
After every timeframe or settings change, you must adapt the Initial Capital, otherwise you will get wrong numbers.
Z-Score Normalized VIX StrategyThis strategy leverages the concept of the Z-score applied to multiple VIX-based volatility indices, specifically designed to capture market reversals based on the normalization of volatility. The strategy takes advantage of VIX-related indicators to measure extreme levels of market fear or greed and adjusts its position accordingly.
1. Overview of the Z-Score Methodology
The Z-score is a statistical measure that describes the position of a value relative to the mean of a distribution in terms of standard deviations. In this strategy, the Z-score is calculated for various volatility indices to assess how far their values are from their historical averages, thus normalizing volatility levels. The Z-score is calculated as follows:
Z = \frac{X - \mu}{\sigma}
Where:
• X is the current value of the volatility index.
• \mu is the mean of the index over a specified period.
• \sigma is the standard deviation of the index over the same period.
This measure tells us how many standard deviations the current value of the index is away from its average, indicating whether the market is experiencing unusually high or low volatility (fear or calm).
2. VIX Indices Used in the Strategy
The strategy utilizes four commonly referenced volatility indices:
• VIX (CBOE Volatility Index): Measures the market’s expectations of 30-day volatility based on S&P 500 options.
• VIX3M (3-Month VIX): Reflects expectations of volatility over the next three months.
• VIX9D (9-Day VIX): Reflects shorter-term volatility expectations.
• VVIX (VIX of VIX): Measures the volatility of the VIX itself, indicating the level of uncertainty in the volatility index.
These indices provide a comprehensive view of the current volatility landscape across different time horizons.
3. Strategy Logic
The strategy follows a long entry condition and an exit condition based on the combined Z-score of the selected volatility indices:
• Long Entry Condition: The strategy enters a long position when the combined Z-score of the selected VIX indices falls below a user-defined threshold, indicating an abnormally low level of volatility (suggesting a potential market bottom and a bullish reversal). The threshold is set as a negative value (e.g., -1), where a more negative Z-score implies greater deviation below the mean.
• Exit Condition: The strategy exits the long position when the combined Z-score exceeds the threshold (i.e., when the market volatility increases above the threshold, indicating a shift in market sentiment and reduced likelihood of continued upward momentum).
4. User Inputs
• Z-Score Lookback Period: The user can adjust the lookback period for calculating the Z-score (e.g., 6 periods).
• Z-Score Threshold: A customizable threshold value to define when the market has reached an extreme volatility level, triggering entries and exits.
The strategy also allows users to select which VIX indices to use, with checkboxes to enable or disable each index in the calculation of the combined Z-score.
5. Trade Execution Parameters
• Initial Capital: The strategy assumes an initial capital of $20,000.
• Pyramiding: The strategy does not allow pyramiding (multiple positions in the same direction).
• Commission and Slippage: The commission is set at $0.05 per contract, and slippage is set at 1 tick.
6. Statistical Basis of the Z-Score Approach
The Z-score methodology is a standard technique in statistics and finance, commonly used in risk management and for identifying outliers or unusual events. According to Dumas, Fleming, and Whaley (1998), volatility indices like the VIX serve as a useful proxy for market sentiment, particularly during periods of high uncertainty. By calculating the Z-score, we normalize volatility and quantify the degree to which the current volatility deviates from historical norms, allowing for systematic entry and exit based on these deviations.
7. Implications of the Strategy
This strategy aims to exploit market conditions where volatility has deviated significantly from its historical mean. When the Z-score falls below the threshold, it suggests that the market has become excessively calm, potentially indicating an overreaction to past market events. Entering long positions under such conditions could capture market reversals as fear subsides and volatility normalizes. Conversely, when the Z-score rises above the threshold, it signals increased volatility, which could be indicative of a bearish shift in the market, prompting an exit from the position.
By applying this Z-score normalized approach, the strategy seeks to achieve more consistent entry and exit points by reducing reliance on subjective interpretation of market conditions.
8. Scientific Sources
• Dumas, B., Fleming, J., & Whaley, R. (1998). “Implied Volatility Functions: Empirical Tests”. The Journal of Finance, 53(6), 2059-2106. This paper discusses the use of volatility indices and their empirical behavior, providing context for volatility-based strategies.
• Black, F., & Scholes, M. (1973). “The Pricing of Options and Corporate Liabilities”. Journal of Political Economy, 81(3), 637-654. The original Black-Scholes model, which forms the basis for many volatility-related strategies.

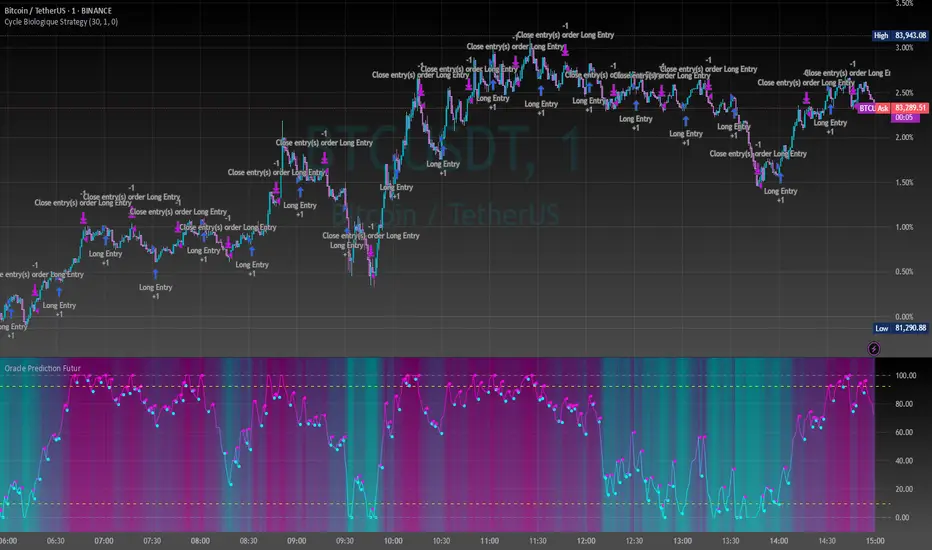
Cycle Biologique Strategy // (\_/)
// ( •.•)
// (")_(")
//@fr33domz
Experimental Research: Cycle Biologique Strategy
Overview
The "Cycle Biologique Strategy" is an experimental trading algorithm designed to leverage periodic cycles in price movements by utilizing a sinusoidal function. This strategy aims to identify potential buy and sell signals based on the behavior of a custom-defined biological cycle.
Key Parameters
Cycle Length: This parameter defines the duration of the cycle, set by default to 30 periods. The user can adjust this value to optimize the strategy for different asset classes or market conditions.
Amplitude: The amplitude of the cycle influences the scale of the sinusoidal wave, allowing for customization in the sensitivity of buy and sell signals.
Offset: The offset parameter introduces phase shifts to the cycle, adjustable within a range of -360 to 360 degrees. This flexibility allows the strategy to align with various market rhythms.
Methodology
The core of the strategy lies in the calculation of a periodic cycle using a sinusoidal function.
Trading Signals
Buy Signal: A buy signal is generated when the cycle value crosses above zero, indicating a potential upward momentum.
Sell Signal: Conversely, a sell signal is triggered when the cycle value crosses below zero, suggesting a potential downtrend.
Execution
The strategy executes trades based on these signals:
Upon receiving a buy signal, the algorithm enters a long position.
When a sell signal occurs, the strategy closes the long position.
Visualization
To enhance user experience, the periodic cycle is plotted visually on the chart in blue, allowing traders to observe the cyclical nature of the strategy and its alignment with market movements.
Strategy Stats [presentTrading]Hello! it's another weekend. This tool is a strategy performance analysis tool. Looking at the TradingView community, it seems few creators focus on this aspect. I've intentionally created a shared version. Welcome to share your idea or question on this.
█ Introduction and How it is Different
Strategy Stats is a comprehensive performance analytics framework designed specifically for trading strategies. Unlike standard strategy backtesting tools that simply show cumulative profits, this analytics suite provides real-time, multi-timeframe statistical analysis of your trading performance.
Multi-timeframe analysis: Automatically tracks performance metrics across the most recent time periods (last 7 days, 30 days, 90 days, 1 year, and 4 years)
Advanced statistical measures: Goes beyond basic metrics to include Information Coefficient (IC) and Sortino Ratio
Real-time feedback: Updates performance statistics with each new trade
Visual analytics: Color-coded performance table provides instant visual feedback on strategy health
Integrated risk management: Implements sophisticated take profit mechanisms with 3-step ATR and percentage-based exits
BTCUSD Performance
The table in the upper right corner is a comprehensive performance dashboard showing trading strategy statistics.
Note: While this presentation uses Vegas SuperTrend as the underlying strategy, this is merely an example. The Stats framework can be applied to any trading strategy. The Vegas SuperTrend implementation is included solely to demonstrate how the analytics module integrates with a trading strategy.
⚠️ Timeframe Limitations
Important: TradingView's backtesting engine has a maximum storage limit of 10,000 bars. When using this strategy stats framework on smaller timeframes such as 1-hour or 2-hour charts, you may encounter errors if your backtesting period is too long.
Recommended Timeframe Usage:
Ideal for: 4H, 6H, 8H, Daily charts and above
May cause errors on: 1H, 2H charts spanning multiple years
Not recommended for: Timeframes below 1H with long history
█ Strategy, How it Works: Detailed Explanation
The Strategy Stats framework consists of three primary components: statistical data collection, performance analysis, and visualization.
🔶 Statistical Data Collection
The system maintains several critical data arrays:
equityHistory: Tracks equity curve over time
tradeHistory: Records profit/loss of each trade
predictionSignals: Stores trade direction signals (1 for long, -1 for short)
actualReturns: Records corresponding actual returns from each trade
For each closed trade, the system captures:
float tradePnL = strategy.closedtrades.profit(tradeIndex)
float tradeReturn = strategy.closedtrades.profit_percent(tradeIndex)
int tradeType = entryPrice < exitPrice ? 1 : -1 // Direction
🔶 Performance Metrics Calculation
The framework calculates several key performance metrics:
Information Coefficient (IC):
The correlation between prediction signals and actual returns, measuring forecast skill.
IC = Correlation(predictionSignals, actualReturns)
Where Correlation is the Pearson correlation coefficient:
Correlation(X,Y) = (nΣXY - ΣXY) / √
Sortino Ratio:
Measures risk-adjusted return focusing only on downside risk:
Sortino = (Avg_Return - Risk_Free_Rate) / Downside_Deviation
Where Downside Deviation is:
Downside_Deviation = √
R_i represents individual returns, T is the target return (typically the risk-free rate), and n is the number of observations.
Maximum Drawdown:
Tracks the largest percentage drop from peak to trough:
DD = (Peak_Equity - Trough_Equity) / Peak_Equity * 100
🔶 Time Period Calculation
The system automatically determines the appropriate number of bars to analyze for each timeframe based on the current chart timeframe:
bars_7d = math.max(1, math.round(7 * barsPerDay))
bars_30d = math.max(1, math.round(30 * barsPerDay))
bars_90d = math.max(1, math.round(90 * barsPerDay))
bars_365d = math.max(1, math.round(365 * barsPerDay))
bars_4y = math.max(1, math.round(365 * 4 * barsPerDay))
Where barsPerDay is calculated based on the chart timeframe:
barsPerDay = timeframe.isintraday ?
24 * 60 / math.max(1, (timeframe.in_seconds() / 60)) :
timeframe.isdaily ? 1 :
timeframe.isweekly ? 1/7 :
timeframe.ismonthly ? 1/30 : 0.01
🔶 Visual Representation
The system presents performance data in a color-coded table with intuitive visual indicators:
Green: Excellent performance
Lime: Good performance
Gray: Neutral performance
Orange: Mediocre performance
Red: Poor performance
█ Trade Direction
The Strategy Stats framework supports three trading directions:
Long Only: Only takes long positions when entry conditions are met
Short Only: Only takes short positions when entry conditions are met
Both: Takes both long and short positions depending on market conditions
█ Usage
To effectively use the Strategy Stats framework:
Apply to existing strategies: Add the performance tracking code to any strategy to gain advanced analytics
Monitor multiple timeframes: Use the multi-timeframe analysis to identify performance trends
Evaluate strategy health: Review IC and Sortino ratios to assess predictive power and risk-adjusted returns
Optimize parameters: Use performance data to refine strategy parameters
Compare strategies: Apply the framework to multiple strategies to identify the most effective approach
For best results, allow the strategy to generate sufficient trade history for meaningful statistical analysis (at least 20-30 trades).
█ Default Settings
The default settings have been carefully calibrated for cryptocurrency markets:
Performance Tracking:
Time periods: 7D, 30D, 90D, 1Y, 4Y
Statistical measures: Return, Win%, MaxDD, IC, Sortino Ratio
IC color thresholds: >0.3 (green), >0.1 (lime), <-0.1 (orange), <-0.3 (red)
Sortino color thresholds: >1.0 (green), >0.5 (lime), <0 (red)
Multi-Step Take Profit:
ATR multipliers: 2.618, 5.0, 10.0
Percentage levels: 3%, 8%, 17%
Short multiplier: 1.5x (makes short take profits more aggressive)
Stop loss: 20%

External Signals Strategy TesterExternal Signals Strategy Tester
This strategy is designed to help you backtest external buy/sell signals coming from another indicator on your chart. It is a flexible and powerful tool that allows you to simulate real trading based on signals generated by any indicator, using input.source connections.
🔧 How It Works
Instead of generating signals internally, this strategy listens to two external input sources:
One for buy signals
One for sell signals
These sources can be connected to the plots from another indicator (for example, custom indicators, signal lines, or logic-based plots).
To use this:
Add your indicator to the chart (it must be visible on the same pane as this strategy).
Open the settings of the strategy.
In the fields Buy Signal and Sell Signal, select the appropriate plot (line, value, etc.) from the indicator that represents the buy/sell logic.
The strategy will open positions when the selected buy signal crosses above 0, and sell signal crosses above 0.
This logic can be easily adapted by modifying the crossover rule inside the script if your signal style is different.
⚙️ Features Included
✅ Configurable trade direction:
You can choose whether to allow long trades, short trades, or both.
✅ Optional close on opposite signal:
When enabled, the strategy will exit the current position if an opposite signal appears.
✅ Optional full position reversal:
When enabled, the strategy will close the current position and immediately open an opposite one on the reverse signal.
✅ Risk Management Tools:
You can define:
Take Profit (TP): Position will be closed once the specified profit (in %) is reached.
Stop Loss (SL): Position will be closed if the price drops to the specified loss level (in %).
BreakEven (BE): Once the specified profit threshold is reached, the strategy will move the stop-loss to the entry price.
📌 If any of these values (TP, SL, BE) are set to 0, the feature is disabled and will not be applied.
🧪 Best Use Cases
Backtesting signals from custom indicators, without rewriting the logic into a strategy.
Comparing the performance of different signal sources.
Testing external indicators with optional position management logic.
Validating strategies using external filters, oscillators, or trend signals.
📌 Final Notes
You can visualize where the strategy detected buy/sell signals using green/red markers on the chart.
All parameters are customizable through the strategy settings panel.
This strategy does not repaint, and it processes signals in real-time only (no lookahead bias).
