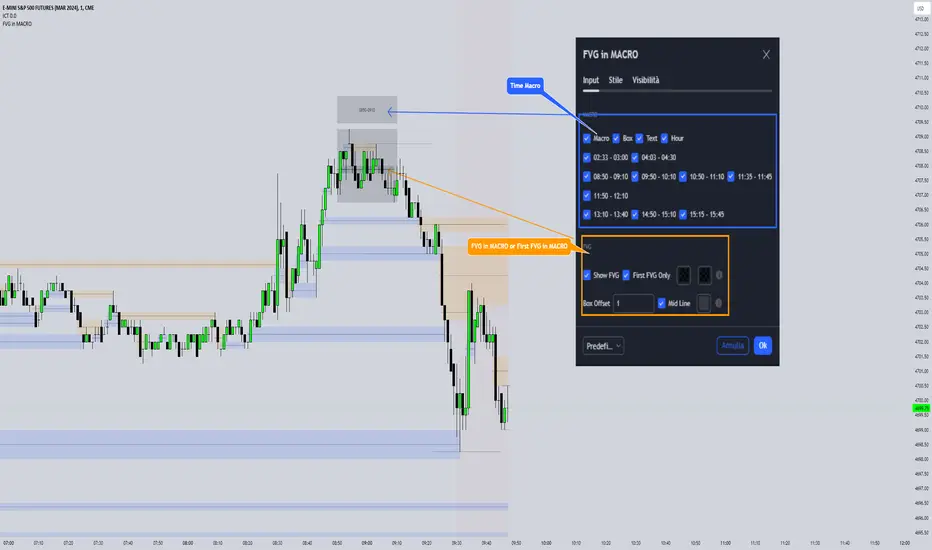
FVG in MACROGuided by ICT tutoring, I created this versatile indicator to scan the FVG in MACRO time.
This indicator combines the MACRO time with the Fair value GAP (FVG) in an alternative way, showing a simple way of viewing the FVG within the MACRO time, so you can have a clearer view of which direction the MACRO is influencing
''MACRO is a delivery time frame of the interbank price in which it undergoes a series of controls and is likely to move towards liquidity.''
The user has the possibility to:
- Choose the relevant MACRO time
- Choose whether to view all FVGs in the MACROS
- Choose to view only the First FVG at each MACRO
The indicator should be used as shown by the ICT in its concepts, during the MACRO time the price can consolidate or can head towards liquidity.
The probability that the direction is correct increases with respect for the FVG, in this way it is possible to evaluate the entry zone in the FVG and the Take profit zone for Liquidity
As in the following example:
Educational
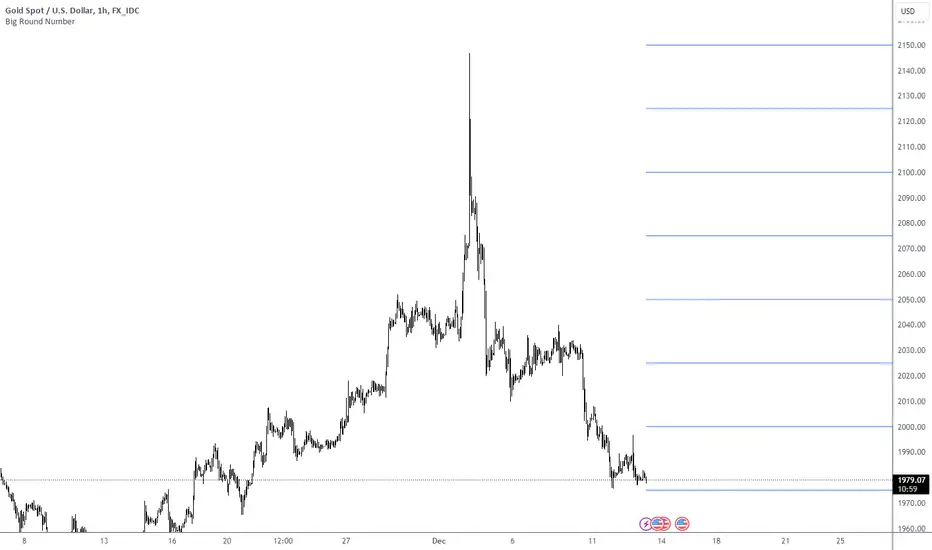
Big Round Number for GOLD (XAU/USD)This is simple indicator to show BRN (Big Round Number) on price level, it can use to help analyze the price action on the chart.
Max Rise / Max DrawdownThis Pine Script indicator, titled 'Max Rise / Max Drawdown,' calculates and plots the maximum rise and maximum drawdown based on a specified length. It computes the percentage increase from a past low and decrease from a past high over the defined period, visually presenting this data on the chart. The indicator displays two lines: one for the maximum rise (colored lime) and another for the maximum drawdown (colored red), while also indicating thresholds at +0.01 and -0.01 with green and maroon horizontal lines respectively.

ICT IPDAGuided by ICT tutoring, I create this versatile indicator "IPDA".
This indicator shows a different way of viewing the “IPDA” by calculating from START
(-20 / -40 / -60) to (+20 /+40 /+60) Days, showing the Highs and Lows of the IPDA of the Previous days and both of the subsequent ones, the levels of (-20 / -40 / -60) Days can be taken into consideration as objectives to be achieved in the range of days (+20 /+40 /+60)
The user has the possibility to:
- Choose whether to display IPDAs before and after START
- Choose to show High and Low levels
- Choose to show Prices
The indicator should be used as ICT shows in its concepts.
Example on how to evaluate a possible Start IPDA:
Example for Entry targeting IPDAs :
If something is not clear, comment below and I will reply as soon as possible.

Optics Alert ZoneOptics Alert Zone shows price ranges for prices 17 days and 40 days ago. These can be adjusted based on asset class and volatility.
Bullish is when price is above 17 and 40 day.
Bearish is when price is below 17 and 40 day.

[F][IND] - Draw Vertial Line at Last N BarDescription:
Enhance your trading analysis with the "Vertical Line at N Last Bars" script! This powerful tool provides traders with a visual reference to key points in the historical price action, aiding in the identification of crucial patterns, trends, and potential trading opportunities.
Key Features:
1. Customizable Parameters:
Tailor the script to your specific needs by adjusting the number of last bars (N) to plot vertical lines. This flexibility allows you to focus on short-term or long-term trends based on your trading strategy.
2. Visualize Critical Events:
Instantly mark important events, such as the release of economic data, key market sessions, or specific price levels. The vertical lines serve as a quick reference, making it easier for traders to identify correlations between events and price movements.
3. Enhance Technical Analysis:
Complement your technical analysis by visually highlighting points of interest on the chart. Whether you're tracking reversals, breakouts, or support/resistance levels, the script aids in better understanding price dynamics.
4. Easy to Use:
The script is designed with simplicity in mind. Just apply it to your chart, customize the parameters, and let it do the work for you. No complex coding or manual drawing required.
Alerts:
You can enable alerts on this indicator to receive timely notifications.
Disclaimer:
This indicator is provided for educational purposes only. Trading involves risk, and users should consult with a financial professional before making any trading decisions.
Your Feedback Matters!
Please feel free to comment or reach out if you have any improvement suggestions or if you would like to request the development of a specific indicator. Your feedback is invaluable!

Limited Growth Stock-to-Flow (LGS2F) [AlgoAlpha]Description:
The "∂ Limited Growth Stock-to-Flow (LG-S2F)" indicator, developed by AlgoAlpha, is a technical analysis tool designed to analyze the price of Bitcoin (BTC) based on the Stock-to-Flow model. The indicator calculates the expected price range of BTC by incorporating variables such as BTC supply, block height, and model parameters. It also includes error bands to indicate potential overbought and oversold conditions.
How it Works:
The LG-S2F indicator utilizes the Stock-to-Flow model, which measures the scarcity of an asset by comparing its circulating supply (stock) to its newly produced supply (flow). In this script, the BTC supply and block height data are obtained to calculate the price using the model formula. The formula includes coefficients (a, b, c) and exponentiation functions to derive the expected price.
The script incorporates error bands based on uncertainty values derived from the standard errors of the model parameters. These error bands indicate the potential range of variation in the expected price, accounting for uncertainties in the model's parameters. The upper and lower error bands visualize potential overbought and oversold conditions, respectively.
Usage:
Traders can utilize the LG-S2F indicator to gain insights into the potential price movements of Bitcoin. The indicator's main line represents the expected price, while the error bands highlight the potential range of variation. Traders may consider taking long positions when the price is near or below the lower error band and short positions when the price is close to or above the upper error band.
It's important to note that the LG-S2F indicator is specifically designed for Bitcoin and relies on the Stock-to-Flow model. Users should exercise caution and consider additional analysis and factors before making trading decisions solely based on this indicator.
Originality:
The LG-S2F indicator, developed by QuantMario and AlgoAlpha, is an original implementation that combines the Stock-to-Flow model with error bands to provide a comprehensive view of BTC's potential price range. While the concept of Stock-to-Flow analysis exists, the specific calculations, incorporation of error bands, and customization options in this script are unique to QuantMario's methodology. The script is released under Mozilla Public License 2.0, allowing users to utilize and modify it while adhering to the license terms.

ICT Premium/DiscountGuided by ICT mentorship and help from TraderTim and its community, I created this versatile indicator to mark a "Premium/Discount" price range.
This indicator shows the Premium and Discount Zones in an alternative way, manually setting the start of the band and automatically shows the HTF and LTF FVG present only in the set band, having a cleaning of the graph from possible other distractions, so as to be able to have a clear vision clear of the set trading range
The user has the possibility to:
- Choose the start of the interval from the graph by moving the start line
- Choose to show levels 50% - 75% - 25% of the range
- Choose the color, style and size of the lines
- Choose to display FVG LTF or HTF in range
- Choose the FVG mitigation mode
The indicator must be used as shown by the ICT in its concepts, the Premium and Discount zones are nothing more than zones where the price risks retracing, and consequently we can evaluate making entries in the Premium Zone, Sell is evaluated, in the Discoutn Zone they are evaluated as Buy, taking the opposite area as Take Profit
As in the example below:
If anything is unclear, comment below and I will get back to you as soon as possible.
How to change range:

Mandelbrot SetThe Mandelbrot set represents a set of complex numbers with distinctive and very well known intricate geometric properties. Here I have attempted to implement it in Pinescript leveraging tables.
The defining formula for the set is:
Zn+1 = Zn2 + C
If, after a certain number of iterations, the magnitude of the complex number remains bounded (does not diverge to infinity), the point is considered part of the Mandelbrot set.
The Mandelbrot set exhibits intricate and infinitely detailed fractal patterns, characterized by self-similarity at different scales. Due to limitations in Pinescript and the number of possible table cells (Pinescript is not designed for this at all and this is merely a showcase of how flexible & great Pinescript can be it is) the resolution over this set is low.
Users can zoom in and out of the set via the provided inputs.
The values in each cell represent the number of iterations required for the corresponding point in the Mandelbrot set to escape a certain threshold.

Time & Sales (Tape) [By MUQWISHI]▋ INTRODUCTION :
The “Time and Sales” (Tape) indicator generates trade data, including time, direction, price, and volume for each executed trade on an exchange. This information is typically delivered in real-time on a tick-by-tick basis or lower timeframe, providing insights into the traded size for a specific security.
_______________________
▋ OVERVIEW:
_______________________
▋ Volume Dynamic Scale Bar:
It's a way for determining dominance on the time and sales table, depending on the selected length (number of rows), indicating whether buyers or sellers are in control in selected length.
_______________________
▋ INDICATOR SETTINGS:
#Section One: Table Settings
#Section Two: Technical Settings
(1) Implement By: Retrieve data by
(1A) Lower Timeframe: Fetch data from the selected lower timeframe.
(1B) Live Tick: Fetch data in real-time on a tick-by-tick basis, capturing data as soon as it's observed by the system.
(2) Length (Number of Rows): User able to select number of rows.
(3) Size Type: Volume OR Price Volume.
_____________________
▋ COMMENT:
The values in a table should not be taken as a major concept to build a trading decision.
Please let me know if you have any questions.
Thank you.

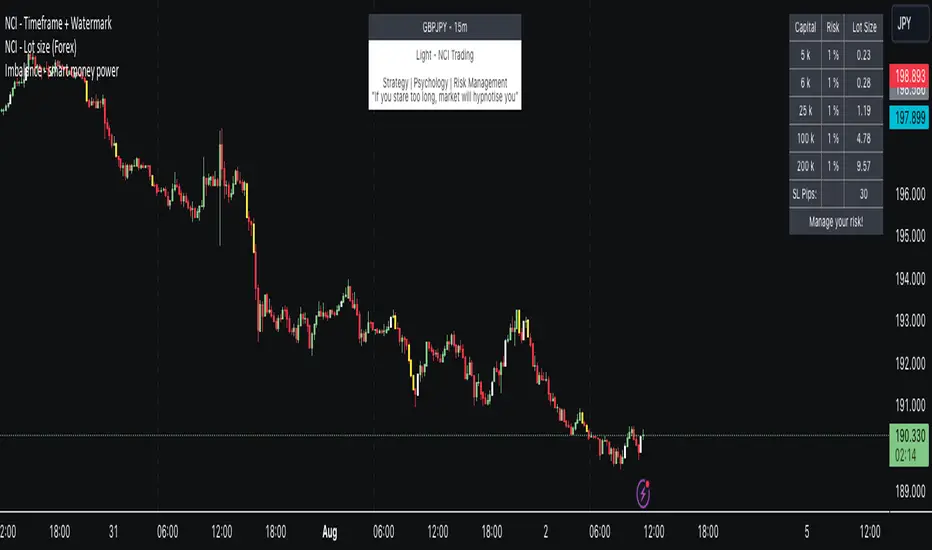
NCI - Lot size (Forex)Description:
The "NCI - Lot Size (Forex)" is a comprehensive tool designed for Forex traders to optimise their risk management strategies. This indicator dynamically calculates and displays the ideal lot size for your trades based on real-time currency conversion rates and your predefined risk parameters.
Key Features:
1. Real-Time Data Integration: Leverages current Forex market data from OANDA for major currency pairs, including USDJPY, USDCHF, AUDUSD, GBPUSD, NZDUSD, USDCAD, and EURUSD, ensuring accurate lot size calculations.
2. Customizable Account Balances: Set up to five different account balances to simulate various trading scenarios.
3. Adjustable Risk Management: Define your risk tolerance with a customizable risk percentage, allowing you to align the lot size calculations with your individual trading strategy.
4. Stoploss Adjustment: Input your desired stop loss in pips, which directly influences the calculated lot size, ensuring that your trades stay within your risk parameters.
5. Currency-Specific Adjustments: The script automatically adjusts the lot size based on the currency pair being traded, accounting for differences in currency values and volatility.
6. Intuitive Display: A clear and concise table is displayed on your chart, presenting the calculated lot sizes for each account balance and risk setting, alongside your specified stop loss.
7. User-Friendly Interface: Easy-to-use inputs make setting up the indicator a breeze, allowing both novice and experienced traders to make the most of this tool.
How to Use:
- Set your account balances (up to five different accounts).
- Define your risk percentage.
- Input your stop loss in pips.
- The table will dynamically show the ideal lot size for each account based on the current Forex market data and your settings.
---
Please Note: Trading in Forex involves significant risk and may not be suitable for all investors. The use of this indicator does not guarantee profits and should be used as part of a comprehensive trading strategy.
Choose Symbol, Mode with HullThis Pine Script code is designed to create a customizable indicator on the TradingView platform. Below is an introduction to its features and purpose:
Introduction:
This script serves as a versatile indicator on TradingView, allowing users to choose between different modes (Heikin-Ashi, Linear, and Normal) and apply a Hull Moving Average (Hull) for trend analysis. The primary features include mode selection, the choice of using different calculation methods, and the option to incorporate the Hull Moving Average for enhanced trend visibility.
Key Features:
Mode Selection:
Users can choose between "Heikin-Ashi," "Linear," or "Normal" modes, influencing how the open, high, low, and close prices are calculated.
Hull Moving Average:
The script incorporates the Hull Moving Average (Hull) to provide a smoothed trend line for better trend identification.
Calculation Methods:
Users can select different calculation methods for the open, high, low, and close prices, including Simple Moving Average (SMA), Exponential Moving Average (EMA), Smoothed Moving Average (SMMA or RMA), Weighted Moving Average (WMA), and Volume Weighted Moving Average (VWMA).
Customizable Lengths:
Length parameters are customizable, allowing users to adjust the period lengths for the Hull Moving Average and other calculation methods.
Buy and Sell Signals:
Buy and sell signals are generated based on crossovers and crossunders between the Hull Moving Average and the price. These signals are visually displayed on the chart with corresponding labels.
Color-Coding:
The script utilizes color-coding to distinguish between bullish (lime) and bearish (red) trends, making it easier for users to identify potential changes in market direction.
Customizable Symbol and Resolution:
Users have the option to choose a specific trading symbol and resolution for analysis.
Important Note:
This script is provided for educational purposes and does not constitute financial advice. Traders and investors should conduct thorough research and analysis before making any trading decisions. Additionally, customization options should be explored to align the script with individual trading preferences.

Trading Strategy - Follow The Plan"Trading Strategy - Follow The Plan" is a TradingView indicator specifically crafted for traders dedicated to adhering to a structured approach. It emphasizes the elimination of emotional decision-making by providing clear, actionable steps. This tool allows you to articulate and visually embed your trading strategy directly onto your charts, encompassing your entry plan, exit plan, and any additional notes crucial for maintaining focus and discipline. It's designed to aid in sustaining consistency in your trading executions, ensuring that you remain steadfastly aligned with your predetermined trading methodology.
Features
1. Entry Plan: Allows traders to outline specific criteria for market entry. This could include conditions like divergences on multiple timeframes, specific pattern recognitions, or other entry triggers. The flexibility of this section caters to various trading styles and strategies.
2. Exit Plan: Dedicated to defining exit strategies, this section can include details on profit targets, stop-loss levels, or conditions for position reversal. It serves as a constant reminder of exit strategies during active trades.
3. Notes: A customizable space for traders to jot down essential rules, observations, or reminders. This section is particularly useful for reinforcing risk management practices and maintaining focus on broader trading goals.
4. Visibility Controls: Each section of the trading plan (Entry Plan, Exit Plan, Notes) can be toggled on or off, allowing traders to manage on-screen information and reduce chart clutter.
5. Layout Customization: Users can choose the placement of the trading plan on their chart, with options including Top Right, Top Left, Bottom Right, and Bottom Left. This caters to individual preferences and screen setups.
6. Appearance Customization: The indicator allows for adjustments in text and background colors, and text sizes for titles and content, enhancing readability and personal preference alignment.

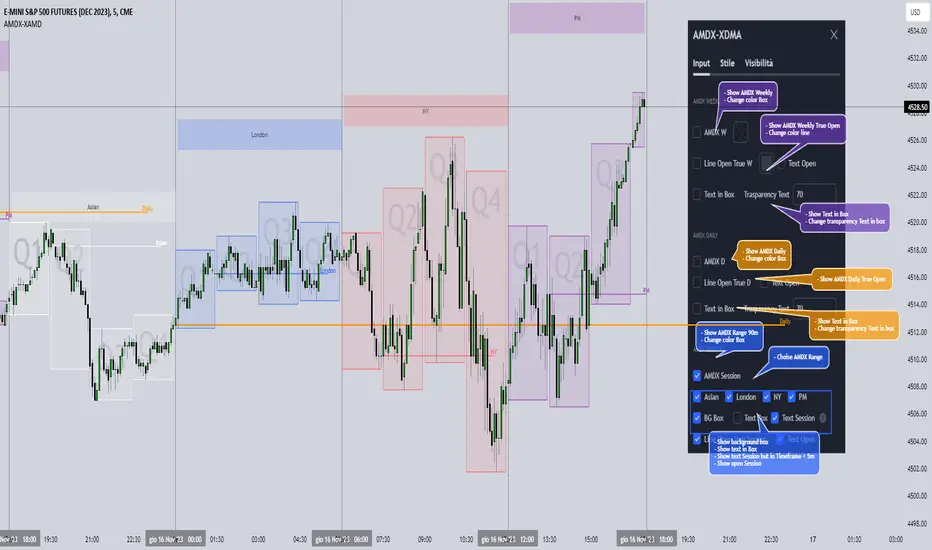
AMDX-XAMDGuided by ICT tutoring and also inspired by the teaching of
Daye', I create this versatile "AMDX" indicator.
A = Accumulation
M = Manipulation
D = Distribution
X = Continuation Or Reversal
This indicator shows a different way of viewing all the Timeframes by dividing them into Quarters, in this context the Trading sessions are divided into a 90m cycle, dividing each time range into Q1-Q2-Q3-Q4, in this way you have a clear vision of what the price is likely to do
True Open Times =
Opening Week - Monday at 6pm
Opening Day - 00:00
Asia -7.30pm
London -01.30
New York -07:30
PM -1.30pm
Session Times =
Q1 Asia 18:00-00:00
Q2 London 00:00-06:00
Q3 New York 06:00-12:00
Q4 PM 12:00-18:00
The user has the possibility to:
- Choose whether to display AMDX W
- Choose whether to display AMDX D
- Choose whether to display AMDX Session
- Choose to show the text in the Box
- Choose to show open levels
The indicator should be used as ICT and 'Daye' show in their concepts.
The indicator divides everything into Quarter ranges and classifies them into Q1-Q2-Q3-Q4 (as in the example above), and each Quarter has its own specific function, and can be used in this way:
If Q1 does an expansion it is likely that Q2 will do a consolidation, Q3 will do a Manipulation and Q4 will do a reversal returning to Q1
-If we are Bullish we buy under Open Session
-If we are Bearish we buy above open session
As in the example below:
If something is not clear, comment below and I will reply as soon as possible.
Capital Accumulation Plan (CAP) Simulator 2.0Description:
This indicator serves as a simulation tool for the Capital Accumulation Plan (CAP). The CAP is an investment strategy involving regular contributions of a fixed amount at consistent intervals, regardless of market fluctuations. This simulator allows you to visualize how your invested capital might grow over time, considering a fixed monthly investment in a given financial instrument.
How to Use:
Customize the monthly investment amount, the day of the month for the investment, and the simulation period. Also, input the percentage of taxation on potential dividends and the Total Expense Ratio (TER) of the financial instrument. The indicator calculates the portfolio value over time, the invested capital, and the average cost. If applicable, it also calculates the dividend amounts over time and the corresponding taxes to be paid.
The indicator displays how these metrics would change over time following the PAC strategy.
Important Notes:
Apply exclusively to the daily chart; a fix for the chosen day absence will be implemented shortly.

OKX Signal BOT - Strategy Scanner & Orderer
Hello traders,
With the OKX Signal BOT - Strategy Scanner & Orderer, you can now design your own strategy, scan over 20 cryptocurrencies, and send orders for futures trades on the OKX exchange.
How to Use:
🌐 First, log into your account on the OKX exchange and create a signal bot.
📝 While creating the signal bot, note down the webhook URL and signal token variables given to you; they'll be needed later.
🔍 Select the trading pairs that the bot will work on.
📈 Add this indicator to your chart.
⚙️ Adjust the values of the indicators you will use in your strategy.
📊 Set your entry conditions and indicator setups according to your preference.
🚀 Decide which condition will generate a LONG signal and which will generate a SHORT signal.
🔗 Then, link these conditions with either an AND or OR connector.
🛠️ This also serves as a strategy designer.
🆔 Paste the signal token value you got from OKX into the OKX Signal ID section in the indicator.
➕ Add the cryptocurrency pairs you added to the bot on OKX to this design tool as well.
💾 Save and exit.
🚨 Set an alarm and paste the webhook URL link you got from OKX.
Congratulations, you can now send signals from Tradingview to the OKX exchange without needing any other platform.
Warnings:
⚠️ Works only for futures trades.
📈 Make your leverage settings through the exchange.
🛑 It is recommended to set take profit and stop loss through the exchange.
🚫 If too many alarms are triggered, Tradingview may stop your alarms.
💡 Ensure that the coins you add in the symbol section are from the OKX exchange.
🔍 For futures trades, make sure the symbols end with ".P".
🎉 Enjoy using it!
