DISEGNATORE Livelli ATR H4 v1.3 FinaleThe Drawer needed to display "ATR. St. Dev. CALCULATOR H4" output.
Forecasting

ATR St. Devs. CALCULATOR H4a Calculator able to create a Statistical Sample of 4h time-specific candles and their ATR Values, and projects its Standard Deviations on any timeframes chart.

Livelli Giornalieri ATRDisplays daily Open price and its ATR Value projections. Import the data from "ATR Screener"

No Wick CandlesOVERVIEW
In trading, no wick candles (also called full-body candles or marubozu in Japanese candlestick terminology) are powerful momentum indicators. They show that price moved in one direction for the entire duration of the candle, with no pullback or hesitation.
No upper wick : price never went above the open (in bearish case) or close (in bullish case)
No lower wick : price never went below the open (in bullish case) or close (in bearish case)
No wicks at all : open and close are the exact high and low = a full-body candle
⚠️ Caution : One candle alone isn’t always enough for a decision — confirm with:
• Volume
• Support/resistance context
• Follow-through candle behavior
SUMMARY
No wick candles = strong conviction from buyers or sellers with zero hesitation during that time period.
They’re valuable for scalpers, breakout traders, and momentum strategies — especially on high volume or at key levels.

Livelli Settimanali ATRDisplays Weekly Open price and its ATR Value projections. Import the data from "ATR Screener"

Economic Event Timer & Alerts [AlgoXcalibur]Stay ahead of market-moving news with this real-time event tracker and countdown alert system.
This essential algorithm displays critical scheduled events that may influence sudden spikes in market volatility, helping you stay aware and reduce exposure to unpredictable moves before they even happen. Featuring a captivating on-chart display with event titles, adjustable time zone, real-time countdowns, and live alert notifications — you’ll always know what’s ahead — so you can prepare, not react.
🧠 Algorithm Logic
The Economic Event Timer & Alerts system delivers critical market awareness through an array of integrated functions. At its core, a live countdown table provides real-time updates on the day’s scheduled economic events, with dynamic, color-coded countdowns that ensure fast and easy interpretation at a glance. Complementing the table, Countdown Alerts notify you 30 minutes, 10 minutes, and 1 minute prior to each event—giving you clear, timely reminders without the need to constantly monitor your chart. The adjustable time zone input supports ET, CT, MT, PT, or UTC, so the displayed time-of-event aligns with your trading session. Rigorously refined, the algorithm updates the table daily—and clearly displays No Scheduled Events Today to provide certainty and reassurance on days without scheduled events. Packaged in a minimalist, unobtrusive design, the tool remains visually clean and focused for serious traders.
Updated automatically for hassle-free peace of mind.
⚙️ Features
• Time Zone Selector: Easily toggle between time zones to match your trading session.
• Countdown Alerts: Enable real-time notifications to keep you informed and aware of events without having to monitor the chart.
• Update & Expiration Awareness Feature:
This innovative feature includes a simple visual and alert system that prompts you when it’s time to reload the indicator & recreate alerts — ensuring your alerts are always tied to the latest data update.
🔄 Update Available
On the final day of current event data, the indicator will:
• Display Update Available on the indicator’s table
• Send an alert at 4:00 PM ET reminding you to reload & recreate alerts
You can load the updated version anytime that day.
⛔ Expired
If not reloaded, the next day the indicator will:
• Display an EXPIRED banner on the indicator’s table
• Send a Data Expired alert every day at 8:30 AM ET that prompts you to recreate alerts, until you do or disable the alert.
This prevents missing event alerts unknowingly.
Why is this feature necessary?
Even though the indicator is updated when necessary (typically every 2–4 weeks) to provide upcoming event data automatically, TradingView alerts do not auto-update —they stay tied to the version of the script that was active when the alert was created.
This thoughtful refinement is designed to ensure your alerts remain synced to current events and ready for when it matters most.
🚨 Protect Your Capital
At AlgoXcalibur, we understand that the best way to be profitable is to avoid unnecessary risk.
Dedicated to empowering traders with insight that matters, we designed this tool to transform inconvenient economic calendars into effortless, essential information—displayed directly on your chart. Whether you’re managing open positions or timing new trades, knowing when impactful events are about to hit is crucial to being proactive, protecting capital, and trading with confidence. This is not a technical analysis indicator—this is a risk management tool that provides traders with a fundamental edge.
Built for traders who value risk management, market awareness, and algorithm automation.
🔐 To get access or learn more, visit the Author’s Instructions section.

Livelli Mensili ATRDisplays monthly ATR Value projections. Use this indicator combined with "ATR Screener".


Advanced Day Separator with Future ProjectionsThe general indicator works on historical data, meaning they develop after the fact. The same is for indicators that show day separation. I was always forced to manually draw in vertical lines for the upcoming week. This indicator I built solves that issue by projecting vertical day separations for the upcoming week. Enjoy! :-)

🚀 NQ1 Smart Limit System V5### 🚀 NQ1 Smart Limit System V5 | מערכת לימיטים חכמה ל-נאסד"ק
מערכת מסחר פורצת דרך שתוכננה במיוחד עבור סוחרי נאסד"ק (NQ1, QQQ), במטרה לאתר נקודות היפוך בעלות סבירות גבוהה. האינדיקטור לא מסתמך על שיטה בודדת, אלא משתמש במנוע קונפלואנס (מפגש אסטרטגיות) רב-עוצמה ובמנגנון אישור דינמי כדי לספק איתותי כניסה איכותיים למסחר מבוסס פקודות לימיט.
---
### **🎯 תכונות עיקריות**
* **מנוע קונפלואנס רב-שכבתי:** מזהה אזורים בהם נפגשות מספר שיטות ניתוח טכני מוכחות:
* **מבני ווייקוף (Wyckoff Springs):** לזיהוי שבירות שווא וספיגה מוסדית.
* **נזילות כלואה (Trapped Liquidity):** לאיתור אזורים מהם יצאו מהלכים חזקים.
* **אורדר בלוקים (Order Blocks):** לאיתור טביעות הרגל של "הכסף החכם".
* **🧠 מנגנון אישור דינמי:** לפני כל כניסה, המערכת מריצה בדיקות בזמן אמת כדי לסנן איתותי שווא:
* **בדיקת מומנטום:** מוודא שהמחיר לא מגיע לאזור באגרסיביות יתר.
* **בדיקת קונטקסט רב-זמני (MTF):** מוודא שהעסקה תואמת למגמה הכללית.
* **בדיקת ספיגה (Absorption):** מחפש סימנים של כניסת קונים/מוכרים חזקים ברמה.
* **🧬 מערכת DNA לומדת:** המערכת מתאימה את עצמה לביצועי העבר ונותנת משקל גבוה יותר לאסטרטגיות שמצליחות בתנאי השוק הנוכחיים.
* **🚀 התאמות ייעודיות ל-NQ1:** כולל כלים ייחודיים לנאסד"ק כמו זיהוי מספרים עגולים, אסטרטגיית פתיחה, מסנן מניות מגה-קאפ, וניהול תנודתיות קיצונית.
* **📊 שלושה מצבי מסחר:** בחר את סגנון המסחר שלך:
* **🏃 Scalping:** למהלכים מהירים ואגרסיביים.
* **⚖️ Balanced:** גישה מאוזנת ובטוחה.
* **🎯 Swing:** למהלכים גדולים וסבלניים.
---
### **איך זה עובד?**
המערכת פועלת בתהליך חכם בן 3 שלבים:
1. **זיהוי:** המערכת מזהה אזור פוטנציאלי בעל ציון גבוה ומסמנת אותו במצב **"ממתין"**.
2. **אישור:** כאשר המחיר מתקרב לאזור, המערכת מפעילה את מנגנון האישור הדינמי. אם האזור עובר את הבדיקות בהצלחה, הוא משתנה למצב **"מאושר"**.
3. **ביצוע:** רק לאחר קבלת סטטוס **"מאושר"**, הסוחר יכול להציב פקודת לימיט עם תוכנית מסחר מלאה (כניסה, סטופ ויעדים) שהמערכת מספקת.
---
### **איך להשתמש?**
1. בחר את מצב המסחר המתאים לסגנון שלך (`Scalping`, `Balanced`, `Swing`).
2. המתן להופעת אזור על הגרף עם סטטוס **"ממתין"**. אין לפעול בשלב זה.
3. עקוב אחר האזור. אם הוא עובר את הבדיקות והופך ל-**"מאושר" ✅**, זהו האות שלך להתכונן.
4. הצב פקודת לימיט בפלטפורמת המסחר שלך בהתאם לנתוני הכניסה, הסטופ לוס (SL) ויעדי הרווח (TP1, TP2) שהאינדיקטור מציג.
**גילוי נאות:** אינדיקטור זה הוא כלי עזר לקבלת החלטות ואינו מהווה המלצה פיננסית. מסחר בחוזים עתידיים כרוך בסיכון. יש לנהל סיכונים בקפידה.
### 🚀 NQ1 Smart Limit System V5 | Smart Limit System for NASDAQ
A groundbreaking trading system designed exclusively for Nasdaq traders (NQ1, QQQ), engineered to identify high-probability reversal points. This indicator does not rely on a single method; instead, it utilizes a powerful multi-layered confluence engine and a dynamic confirmation mechanism to provide high-quality entry signals for limit order-based trading.
---
### **🎯 Key Features**
* **Multi-Layered Confluence Engine:** Identifies zones where multiple proven technical analysis concepts converge:
* **Wyckoff Structures (Springs):** To detect false breakouts and institutional absorption.
* **Trapped Liquidity:** To pinpoint zones that initiated strong impulse moves.
* **Order Blocks:** To track the footprints of "Smart Money".
* **🧠 Dynamic Confirmation Mechanism:** Before any entry, the system runs real-time checks to filter out false signals:
* **Momentum Check:** Ensures the price isn't approaching the zone too aggressively.
* **Multi-Timeframe (MTF) Context:** Verifies that the trade aligns with the broader market trend.
* **Absorption Check:** Looks for signs of strong buying/selling pressure at the level.
* **🧬 Adaptive DNA System:** The system learns from its past performance, giving more weight to strategies that are succeeding in the current market conditions.
* **🚀 Special NQ1 Adaptations:** Includes unique tools for the Nasdaq index, such as psychological round number detection, an opening range strategy, a mega-cap stock filter, and extreme volatility management.
* **📊 Three Trading Modes:** Choose your preferred trading style:
* **🏃 Scalping:** For fast and aggressive moves.
* **⚖️ Balanced:** For a safe and well-rounded approach.
* **🎯 Swing:** For large, patient moves.
---
### **How It Works**
The system operates on a smart 3-step process:
1. **Identification:** The system identifies a potential high-score zone and marks it as **"Waiting"**.
2. **Confirmation:** As the price approaches the zone, the dynamic confirmation mechanism is activated. If the zone successfully passes the checks, its state changes to **"Confirmed"**.
3. **Execution:** Only after receiving a **"Confirmed"** status can the trader place a limit order with a complete trade plan (Entry, Stop Loss, and Take Profit targets) provided by the system.
---
### **How to Use**
1. Select the trading mode that fits your style (`Scalping`, `Balanced`, `Swing`).
2. Wait for a zone to appear on the chart with a **"Waiting"** status. Do not act at this stage.
3. Monitor the zone. If it passes the checks and becomes **"Confirmed" ✅**, this is your signal to prepare.
4. Place a limit order in your trading platform according to the Entry, Stop Loss (SL), and Take Profit (TP1, TP2) levels displayed by the indicator.
**Disclaimer:** This indicator is a decision-support tool and does not constitute financial advice. Trading futures involves risk. Please manage your risk carefully.

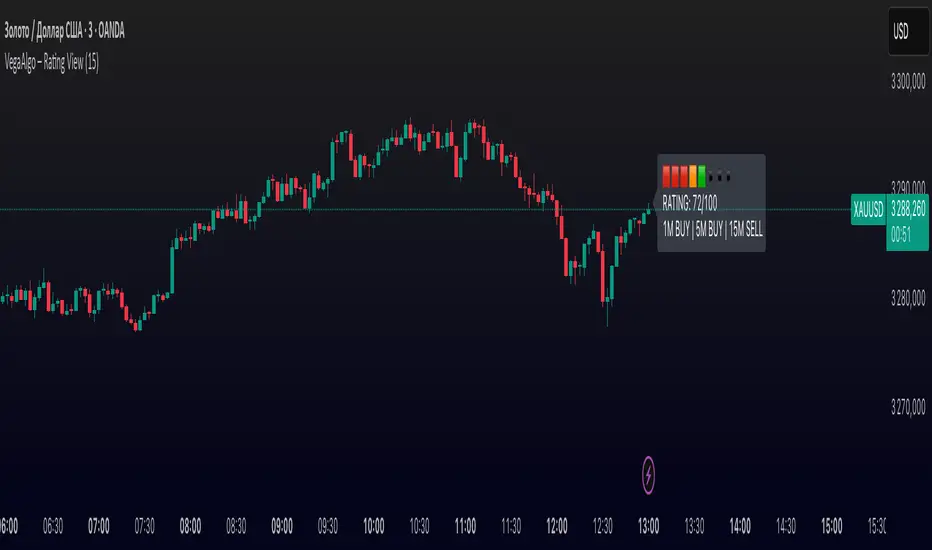
VegaAlgo – Rating ViewVegaAlgo – Rating View is a market condition analysis tool designed to evaluate the current price structure.
The indicator calculates a RATING (from 0 to 100) that reflects how clean, directional, and structured the recent price movement is. The rating is based on the number of price direction changes (from bullish to bearish candles and vice versa) within a selected period. Fewer direction changes indicate a clearer trend and result in a higher rating, while a choppy or highly volatile market leads to a lower score.
Additionally, the indicator provides directional signals on three key timeframes — 1M, 5M, and 15M, using a comparison of fast and slow moving averages. This allows traders to quickly assess the dominant trend both locally and across higher timeframes.
This script is intended for visual market analysis only and should not be considered financial advice.
JIYANS RDRBThis script is based on the ICT (Inner Circle Trader) Redelivered concepts, specifically focusing on the Rebalance principle. It automatically identifies price imbalances (Fair Value Gaps) and highlights potential rebalance zones where the market is likely to revisit before continuing its delivery. The tool helps traders spot key inefficiencies and anticipate where price may return to mitigate those gaps. Fully customizable for different timeframes, this script is designed to support precision trading aligned with ICT methodologies.

FVG NQ - Clean Version# FVG NQ - Clean Version | גרסה נקייה
## 🇮🇱 תיאור בעברית
### מה זה האינדיקטור?
האינדיקטור מזהה **Fair Value Gaps (FVG)** בגרף דקה ומספק אותות מסחר מדוייקים עם ניהול סיכונים אוטומטי. האינדיקטור מתמחה במסחר בשעות הפתיחה של השוק האמריקאי (8:30-11:30).
### איך זה עובד?
**זיהוי FVG:**
- מחפש "פערים" בין שלושה נרות רצופים בגרף דקה
- בוליש FVG: כשה-High של נר 1 נמוך מה-Low של נר 3
- בריש FVG: כשה-Low של נר 1 גבוה מה-High של נר 3
**לוגיקת פערי פתיחה מחודדת:**
- ` `: יש פער פתיחה והנר ממשיך בכיוון הנכון ✅
- ` `: יש פער פתיחה אבל הנר לא ממשיך בכיוון ⚠️
- רגיל: FVG ללא פער פתיחה
### תכונות מרכזיות:
🎯 **ניהול סיכונים אוטומטי**: חישוב TP/SL לפי גודל ה-FVG או סיכון קבוע
📊 **יחסי סיכון/רווח**: 1:1, 1:2, 1:3
🕐 **מסחר בזמן מוגדר**: רק בין 8:30-11:30
🛡️ **הגנות בטיחות**: מקסימום 5 עסקאות ביום (מעל 2 ריסקי יותר)
📈 **סטטיסטיקות בזמן אמת**: Win Rate, P&L יומי וכללי
🎨 **ויזואליזציה ברורה**: צבעי רקע, קווי Entry/TP/SL, תוויות
### הגדרות:
- **ניהול סיכונים**: אוטומטי (לפי גודל FVG) או קבוע
- **יחס סיכון:רווח**: 1:1, 1:2, 1:3
- **מקסימום עסקאות ביום**: 1-5 (מעל 2 = ריסקי יותר)
- **גודל FVG מינימלי**: 2.0 נקודות (ניתן לשינוי)
### מתאים למי?
- סוחרי Futures NQ/ES
- מסחר בשעות הפתיחה האמריקאית
- מי שמחפש אותות איכותיים עם ניהול סיכונים
---
## 🇺🇸 English Description
### What is this Indicator?
This indicator identifies **Fair Value Gaps (FVG)** on the 1-minute chart and provides precise trading signals with automated risk management. The indicator specializes in trading during US market opening hours (8:30-11:30 AM EST).
### How does it work?
**FVG Detection:**
- Searches for "gaps" between three consecutive candles on 1-minute chart
- Bullish FVG: When candle 1 High is below candle 3 Low
- Bearish FVG: When candle 1 Low is above candle 3 High
**Refined Gap Opening Logic:**
- ` `: Opening gap exists and candle continues in correct direction ✅
- ` `: Opening gap exists but candle doesn't continue direction ⚠️
- Regular: FVG without opening gap
### Key Features:
🎯 **Automated Risk Management**: TP/SL calculation based on FVG size or fixed risk
📊 **Risk/Reward Ratios**: 1:1, 1:2, 1:3
🕐 **Time-Based Trading**: Only between 8:30-11:30 AM EST
🛡️ **Safety Protections**: Maximum 5 trades per day (above 2 is riskier)
📈 **Real-Time Statistics**: Win Rate, Daily & Total P&L
🎨 **Clear Visualization**: Background colors, Entry/TP/SL lines, labels
### Settings:
- **Risk Management**: Automatic (based on FVG size) or Fixed
- **Risk:Reward Ratio**: 1:1, 1:2, 1:3
- **Max Trades Per Day**: 1-5 (above 2 = riskier)
- **Minimum FVG Size**: 2.0 points (adjustable)
### Suitable For:
- NQ/ES Futures traders
- US market opening hours trading
- Traders seeking quality signals with risk management
---
## 📋 Trading Rules
1. **Entry**: When price touches FVG boundary
2. **Stop Loss**: Below/Above FVG + 1 point buffer (Auto mode)
3. **Take Profit**: Based on selected Risk:Reward ratio
4. **Daily Limit**: Stops after max trades reached or SL hit
5. **Time Filter**: Only active during 8:30-11:30 AM EST
## ⚠️ Risk Warning
- Futures trading involves substantial risk of loss
- Past performance doesn't guarantee future results
- Use proper position sizing
- Trading above 2 trades per day increases risk exposure
## 🎨 Visual Elements
- **Yellow Background**: Searching for FVG
- **Blue Background**: Pre-entry setup ready
- **Orange Background**: Currently in trade
- **Red Background**: Failed trade - no more entries today
- **Statistics Table**: Real-time performance metrics
---
*This indicator is designed for educational purposes. Always do your own research and consider your risk tolerance before trading.*

ADR Custom Anchor n %sAverage daily range.
Advantages on this indicator:
1 - you can select how many days to make the average, this is important on cryptos, because there's 24h/7d of negotiation
2 - select where to anchor, because central banks uses NY 17h candle close on parities to hedge (as know to remove sunday bar)
3 - new levels to get you new reversals spots

Boxed EMA + Volume PanelBoxed EMA - where Numbers show the price distance from each EMA.
RVOL
VOL percentage + contraction
Average 50 day volume
todays volume

Close Above Prev High / Below Prev LowIdentifies candles that close above the previous candle's high (bullish) and candles that close below the previous candle's low (bearish). Helps with decisions for entry and exit.

Mariam 5m Scalping Breakout StrategyPurpose
A 5-minute scalping breakout strategy designed to capture fast 3-5 pip moves with high probability, using premium/discount zone filters and market bias conditions. Developed for traders seeking consistent scalps with a proven win rate above 95–98% in optimal conditions.
How It Works
The script monitors price action in 5-minute intervals, forming a 15-minute high and low range by tracking the highs and lows of the first 3 consecutive 5-minute candles starting from a custom time. In the next 3 candles, it waits for a breakout above the 15m high or below the 15m low while confirming market bias using custom equilibrium zones.
Buy signals trigger when price breaks the 15m high while in a discount zone
Sell signals trigger when price breaks the 15m low while in a premium zone
The strategy simulates trades with fixed 3-5 pip take profit and stop loss values (configurable). All trades are recorded in a table with live trade results and an automatically updated win rate, typically achieving over 90–95% accuracy in favorable market conditions.
Features
Designed exclusively for the 5-minute timeframe
Custom 15-minute high/low breakout logic
Premium, Discount, and Equilibrium zone display
Built-in backtest tracker with live trade results, statistics, and win rate
Customizable start time, take profit, and stop loss settings
Real-time alerts on breakout signals
Visual markers for trade entries and failed trades
Consistent win rate exceeding 90–95% on average when following market conditions
Usage Tips
Use strictly on 5-minute charts for accurate signal performance. Avoid during high-impact news releases.
Important: Once a trade is opened, manually set your take profit at +3 to +5 pips immediately to secure the move, as these quick scalps often hit the target within a single candle. This prevents missed exits during rapid price action.

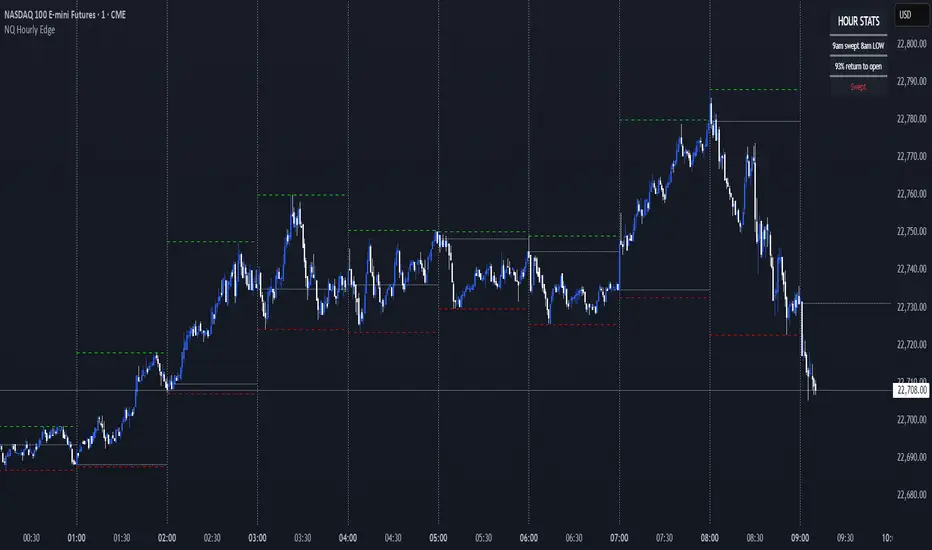
NQ Hourly Edge (By Scalpr)📊 Hourly Edge (Lorden) - Statistical Trading Edge Indicator
Transform your NQ1! trading with data-driven hourly analysis and high-probability setups based on extensive backtesting.
🎯 What This Indicator Does
The Hourly Edge indicator identifies high-probability "return to open" scenarios during the New York trading session (8am-4pm ET) specifically for NQ1! (Nasdaq futures). When the current hour opens inside the previous hour's range and then sweeps the previous high or low, statistical data shows strong probabilities of price returning to the hourly open.
📈 Key Features
Statistical Edge Detection
Real-time sweep detection with tick-by-tick accuracy
Probability percentages based on extensive NQ1! backtesting data
Color-coded probability levels: Green (75%+), Yellow (51-74%), Red (<50%)
Status tracking: Waiting → Swept → Returned
Visual Trading Tools
Hourly/Custom interval lines with full customization
High/Low tracking with optional current hour hiding
Opening price reference lines
Configurable line styles, colors, and widths
Smart Session Management
NY timezone awareness (8am-4pm ET focus)
"Waiting for 8am" display outside trading hours
20-minute segment analysis for refined probability calculations
🔧 Customization Options
Timeframe Flexibility
Multiple preset intervals: 4H, 1H, 30m, 15m, 10m, 5m
Custom timeframe input (hours + minutes)
Works on any chart timeframe
Display Controls
Show/hide any line type independently
Moveable info box (4 corner positions)
Adjustable text sizes
Historical line limit (1-500 bars)
Line Styling
Individual color settings for each line type
Style options: Solid, Dashed, Dotted
Width control: 1, 2, or 3 pixels
📊 How to Use
Add to NQ1! charts during NY session hours
Watch for sweep notifications in the info box
Check probability percentages for trade confidence
Monitor return status for entry/exit timing
Use alerts for high-probability setups (75%+ edge)
⚡ Best Practices
Optimal timeframes: 1m-15m for entries, 1H for context
Focus on 75%+ probability setups for highest edge
Wait for "moved away from open" confirmation before expecting returns
Combine with your existing NQ1! strategy for enhanced timing
🎯 Perfect For
NQ1! scalpers seeking high-probability entries
Nasdaq day traders wanting statistical edge confirmation
Futures strategy developers incorporating hourly analysis
Risk managers looking for data-driven NQ1! setups
FAWAZ CAPITAL Multi-Confluence Scalping SystemFOLLOW THE INDICATOR
Free to use for now
Fawaz Capital

DaringBull Arvind MACD GAPS MA CrossoverTo generate buy and sell signals based on a combination of MACD crossover events and histogram behavior, particularly around the zero line. This is used to identify early momentum reversals for entry and exit points in the market.
📐 MACD Setup
Uses customizable MACD parameters (defaults: Fast = 12, Slow = 26, Signal = 9).
Calculates:
MACD Line
Signal Line
Histogram (difference between MACD and Signal)
✅ Buy Conditions
A buy signal is plotted when all three of the following occur:
MACD Line crosses above Signal Line (bullish crossover).
MACD Line is still below or near the zero line (< 0.05) – indicates early reversal from a bearish zone.
First green histogram bar appears (current bar is > 0 and previous was ≤ 0) – confirming momentum shift.
➡️ When these align, a blue circle is plotted below the price bar.
❌ Sell Conditions
A sell signal is plotted when all three of the following occur:
MACD Line crosses below Signal Line (bearish crossover).
MACD Line is still above or near the zero line (> -0.05) – indicates early weakness after a bullish move.
First red histogram bar appears (current bar is < 0 and previous was ≥ 0) – confirming loss of momentum.
➡️ When these align, a red circle is plotted above the price bar.
📊 Visualization
Buy/Sell markers appear on the price chart for visual entry/exit cues.
MACD line, Signal line, and Zero line are optionally plotted for deeper analysis.
📌 Key Insights
This script aims to enter trades early in trend reversals by using MACD in conjunction with histogram shifts near the zero line.
It's especially useful in gap trading, mean reversion, or breakout confirmation setups.
The optional plot toggle allows switching between overlay and non-overlay views.

Altcoins + ETH (brez stablecoinov) / BTCWhen chart hits cca 0.3 of value it's sign the beginning ALT season.

Bollinger Bandwidth TrendflowThe Bollinger Bandwidth Trendflow is an experimental regime detection tool that analyzes the width of Bollinger Bands and combines it with the Adaptive Trend Flow (ATF), developed by QuantAlgo. The ATF has been integrated into this script exactly as originally published — all credit goes to QuantAlgo for this powerful contribution.
Features:
- Utilizes Bollinger Bandwidth (BBW) to assess volatility-driven momentum
- Adaptive Trend Flow (ATF) provides dynamic regime detection based on historical volatility
- Orange zones indicate trending phases
- Purple zones highlight mean-reverting environments
- Clean subpane plots for BBW and ATF, each toggleable and fully color-customizable
This indicator is particularly useful for traders looking to distinguish between explosive market moves and quiet consolidation — perfect for breakout or reversion-style setups.
I recommend using this script on the TOTAL CRYPTO Market Cap (1D) chart. The default settings represent the best values I could find quickly — feel free to tweak and explore them as you like.

[Mad]Triple Bollinger Bands ForecastTriple Bollinger Bands Forecast (BBx3+F)
This open-source indicator is an advanced version of the classic Bollinger Bands, designed to provide a more comprehensive and forward-looking view of market volatility and potential price levels.
It plots three distinct sets of Bollinger Bands and projects them into the future based on statistical calculations.
How It Is Built and Key Features
Triple Bollinger Bands: Instead of a single set of bands, this indicator plots three. All three share the same central basis line (a Simple Moving Average), but each has a different standard deviation multiplier. This creates three distinct volatility zones for analyzing price deviation from its mean.
Multi-Timeframe (MTF) Capability: The indicator can calculate and display Bollinger Bands from a higher timeframe (e.g., showing daily bands on a 4-hour chart). This allows for contextualizing price action within the volatility structure of a more significant trend.
(Lower HTF selection will result in script-crash!)
Future Forecasting: This is the indicator's main feature. It projects the calculated Bollinger Bands up to 8 bars into the future. This forecast is a recalculation of the Simple Moving Average and Standard Deviation based on a projected future source price.
Selectable Forecast Methods: The mathematical model for estimating the future source price can be selected:
Flat: A model that uses the most recent closing price as the price for all future bars in the calculation window.
Linreg (Linear Regression): A model that calculates a linear regression trend on the last few bars and projects it forward to estimate the future source price.
Efficient Drawing with Polylines: The future projections are drawn on the chart using Pine Script's polyline object. This is an efficient method that draws the forecast data only on the last bar, which avoids repainting issues.
Differences from a Classical Bollinger Bands Indicator
Band Count: A classical indicator shows one set of bands. This indicator plots three sets for a multi-layered view of volatility.
Perspective: Classical Bollinger Bands are purely historical. This indicator is both historical and forward-looking .
Forecasting: The classic version has no forecasting capability. This indicator projects the bands into the future .
Timeframe: The classic version works only on the current timeframe. This indicator has full Multi-Timeframe (MTF) support .
The Mathematics Behind the Future Predictions
The core challenge in forecasting Bollinger Bands is that a future band value depends on future prices, which are unknown. This indicator solves this by simulating a future price series. Here is the step-by-step logic:
Forecast the Source Price for the Next Bar
First, the indicator estimates what the price will be on the next bar.
Flat Method: The forecasted price is the current bar's closing price.
Price_forecast = close
Linreg Method: A linear regression is calculated on the last few bars and extrapolated one step forward.
Price_forecast = ta.linreg(close, linreglen, 1)
Calculate the Future SMA (Basis)
To calculate the Simple Moving Average for the next bar, a new data window is simulated. This window includes the new forecasted price and drops the oldest historical price. For a 1-bar forecast, the calculation is:
SMA_future = (Price_forecast + close + close + ... + close ) / length
Calculate the Future Standard Deviation
Similarly, the standard deviation for the next bar is calculated over this same simulated window of prices, using the new SMA_future as its mean.
// 1. Calculate the sum of squared differences from the new mean
d_f = Price_forecast - SMA_future
d_0 = close - SMA_future
// ... and so on for the rest of the window's prices
SumOfSquares = (d_f)^2 + (d_0)^2 + ... + (d_length-2)^2
// 2. Calculate future variance and then the standard deviation
Var_future = SumOfSquares / length
StDev_future = sqrt(Var_future)
Extending the Forecast (2 to 8 Bars)
For forecasts further into the future (e.g., 2 bars), the script uses the same single Price_forecast for all future steps in the calculation. For a 2-bar forecast, the simulated window effectively contains the forecasted price twice, while dropping the two oldest historical prices. This provides a statistically-grounded projection of where the Bollinger Bands are likely to form.
Usage as a Forecast Extension
This indicator's functionality is designed to be modular. It can be used in conjunction with as example Mad Triple Bollinger Bands MTF script to separate the rendering of historical data from the forward-looking forecast.
Configuration for Combined Use:
Add both the Mad Triple Bollinger Bands MTF and this Triple Bollinger Bands Forecast indicator to your chart.
Open the Settings for this indicator (BBx3+F).
In the 'General Settings' tab, disable the Activate Plotting option.
To ensure data consistency, the Bollinger Length, Multipliers, and Higher Timeframe settings should be identical across both indicators.
This configuration prevents the rendering of duplicate historical bands. The Mad Triple Bollinger Bands MTF script will be responsible for visualizing the historical and current bands, while this script will overlay only the forward-projected polyline data.
