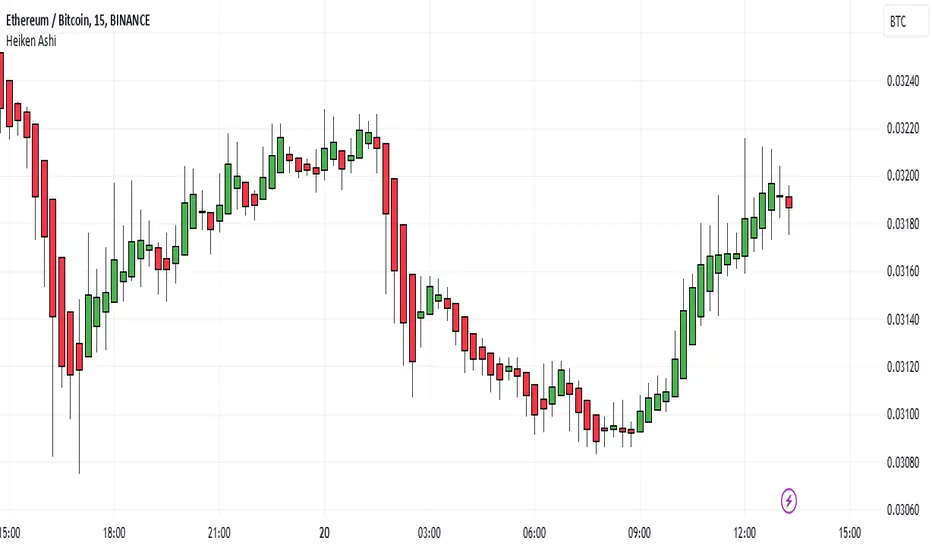
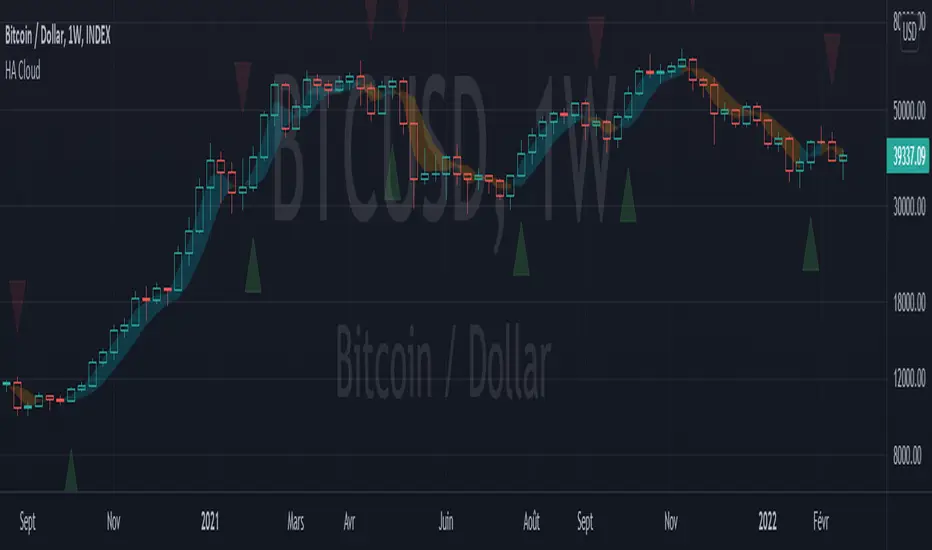
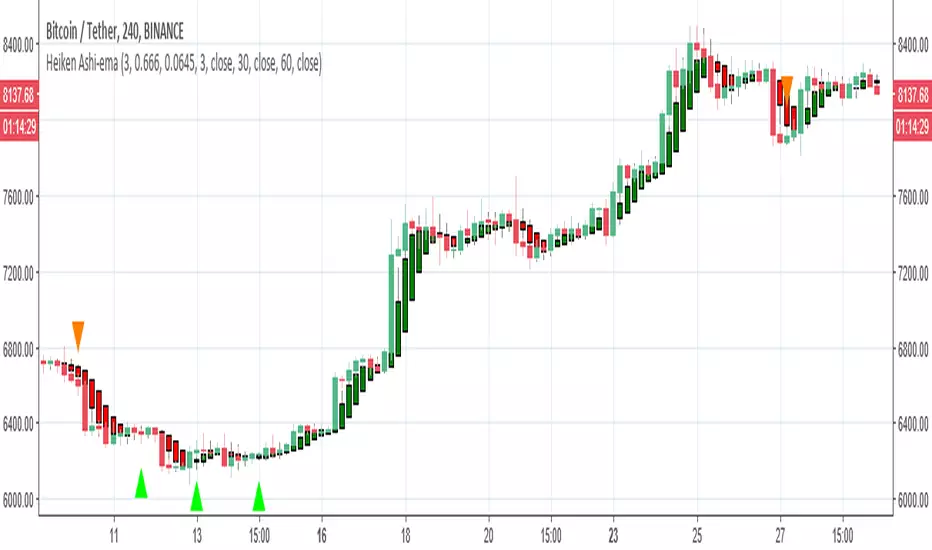
Heikin Ashi Cloud overlayThis script displays a cloud representing the bodies of Heikin Ashi candles, which allows to have all the information of the HA technique without losing focus on the classical candles.
Also has arrows to indicate a trend reversal (counterproductive in a range !)
Heiken
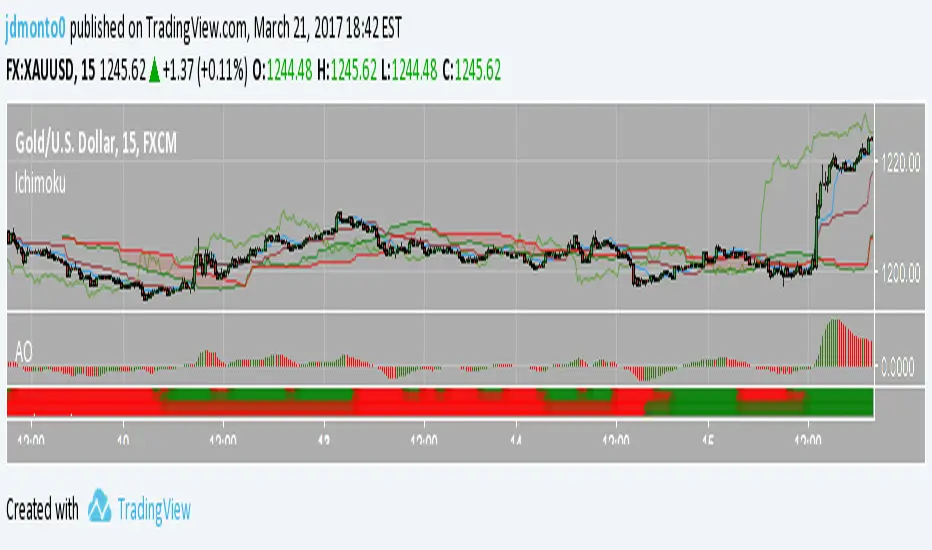
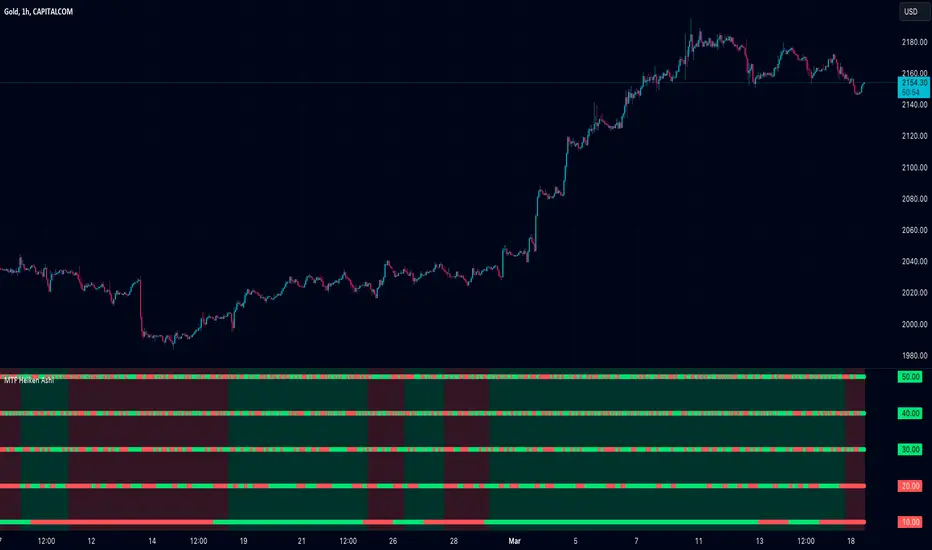
MTF Heiken Ashi (No Repaint)Hi there. This indicator is inspired by Heiken Ashi MTF (by @jdmonto0).
The problem with that indicator was that it repaints and I tried to solve that.
I figured that the reason the other version repaints was because the heiken ashio calculation is based on the close of the candle, and since the higher timeframe candle hasn't closed yet, the value of previous candles on a lower timeframe can change.
This version bases the calculation on the previous bar, which solves the repainting problem.
Please tell me what you think about it.
Heikin Ashi Candle OverlayHello Friend,
This is a very simple script for fun to demonstrate the new ability to change the colors of attributes pertaining to the plotbar() and plotcandle() functions using series inputs.
For Heiken Ashi lovers, this script does several things. It gives you both bars and hollow candles with Heikin Ashi values - something TV does not currently support.
It also gives you the ability to see your favorite HA candles while on the main series plot. When viewing indicators in the "Heikin Ashi" candle setting on TradingView, the input values are "smoothed' with HA values. This skews the way your indicators behave as the OLHC are calculated averages. Only the regular candle settings will give your indicators "real close" etc.
By 'Muting' the main series bars by toggling the 👁 symbol next to your ticker id, it makes the normal candles invisible. You then overlay this script, which allows you to see the HA Candle of your choice, while not affecting the way your indicators behave.
You now have the best of 2 worlds. Smoothed behavior of price action to help visualize trends, and accurate indicator values derived from actual OLHC data.
Plus, something about hollow HA candles is just kind of clean and soothing isn't it?
Cheers,
Bjorgum
Hollow Setting:
Bars
Or just plain old regular, but on the main chart

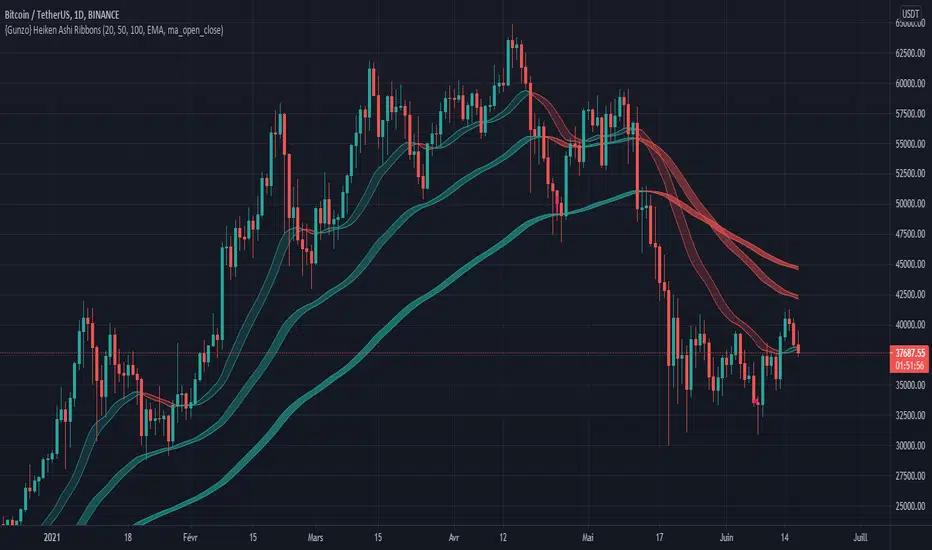
{Gunzo} Heiken Ashi RibbonsHeiken Ashi Ribbons is a trend-following indicator which gives entry and exit points for short-term, medium-term and long term trading (using Exponential Moving Averages and Heiken Ashi formulas).
OVERVIEW :
The Heiken Ashi Ribbons indicator is composed of 3 moving average ribbons (slow, normal and fast) that are computed using the Heiken Ashi formulas. The 3 ribbons give a clear vision of the current trend as they use moving averages that smooth out the price and filter noise from short term fluctuations. In a simplified way, you can consider each ribbon as a moving average with a larger body size.
If the price is above the slow ribbon, we consider the asset as trending up in the short term (trending down otherwise). If the price is above the fast ribbon, we consider the asset as trending up in the long term (trending down otherwise).
CALCULATION :
First of all, to compute a ribbon for this indicator we calculate a moving average (EMA by default) for common sources (OHLC) :
EMA (open), EMA (high), EMA (low), EMA (close)
We then apply the Heiken Ashi formulas to the moving averages calculated previously.
HA (open) = HA (open) previous + HA (close) previous
HA (close) = ( EMA (open) + EMA (high) + EMA (low) + EMA (close) ) / 4
HA (high) = max( EMA (open), EMA (close), EMA (high) )
HA (low) = min ( EMA (open), EMA (close), EMA (low) )
The ribbon displayed (by default) on the chart is the area between HA (open) and HA (close).
SETTINGS :
1st Moving average length : Length of the slow moving average
2nd Moving average length : Length of the normal moving average
3rd Moving average length : Length of the fast moving average
Moving average method : Moving average calculation method (EMA : Exponential Moving Average, SMA : Simple Moving Average, WMA : Weighted Moving Average)
Ribbon type : standard ribbon uses the area between HA (open) and HA (close). Large ribbon uses the area between HA (low) and HA (high)
Display ribbon as candles : change the type of visualization between area and candles
Display short term buy/sell signals : Display short term buy/sell signals (crosses) when the fast moving average and normal moving average are crossing
Display long term buy/sell signals : Display long buy/sell signals (circles) when the fast moving average and slow moving average are crossing
Display ribbon trending up signals : Display ribbon direction change (triangle up) when the trend of the ribbon changes to trending up
Display ribbon trending down signals : Display ribbon direction change (triangle down) when the trend of the ribbon changes to trending down
VISUALIZATIONS :
This indicator has 2 possible visualizations :
Ribbons : the ribbons can be considered as enhanced moving averages for trading purposes. They represent the area between the Heiken Ashi of the moving average of the open and closing price. The color of the moving average line is green when the ribbon is trending up and red when the ribbon is trending down.
Signals : Various signals can be displayed at the bottom of the chart (Buy/Sell signals, Ribbon direction changes signals).
USAGE :
This indicator can be used in many strategies, just like when you are using multiple moving averages. You should test these strategies and use the one that best fits your trading style.
Strategy based on crossovers :
When the fast ribbon crosses above the normal ribbon, it is a short term buy signal (it is recommended to wait for a confirmation)
When the fast ribbon crosses under the normal ribbon, it is a short term sell signal (it is recommended to wait for a confirmation)
When the fast ribbon crosses above the slow ribbon, it is a long term buy signal
When the fast ribbon crosses over the slow ribbon, it is a long term buy signal
Strategy based on price position :
When the prices closes above the ribbon, it is a buy signal (long term if above slow ribbon, short term if above fast ribbon)
When the prices closes below the ribbon, it is a sell signal (long term if below slow ribbon, short term if below fast ribbon)
Strategy based on price bouncing :
When the price decreases and reaches the green long term ribbon, the price candles may not be able to cross the ribbon. If the price increases, we consider that move as a bounce on the ribbon, which is a buy signal
When the price increases and reaches a red long term ribbon, the price candles may not be able to cross the ribbon. If the price decreases, we consider that move as a bounce on the ribbon, which is a sell signal
Strategy based on ribbon direction :
When the direction of the ribbon changes, the trend of the asset is changing which may lead to a crossover to the next candles if the trend is continuing in that direction (it is recommended to validate the entry points with a second indicator as this strategy may have some false signals).
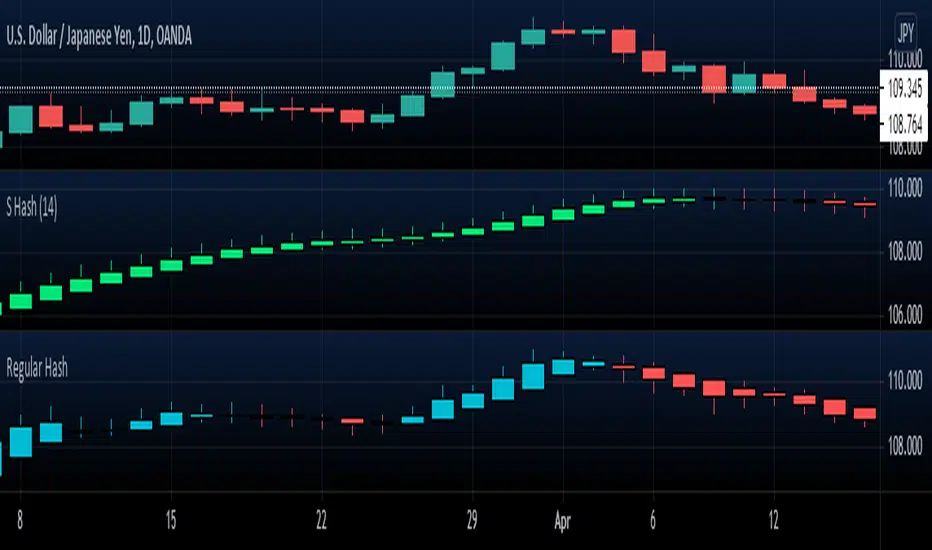
Smoothed Heiken AshiHeiken Ashi with price values smoothed via 14-EMA .
On the example chart you can compare it to a regular Hash using blue for upward trends
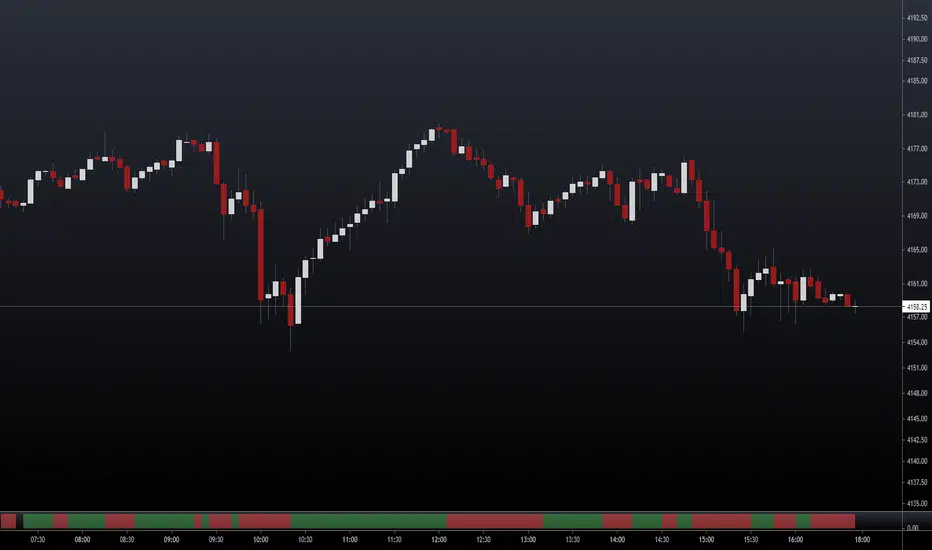
NSDT Heiken-Ashi Direction Bar MTFA simple script that places a bar at the bottom of the chart to indicate the direction of Heiken-Ashi candles - while still using traditional candles on the main chart. Try setting the bar on a higher timeframe to see the overall direction of the trend, while using traditional candles for entries/exits.
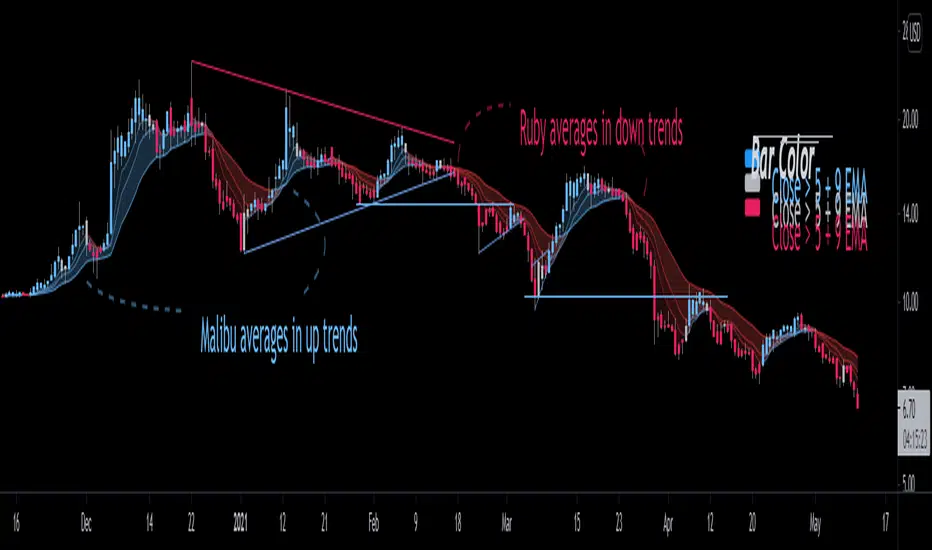
Bjorgum EMAThis is an answer back to repeated requests for a simple version of Bjorgum Triple EMA Strat, which is not recommended for use with Heiken Ashi candles as it results in "double smoothing" of the averages and can give late signals as a result.
The inputs are raw and super basic. At its core its really just 3 EMAs that you can customize the source and length. The averages and shadowing change color based on if they are either rising or falling.
default values are 5, 9, and 21 EMA on open as source.
Bar color is dictated by the bar close over or under the 5 and 9 EMA.
This is suitable for use on HA candle.
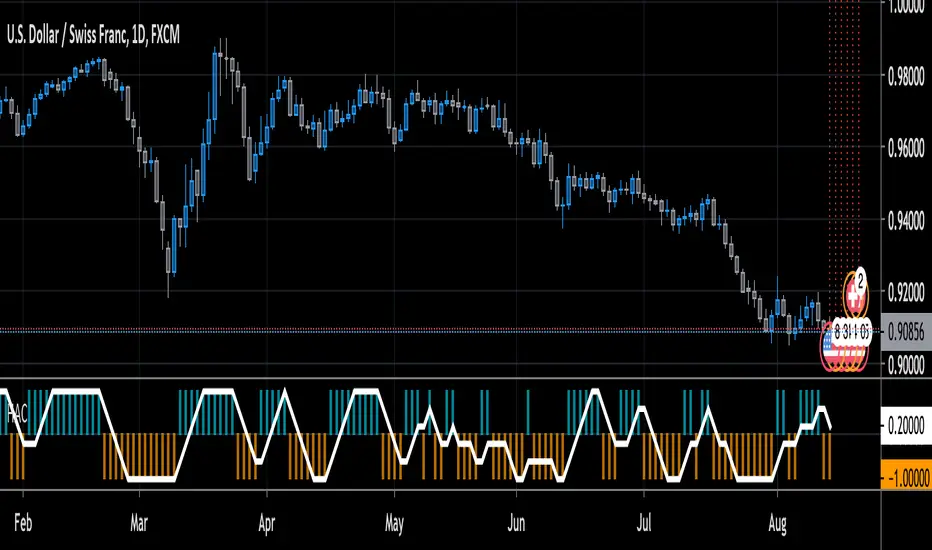
Heiken-Ashi Color Vts// Simple as it says:
// gives you the color of the Heiken Ashi candles in a separate panel.
// I needed this indicator since in TV switching from HA to normal candles resets the chart and I had to go back manually.
// This solves the nasty issue.
// Moreover, nobody enters/exits the trade on the HA values but everyone uses just their color, right?
// Since bearish candles are encoded with value -1 and bullish candles with +1,
// a simple average can be defined (if you don't find it useful, disable it).
// Vitelot-Yanez-Vts, Aug 2020
//
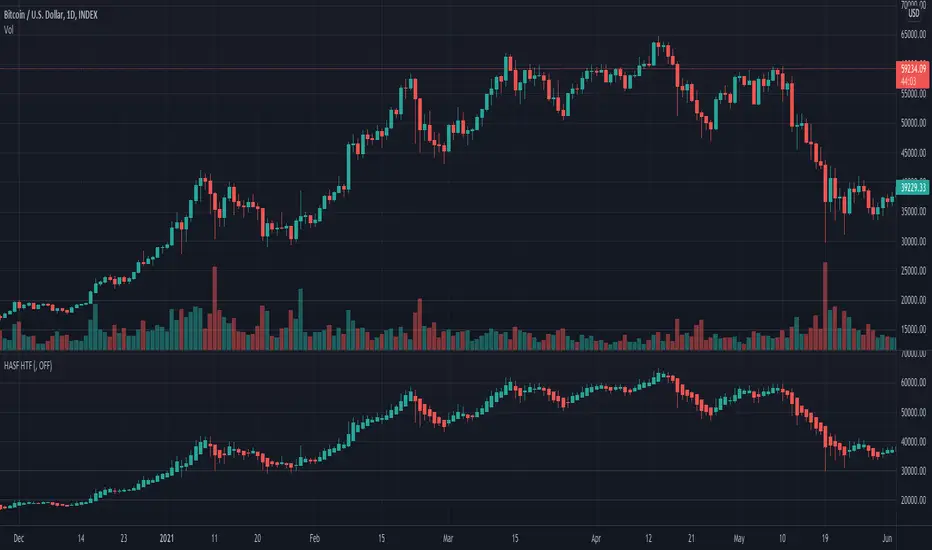
Heikin-Ashi Source Function HTFHigher TimeFrame using custom source function for toggling traditional Candle sources or Heikin-Ashi sources on a traditional Candles chart.
Thanks to PineCoders for rounding method: www.pinecoders.com
Thanks to @LucF and @RicardoSantos for their advice and enlightenment as always.
NOTICE: This is an example script and not meant to be used as an actual strategy. By using this script or any portion thereof, you acknowledge that you have read and understood that this is for research purposes only and I am not responsible for any financial losses you may incur by using this script!
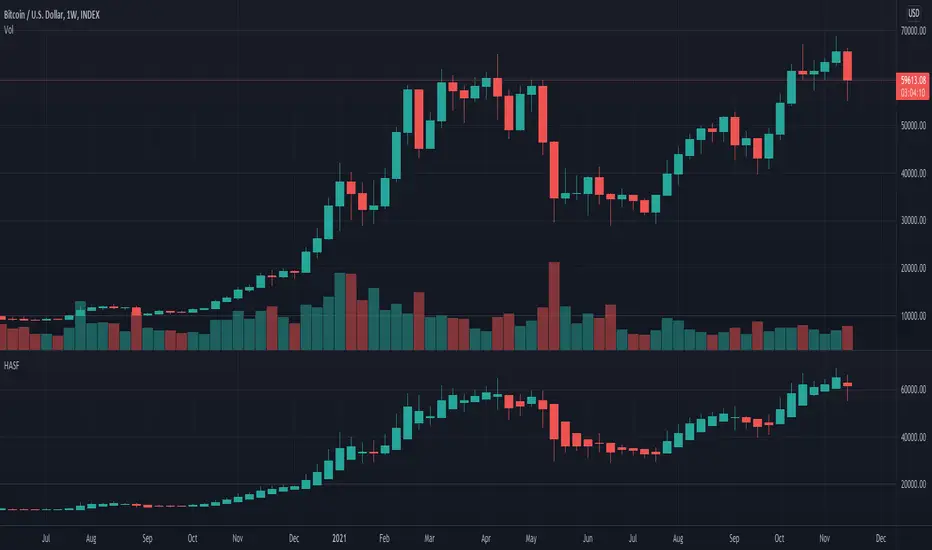
Heikin-Ashi Source FunctionCustom source function for toggling traditional Candle sources or Heikin-Ashi sources on a traditional Candles chart.
Thanks to PineCoders for rounding method: www.pinecoders.com
Thanks to @LucF and @RicardoSantos for their advice and enlightenment as always.
NOTICE: This is an example script and not meant to be used as an actual strategy. By using this script or any portion thereof, you acknowledge that you have read and understood that this is for research purposes only and I am not responsible for any financial losses you may incur by using this script!
BERLIN CandlesA problem with Heikin Ashi is that while it gives you a great overview of overall direction, it is rarely possible to use it as a replacement for normal japanese
candlesticks. The reason for this is that actual price data is lost, since the candles are more akin to a moving average than a different way to see price action. Also, with Heikin Ashi, most of the actual price action is lost, because the candles can be bigger than the high and low of the underlying japanese candlestick.
With BERLIN Candles I have tried to fix that problem. By using a smoothed out version of the previous Heikin Ashi candle close as the current BERLIN Candle open, the high and low of the actual japanese candlestick for the high and low of the BERLIN Candle, and the current Heikin Ashi close as the BERLIN Candle close, while setting hard limits for BERLIN Candle open and close values so that they can never exceed the high and low of the underlying japanese candlestick.
One problem still persists though. The actual current price data is lost. However, the BERLIN Candles have solved this by adding a fifth part to the candles. The close of the underlying japanese candlesticks are indicated with a plus-sign. This way, actual price data is never lost, while keeping all of the other benefits of this type of candles.
A few added bonuses:
The addition of the 14 period ATR at the latest candle
The baseline from Ichimoku is included as an option
The 14 period ATR value of each candle can be seen in the indicator data as
the orange value

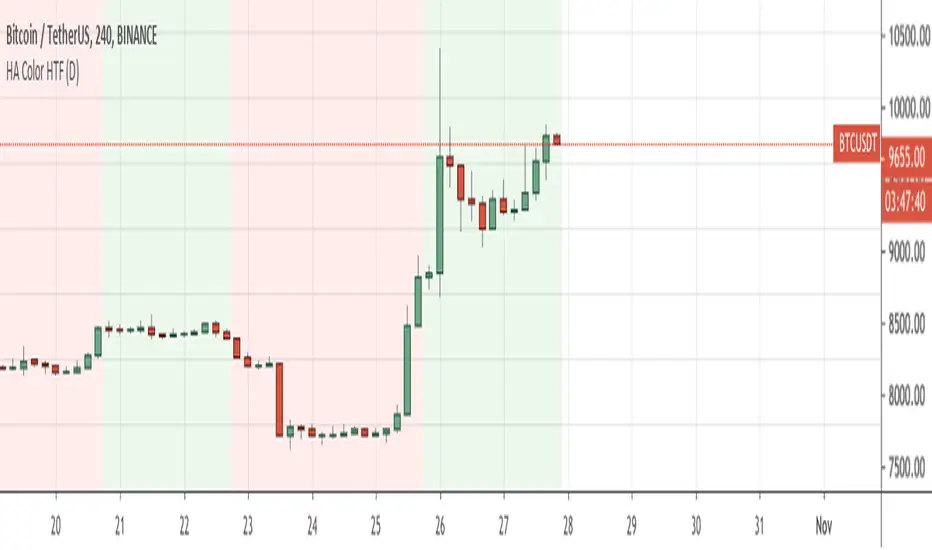
QuantNomad - Heikin Ashi Colors Higher TimeframeSimple script displaying color of Heiken Ashi candles from higher timeframes as a background.

[RESEARCH] Heikin-Ashi Chart IdentifierA deterministic approach to identify Heikin-Ashi chart type.
The script checks the next statements about HA:
HA chart does not have any gaps in a classic sense
Every new HA open price is calculated using a specific recurrence formula. This fact also means that initial HA open price is used to calculate all the next and so on (a construction of Infinite Impulse Response filters)
The script works correctly being applied to other chart types:
Classic Candlestick
Range Bars
Line Break
Traditional Renko
ATR Renko
Traditional Point-and-Figure
ATR Point-and-Figure
Kagi
For special ones: this code allows you to check whether your script is being executed with Heikin-Ashi candles or not inside your script.
Ev sistr 'ta Laou!

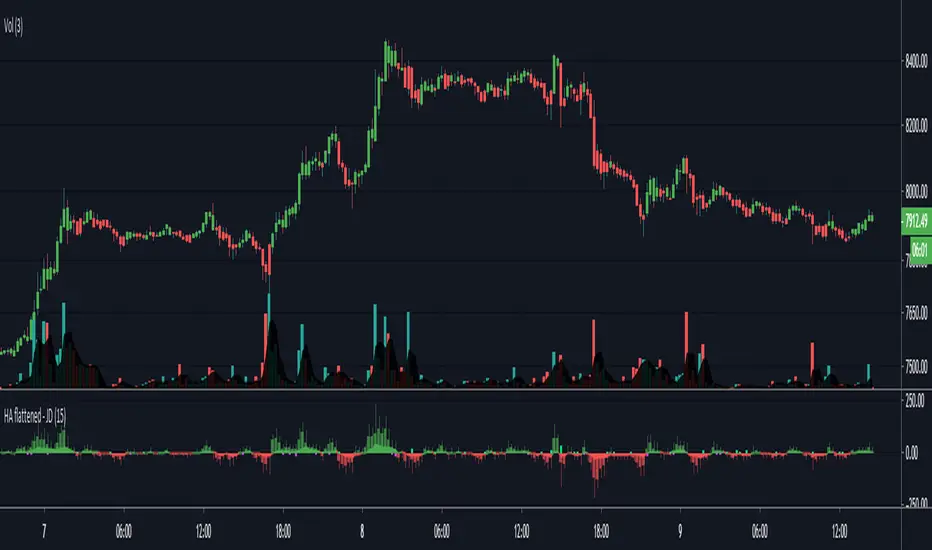
HA flattened - JDThis script gives you an opportunity to see the trend and price impulse information cointained in Heiken Ashi bars
whithout having to sacrifice seeing the raw price action of normal candles or other styles of charts.
I flattened out the HA bars to a straight line so it is easier to see if the candles momentum is picking up of fading
There is a Multi Time Frame option to show Heiken Ashi candles on another Time Frame.
There is the option to color the bars on the chart with the HA information (I use a 3 bar ma the further smooth out the info)
A last option is to add signals when the HA bars have wicks on the wrong side (down wicks on "up" candles an up wicks on "down" candles)
those can indicate price momentum staring to change into possible reversals or pull-backs soon.
JD.
#NotTradingAdvice
#DYOR
I build these indicators for myself and provide them open source, to use for free to use and improve upon,
as I believe the best way to learn is toghether.
IO_Heikin-Ashi OverlayThis is Traditional Heikin-Ashi bars overlayed with regular candlestick/any chart type
Although HA is available in TradingView by default, this script is to recalculate HA by traditional calculations.
This version REPAINTS!! This is because Traditional HA uses Close Price (which is calculated on the fly).
-- Invsto

Heiken-Ashi Direction Bias BlocksThis script adds red/green blocks to the top of every chart that show the current daily Heiken Ashi candle colour, so even when you're on a 1h or 4h chart you can quickly see if the current day is bullish or bearish. The higher timeframe is customisable too, so if you prefer to use weekly HA values, then now's your time to shine.
Useful for quickly going through charts without having to load the daily HA chart each time.

Kozlod - Heikin-Ashi Bar Color Change AlertsYou can use this script to setup alerts on Heikin-Ashi bar color change.
You have to apply this script to usual candles and not Heikin-Ashi!!!
Background color indicates HA bar color. On change you'll see green/red arrows and alert will be fired.
Also you can find in the code calculations of all HA OHLC values.

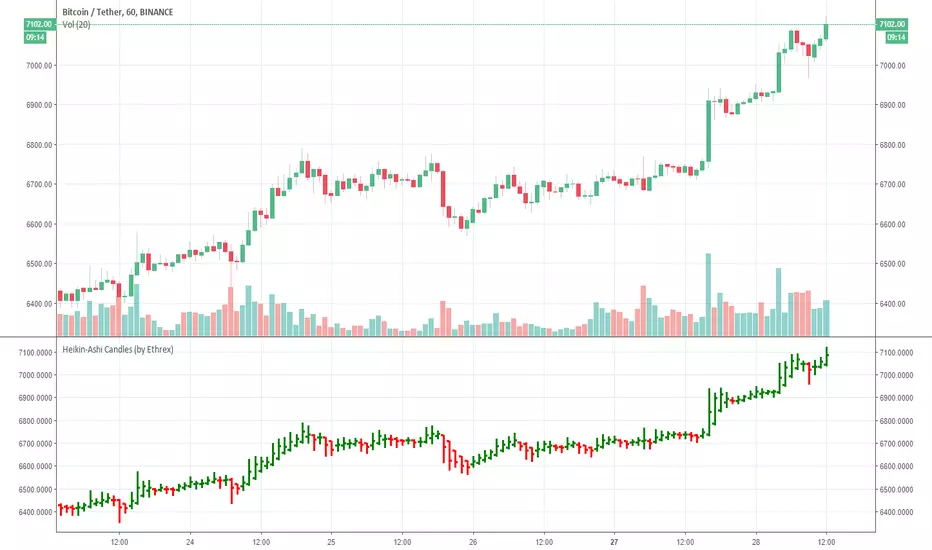
Heikin-Ashi Candles (by Ethrex)Allows to see how Heikin-Ashi candles are computed and see the bars side-by-side with normal prices.
Heiken Ashi Pivot Blue Candle over Regular CandlesThis mixes Heiken-Ashi with regular candles by adding blue candle to regular candles. A blue candle appears anywhere that you are going from red Heiken-Ashi to green Heiken-Ashi. Also, black candles appear anywhere that you are going from green Heiken-Ashi to red Heiken-Ashi.

Heiken Ashi Candles
This is a script to place Heiken Ashi candles on your chart alongside another candle type or more importantly, using the variables from this script, you can build a strategy using Heiken Ashi candles that will depict true/proper entries and exits in a strategy when using the backtest feature.
We hope this helps!