Annualized Spot-Future DifferenceThe "Annualized Spot-Future Difference" indicator (ASFD) compares the closing prices of a futures contract and its underlying spot asset. It calculates the price difference between the two instruments and annualizes this difference to provide a standardized measure for comparison.
The indicator takes inputs for the futures ticker symbol and the spot ticker symbol, allowing flexibility in selecting the specific assets for analysis. Additionally, it allows the user to input the contract date, which represents the expiration date of the futures contract.
The ASFD indicator plots the annualized difference between the futures and spot prices. It calculates the price difference by subtracting the spot price from the futures price. To annualize this difference, it considers the remaining days to the contract expiration and scales the difference accordingly.
The annualized difference can provide insights into market expectations, as it reflects the market's perception of the future price movement of the underlying asset. A positive value indicates that the futures price is higher than the spot price, potentially suggesting bullish sentiment. Conversely, a negative value suggests bearish sentiment, with the futures price lower than the spot price.
Traders and analysts can utilize the ASFD indicator to identify potential opportunities for arbitrage or evaluate market sentiment regarding the underlying asset. By monitoring changes in the annualized difference over time, they can gain insights into market dynamics and make informed trading decisions.
It's important to note that the ASFD indicator relies on accurate and up-to-date pricing data for both the futures and spot assets. Traders should verify that the selected ticker symbols correspond to the desired instruments and ensure that the contract date aligns with the relevant futures contract expiration.
Overall, the ASFD indicator provides a quantitative measure of the annualized price difference between futures and spot assets, enabling traders and analysts to assess market expectations and identify potential trading opportunities.
Pine utilities

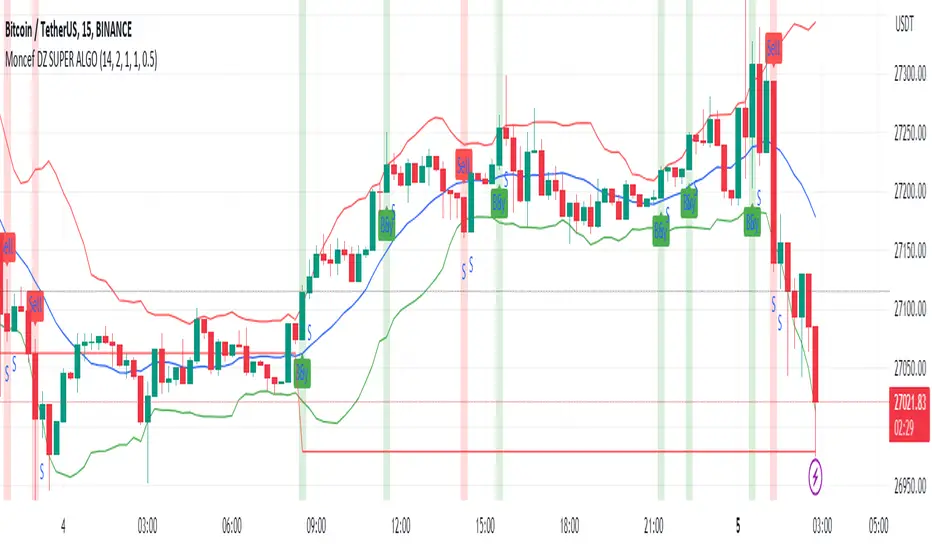
DZ SR Buy&Sell Enhanced StrategyThis ALGERIAN indicator titled "SR Buy&Sell with Enhanced Strategy" is designed to identify support and resistance levels on a financial chart, and generates enhanced buy and sell signals based on these levels. It is based on a trading strategy that uses a combination of moving means and standard deviation to calculate support and resistance levels.
The indicator plots support and resistance levels on the chart, with blue color for base level, red for resistance and green for support. Green arrows are displayed when a buy signal is generated, and red arrows when a sell signal is generated.
The market entry strategy is based on breaking support and resistance levels. When a buy signal is generated and no position is opened, a buy position is opened with a take profit and stop loss level calculated according to the parameters set by the user. Similarly, when a sell signal is generated and no position is opened, a sell position is opened with the corresponding take profit and stop loss levels.
The indicator also displays a “STOP” indicator when a position exit signal is generated, indicating to the trader that it is time to close the current position.
This indicator is a powerful tool for traders who want to exploit support and resistance levels to improve their trading decisions. It can be used in different financial markets and different time periods. Parameters such as average moving length, deviations and multiplier can be adjusted according to individual trader preferences.
Note: This indicator only provides potential signals and does not guarantee positive results with every trade. It is recommended to use this indicator in combination with other technical analysis and risk management tools to make informed decisions when trading.
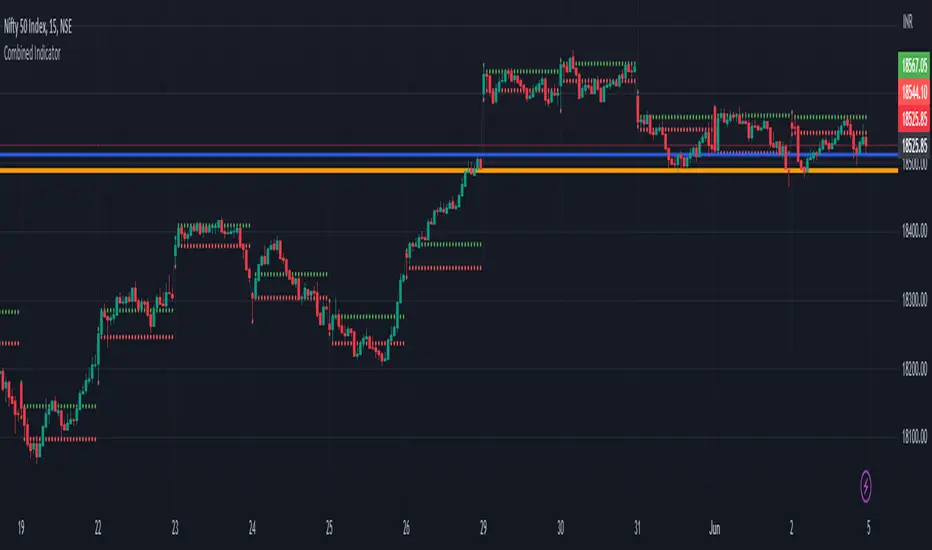
Previous Day Close and Average VWAP value, Current Day 30 min HLThe code provided is a TradingView Pine Script that creates a combined indicator consisting of two separate components:
Indicator 1: Plot Lines with VWAP
This component plots lines on the chart using two different colors and widths.
It uses a custom function f_newLine to create a new line object with a specified color and width.
It uses another custom function f_moveLine to move a line to a specific location on the chart.
The line_close line is moved to a specific date and closing price.
The line_vwap line represents the VWAP (Volume Weighted Average Price) and is plotted using the line.new function.
The VWAP calculation is performed using the typical price (average of high, low, and close) and volume.
The VWAP is plotted on the chart using the plot function.
The previous day's VWAP is also plotted and connected to the current day's VWAP with a line.
Indicator 2: 30 Min high and low breakout
This component identifies a specific time range ("0915-0945") within each trading day.
It uses the ta.valuewhen function to find the highest and lowest prices during that time range.
The highest price is stored in the high_thirtymin variable, and the lowest price is stored in the low_thirtymin variable.
These prices are plotted on the chart as circles, with green representing the high and red representing the low.
The indicator combines these two components to provide visual information about the VWAP and the high/low breakout within a specific time range. The code also includes some additional logic to handle barstate and ensure correct calculations and plotting.
Period Candle CounterThis is a very simple utility indicator.
Shockingly nothing similar was available and I really needed something to quickly count period lengths by candles (to make adjustments to indicators based on a desired lookback timeframe), so I created this.
I thought I would share it because chances are if I needed something like this, other people may need it, too.
What it does:
Its really simple and this really truly is just a utility indicator that gives you raw information to make adjustments to other indicators. It just counts the number of candles in a user defined period of time.
It will count the number of red candles, green candles and then display the total candle count.
It will also display in percent (i.e. 52% green candles vs 48% red candles, etc.).
Its point and click, so once launched you just click the area you want to start the count and click the area you want to end the count.
Purpose:
Personally, I use it to make adjustments to timeframe lengths on indicators that look at averages and also on my time series indicator. If I want the price average or range for a specific period in time (say, the past 1.5 days of an uptrend), I will use this to count the candles in that period so that I can manually adjust whichever indicator to the correct lookback length, as most indicators are adjusted by candle length (i.e. 1 candle, 2 candles, 3 candles, etc.)
And that's it, pretty straight forward. Honestly pretty boring but its actually really pivotal for me to make adjustments to certain indicators.
Hope you find it helpful, too!
Safe trades!

XAUXXXThis simple script is meant to get around the limitations some data providers have, in terms of the length of historical data they choose to provide traders. Inspired by OANDA's XAUCAD pair only having data as far back as 2005, whereas XAUUSD has data back to to the 19th century.
By taking the OHLC data from XAUUSD and multiplying it by the price of USD in a desired currency you are able to see further back in time, the limitation now being the length of FX data available instead of the price of Precious metal / currency pair. As shown in the chart you can now see the price of Gold in CAD as far back as the late 1960s, a nearly half century of data uncovered for all to see!

Monthly Strategy Performance TableWhat Is This?
This script code adds a Monthly Strategy Performance Table to your Pine Script strategy scripts so you can see a month-by-month and year-by-year breakdown of your P&L as a percentage of your account balance.
The table is based on realized equity rather than open equity, so it only updates the metrics when a trade is closed.
That's why some numbers will not match the Strategy Tester metrics (such as max drawdown), as the Strategy Tester bases metrics like max drawdown on open trade equity and not realized equity (closed trades).
The script is still a work-in-progress, so make sure to read the disclaimer below. But I think it's ready to release the code for others to play around with.
How To Use It
The script code includes one of my strategies as an example strategy. You need to replace my strategy code with your own. To do that just copy the source code below into a blank script, delete lines 11 -> 60 and paste your strategy code in there instead of mine. The script should work with most systems, but make sure to read the disclaimer below.
It works best with a significant amount of historical data, so it may not work very effectively on intraday timeframes as there is a severe limitation of available bars on TradingView. I recommend using it on 4HR timeframes and above, as anything less will produce very little usable data. Having a premium TradingView plan will also help boost the number of available bars.
You can hover your mouse over a table cell to get more information in the form of tooltips (such as the Long and Short win rate if you hover over your total return cell).
Credit
The code in this script is based on open-source code originally written by QuantNomad, I've made significant changes and additions to the original script but all credit for the idea and especially the display table code goes to them - I just built on top of it:
Why Did I Make This?
None of this is trading or investment advice, just my personal opinion based on my experience as a trader and systems developer these past 6+ years:
The TradingView Strategy Tester is severely limited in some important ways. And unless you use complex Excel formulas on exported test data, you can't see a granular perspective of your system's historical performance.
There is much more to creating profitable and tradeable systems than developing a strategy with a good win rate and a good return with a reasonable drawdown.
Some additional questions we need to ask ourselves are:
What did the system's worst drawdown look like?
How long did it last?
How often do drawdowns occur, and how quickly are they typically recovered?
How often do we have a break-even or losing month or year?
What is our expected compounded annual growth rate, and how does that growth rate compare to our max drawdown?
And many more questions that are too long to list and take a lifetime of trading experience to answer.
Without answering these kinds of questions, we run the risk of developing systems that look good on paper, but when it comes to live trading, we are uncomfortable or incapable of enduring the system's granular characteristics.
This Monthly Performance Table script code is intended to help bridge some of that gap with the Strategy Tester's limited default performance data.
Disclaimer
I've done my best to ensure the numbers this code outputs are accurate, and according to my testing with my personal strategy scripts it appears to work fine. But there is always a good chance I've missed something, or that this code will not work with your particular system.
The majority of my TradingView systems are extremely simple single-target systems that operate on a closed-candle basis to minimize many of the data reliability issues with the Strategy Tester, so I was unable to do much testing with multiple targets and pyramiding etc.
I've included a Debug option in the script that will display important data and information on a label each time a trade is closed. I recommend using the Debug option to confirm that the numbers you see in the table are accurate and match what your strategy is actually doing.
Always do your own due diligence, verify all claims as best you can, and never take anyone's word for anything.
Take care, and best of luck with your trading :)
Kind regards,
Matt.
PS. If you're interested in learning how this script works, I have a free hour-long video lesson breaking down the source code - just check out the links below this script or in my profile.

Lot Size CalculatorThis is a public release of my Lot Size Calculator. I received a request for the code from a user so I am republishing the script so I can make it public (TV doesn't seem to give me the option to simply make it public once published ).
This is a very simple script to use. Simply choose your entry level and stop level on the chart and the indicator will calculate the lots. You can change your account risk and base currency units in the settings along with changing the scaling of the calculation to adjust the results with the lot sizing units of your broker. This allows the calculator to be used with CFDs, forex, Gold, etc.. Hope it helps in your trading it has been the single most useful tool in my trading as it has helped me always keep my risk locked up and on point that is why I released it.
One final quick note: Remember you can save your settings for your own account size and risk so you do not always have to modify the defaults when loading the script. Just a ease of use tip. I only add the script to my chart when I am about to take a trade so it is helpful to have everything set up in advance.

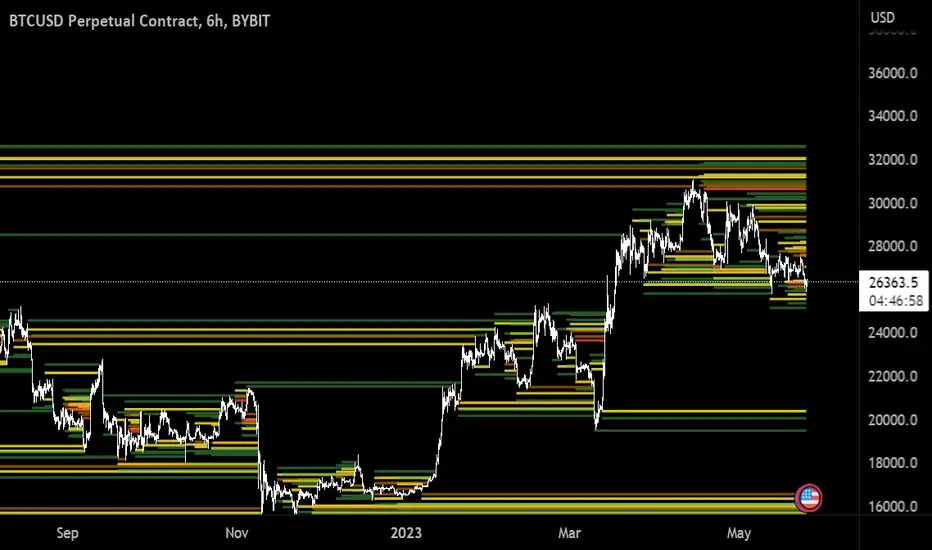
[Mad] Liquidation LevelsThe Liquidation Lines Technical Indicator is a trading tool designed to assist traders in identifying potential liquidation levels. This indicator generates virtual positions, known as "liquidation lines", which mark the points at which these positions would be liquidated under specified conditions.
Key Features:
Quantity of Lines: The indicator can create up to 125 liquidation lines, evenly distributed between long and short positions. This limit is derived from a maximum of 500 lines, divided by four to account for two types of leverage (long and short).
Customizable Liquidation Levels: Users are given the ability to set liquidation levels according to their individual trading strategies and the current market conditions.
Customizable Visuals: The color and thickness of the liquidation lines can be adjusted to suit personal preferences, providing a clear visual representation on the trading chart for ease of analysis.
Selectable Signal Sources: The indicator provides the flexibility to choose the signal source for creating the liquidation lines. Users can select from a range of popular technical analysis tools such as Bollinger Bands, MACD crosses, EMA crosses, or SMA crosses. This feature allows traders to customize the formation of liquidation lines based on their preferred technical indicators, adding to the comprehensiveness and versatility of the tool.
Two selectable Leverages: The indicator accommodates both long and short leverages, offering a comprehensive understanding of potential liquidation points for various trading scenarios.
Selectable Exchange Maintenance: The indicator allows users to select their specific cryptocurrency exchange. This feature ensures that the liquidation lines are accurately calculated according to the maintenance margin requirements of the chosen exchange, adding precision and customization to the trading analysis.
Textmate Language for Pine Script v5 2023-05Updated Syntax Colouring to include UDT and methods and libraries, and a few other extras.
Remember to Update when new built in language features are introduced.
This will not be Maintained frequently, it's an update to present times

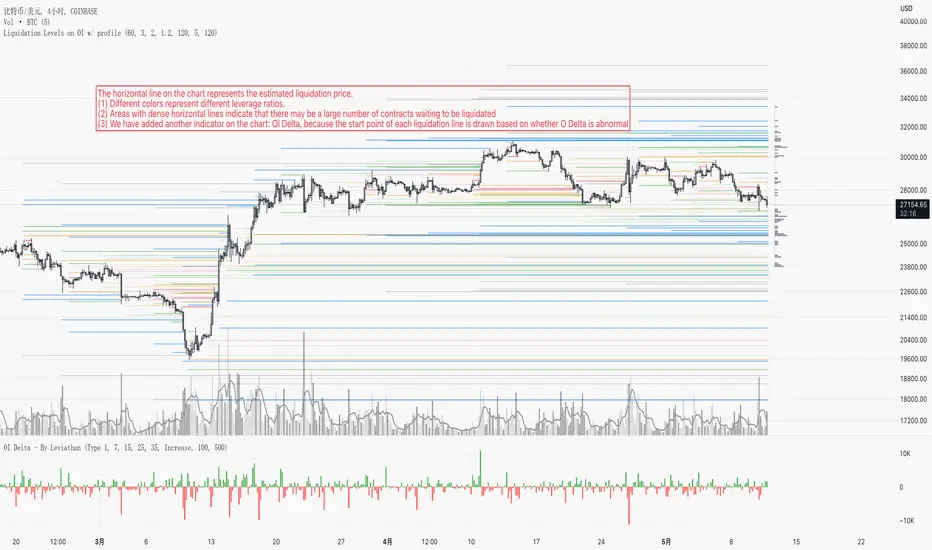
Liquidation Levels on OIThis indicator is used to display estimated contract liquidation prices. When there are dense liquidation areas on the chart, it indicates that there may be a lot of liquidity at that price level. The horizontal lines of different colors on the chart represent different leverage ratios. See below for details.
Let me introduce the principle behind this indicator:
1. When position trading volume increases or decreases significantly higher than usual levels in a specific candlestick chart, it indicates that a large number of contracts were opened during that period. We use the 60-day moving average change as a benchmark line. If the position trading volume changes more than 1.2x, 2x or 3x its MA60 value, it is considered small, medium or large abnormal increase or decrease.
2. This indicator takes an approximate average between high, open, low and close prices of that candlestick as opening price.
3. Since contracts involve liquidity provided by both buyers and sellers with equal amounts of long and short positions corresponding to each contract respectively; since we cannot determine actual settlement prices for contract positions; therefore this indicator estimates settlement prices instead which marks five times (5x), ten times (10x), twenty-five times (25x), fifty times (50x) and one hundred times (100x) long/short settlement prices corresponding to each candlestick chart generating liquidation lines with different colors representing different leverage levels.
4. We can view areas where dense liquidation lines appear as potential liquidation zones which will have high liquidity.
5. We can adjust orders based on predicted liquidation areas because most patterns in these areas will be quickly broken.
6. We provide a density histogram to display the liquidation density of each price range.
Special thanks to the following TradingView community members for providing open-source indicators and contributing to the development of this indicator!
Liquidation - @Mysterysauce
Open Interest Delta - By Leviathan - @LeviathanCapital
Regarding the relationship with the above-mentioned open source indicators:
1. Indicator Liquidation - @Mysterysauce can also draw a liquidation line in the chart, but:
(1) Our indicator generates a liquidation line based on abnormal changes in open interest; their indicator generates a liquidation line based on trading volume.
(2) Our indicator will generate both long and short liquidation lines at the same time; their indicator will only generate a liquidation line in a single direction.
We refer to their method of drawing liquidation lines when drawing our own.
2. Indicator Open Interest Delta - By Leviathan - @LeviathanCapital obtained OI data for Binance USDT perpetual contracts in the code. We refer to their method of obtaining OI data in our code.
============= 中文版本 =============
此指标用于显示估计合约清算价格。当图表上有密集的清算区域时,表示该价格水平可能存在大量流动性。图表上不同颜色的水平线代表不同杠杆比率。详情请参见下面的说明。
让我介绍一下这个指标背后的原理:
1. 当特定蜡烛图对应的合约仓位增加量(OI Delta)显著高于通常水平时,表示在那段时间有大量合约开仓。我们使用OI Delta的60日移动均线作为基准线。如果OI Delta超过其MA60值的1.2倍、2倍或3倍,则认为是小型、中型或大型的异常OI Delta。
2. 该指标将上述蜡烛图高、开、低和收盘价的平均值作为近似的合约开仓价。
3. 由于合约涉及买方和卖方之间相互提供流动性,每个合约对应相等数量的多头和空头头寸。由于我们无法确定合约头寸的实际清算价格,因此该指标估计了清算价格。它标记了与该蜡烛图相对应的多头和空头5倍、10倍、25倍、50倍和100倍的清算价格,生成清算线。不同杠杆水平用不同颜色表示。
4. 我们可以将出现密集清算线的区域视为潜在的清算区域。这些区域将具有高流动性。
5. 我们可以根据预测到的清算区域调整自己的订单,因为根据规律,这些清算区域大部分都会很快被击穿。
6. 我们提供了密度直方图来显示每个价格范围的清算密度
特别感谢以下TradingView社区成员提供开源指标并为该指标的开发做出贡献!
Liquidation - @Mysterysauce
Open Interest Delta - By Leviathan - @LeviathanCapital
与上述开源指标的关系:
1. 指标Liquidation - @Mysterysauce也可以在图中绘制清算线,但是:
(1)我们的指标是基于open interest的异常变化生成的清算线;他们的指标是基于成交量生成的清算线
(2)我们的指标会同时生成多头和空头清算线;他们的指标仅会在单一方向生成清算线
我们的指标在绘制清算线上参考了他们绘制清算线的方式
2. 指标Open Interest Delta - By Leviathan - @LeviathanCapital在代码中获取了Binance USDT永续合约的OI数据。我们在代码中参考他们获取OI数据的方式
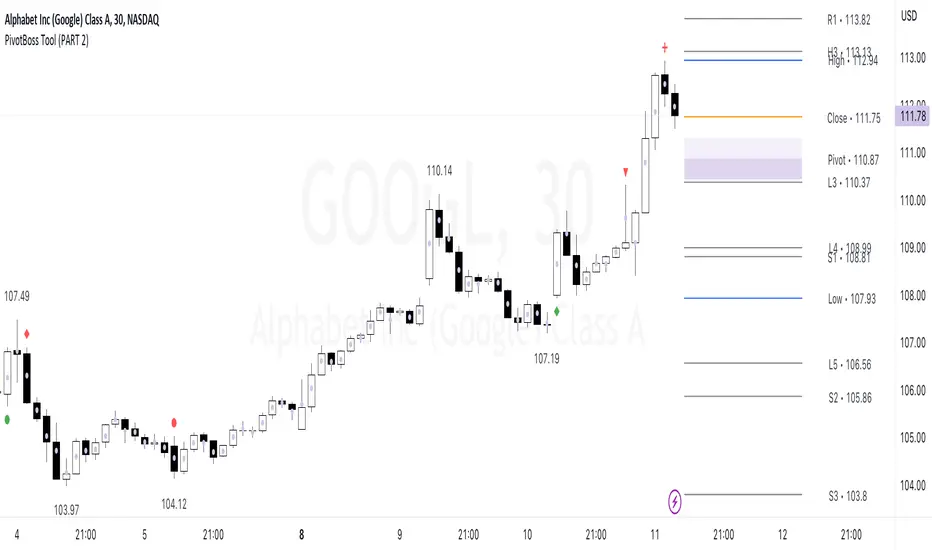
PivotBoss Tool (PART 2)Hello Everyone,
This indicator is being published on TradingView to help traders solve their multiframe EOD analysis issue and at the same time get additional information of other crucial information - CandleStick Patterns, Candlestick Midpoint and ATR Trails for trailing your SL's all under one single frame.
This indicator is based on the concepts of Secrets of Pivot Boss by Mr.Frank Ochoa and strives to provide more insightful information of pivot points and other general indicators being used by traders on day-to-day basis in the simplest format possible so that traders of all kinds can relate to the same.
And, this is purely dedicated to EOD analysis.
What is the moat of this Indicator?
This particular indicator is designed to help the traders in their EOD analysis as this indicator is well equipped to provide the next session trading pivot points well in advance at the end of the current day trading session. A trader has everything required for an EOD analysis in this particular indicator.
Below is the brief information of the indicator table you see in the layout of the above chart -
#Next Session Pivots
One can plot this feature to find out the developing pivot levels for upcoming D/W/M/Q/Y alongside it's additional pivot levels such as:
- Future Camarilla Pivots (H3/H4/H5 & L3/L4/L5)
- Future Floor Pivots (R1/R2/R3 & S1/S2/S3)
- Future CPR levels (TC/PIVOT/BC)
#Developing Pivot Cloud
One can check the developing CPR in Intraday itself by enabling the pivot cloud feature which can tell you multiple information to be with the trend and it's participants.
Basically a live extension of the current trading CPR according with the progress of the trading day.
#CandleStick Mid-Point
This can plot the midpoint of each candlestick on any timeframe for better understanding of buyer/seller's absorption!
#Candlestick Pattern Scans
So one can now easily filter out the candlesticks patterns which helps in decoding the chart in a better format for entry and exits. There are 4 candlesticks patterns included -
- Wick Reversal Pattern -
This pattern basically tells the wick strength which is actually a liquidity absorption by the stronger hand and the intensity and further direction of the move depends on the position of wick candle being formed indicated by green (bull) or red (bear) signal.
- Doji Reversal Pattern -
This pattern basically is used to identify the biasness of the market participants and further identifies a pause in the ongoing trend or a pause for the trend to get further liquidity for broader strength.
- Outside Reversal Pattern -
This pattern depicts the range of the previous candle of a specific timeframe has been tested at both the extreme and probably the price will consolidate in the that visible range for a while.
- Extreme Reversal Pattern -
This pattern basically points at a setup that looks for an extreme pattern of selling pressure and then looks to fade this behavior to capture a bullish move higher (reverse for shorts) and vice versa .
#ATR Trails
This a just a supertrend indicator sourced with ATR to track a short/long term trend change and can be used for trailing SL's when they are kept tight for big positions!
#CPR Trails
This is the most interesting feature with multiple permutations & combinations and can be used to analyse intraday as well as EOD and positional trends. Moreover, THIS FEATURE CAN ALSO INDENTIFY MICRO INTRADAY TREND AS SMALL AS EACH 5M TREND!!
This indicator will be updated with time and depending on community's feedback and requirements.
Credits -
- Mr. Frank Ochoa (Concepts and ideas from the book 'Secrets of PivotBoss' )
- TradingView (Providing a platform to traders to simply their trading through 'PineScript')
Regards,
Mukkull
Open Interest OffsetThis indicator is used to display whether there has been an abnormal increase or decrease in recent contract positions. Its usage is similar to the RSI indicator.
Please note that this indicator uses fixed (customizable) thresholds of 0.4 and 0.6 to indicate when abnormal opening and closing occur respectively. For some altcoins, their values may far exceed 0.4 so please adjust accordingly based on your symbol.
(1) When there is an abnormal increase in recent contract positions, the value of the indicator will be above 0.4. This means that there may be a liquidation market situation occurring subsequently. If the market background at this time is rising, it may not be suitable to continue buying because the indicator shows that it is currently overbought. On the contrary, it may be appropriate to sell now.
(2) When there is an abnormal decrease in recent contract positions, the value of the indicator will be below -0.4. This means that a liquidation market situation has occurred recently. If the market background at this time is falling, it may not be suitable to continue shorting because the indicator shows that it is currently oversold. On the contrary, it may be appropriate to buy now.
Special thanks to the following TradingView community members for providing open-source indicators and contributing to the development of this indicator!
Open Interest Delta - By Leviathan - @LeviathanCapital
Regarding the relationship with the above-mentioned open source indicator:
Indicator Open Interest Delta - By Leviathan - @LeviathanCapital obtained OI data for Binance USDT perpetual contracts in the code. We refer to their method of obtaining OI data in our code.
============= 中文版本 =============
该指标用于显示近期合约持仓量是否有异常的增加和减少。它的用法类似于RSI指标
请注意,该指标使用了固定的(可定制的)阈值0.4和0.6来提示异常开仓和平仓的发生。对于某些山寨币而言,指标的数值可能远大于0.4。请根据你所关注的标的自行调整
(1)当近期合约持仓量有异常的增加时,指标的值会在0.4以上。这意味着后续可能有清算行情的发生。若此时市场背景为上涨,此时可能不太适合继续做多,因为指标显示目前处于超买行情。相反,现在可能适合卖出
(2)当近期合约的持仓量有异常的减少时,指标的值会在-0.4以下。这意味着近期已经发生了清算行情。若此时市场背景为下跌,此时可能不太适合继续做空,因为指标显示目前处于超卖行情。相反,现在可能适合买入
特别感谢以下TradingView社区成员提供开源指标并为该指标的开发做出贡献!
Open Interest Delta - By Leviathan - @LeviathanCapital
与上述开源指标的关系:
指标Open Interest Delta - By Leviathan - @LeviathanCapital在代码中获取了Binance USDT永续合约的OI数据。我们在代码中参考他们获取OI数据的方式

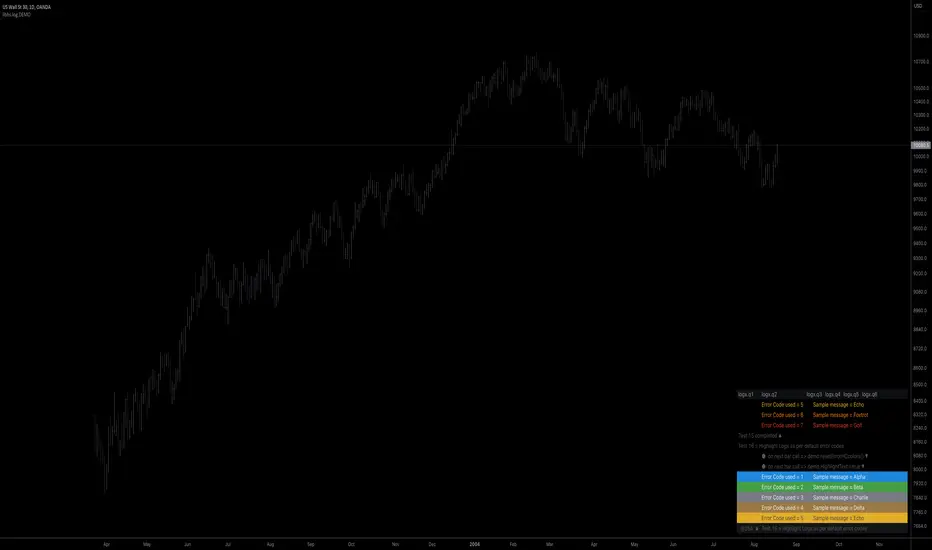
libhs.log.DEMO◼ Overview
This is a demonstration of dual logging library I have ported from my personal use for public use. Please start bar replay from Bar#4, and progress automatically slowly or manually.You would need to go through 450+ bars to see the full capability.
Logger=A dual logging library for developers. Tradingview lacks logging capability. This library provided logging while developing your scripts and is to be used by developers when developing and debugging their scripts.
Using this library would potentially slow down you scripts. Hence, use this for debugging only. Once your code is as you would like it to be, remove the logging code.
◼︎ Usage (Console):
Console = A sleek single cell logging with a limit of 4096 characters. When you dont need a large logging capability.
//@version=5
indicator("demo.Console", overlay=true)
plot(na)
import GETpacman/log/2 as logger
var console = logger.log.new()
console.init() // init() should be called as first line after variable declaration
console.FrameColor:=color.green
console.log(' ')
console.log(' ')
console.log('Hello World')
console.log(' ')
console.log(' ')
console.ShowStatusBar:=true
console.StatusBarAtBottom:=true
console.FrameColor:=color.blue //settings can be changed anytime before show method is called. Even twice. The last call will set the final value
console.ShowHeader:=false //this wont throw error but is not used for console
console.show(position=position.bottom_right) //this should be the last line of your code, after all methods and settings have been dealt with.
◼︎ Usage (Logx):
Logx = Multiple columns logging with a limit of 4096 characters each message. When you need to log large number of messages.
//@version=5
indicator("demo.Logx", overlay=true)
plot(na)
import GETpacman/log/2 as logger
var logx = logger.log.new()
logx.init() // init() should be called as first line after variable declaration
logx.FrameColor:=color.green
logx.log(' ')
logx.log(' ')
logx.log('Hello World')
logx.log(' ')
logx.log(' ')
logx.ShowStatusBar:=true
logx.StatusBarAtBottom:=true
logx.ShowQ3:=false
logx.ShowQ4:=false
logx.ShowQ5:=false
logx.ShowQ6:=false
logx.FrameColor:=color.olive //settings can be changed anytime before show method is called. Even twice. The last call will set the final value
logx.show(position=position.top_right) //this should be the last line of your code, after all methods and settings have been dealt with.
◼︎ Fields (with default settings)
▶︎ IsConsole = True Log will act as Console if true, otherwise it will act as Logx
▶︎ ShowHeader = True (Log only) Will show a header at top or bottom of logx.
▶︎ HeaderAtTop = True (Log only) Will show the header at the top, or bottom if false, if ShowHeader is true.
▶︎ ShowStatusBar = True Will show a status bar at the bottom
▶︎ StatusBarAtBottom = True Will show the status bar at the bottom, or top if false, if ShowHeader is true.
▶︎ ShowMetaStatus = True Will show the meta info within status bar (Current Bar, characters left in console, Paging On Every Bar, Console dumped data etc)
▶︎ ShowBarIndex = True Logx will show column for Bar Index when the message was logged. Console will add Bar index at the front of logged messages
▶︎ ShowDateTime = True Logx will show column for Date/Time passed with the logged message logged. Console will add Date/Time at the front of logged messages
▶︎ ShowLogLevels = True Logx will show column for Log levels corresponding to error codes. Console will log levels in the status bar
▶︎ ReplaceWithErrorCodes = True (Log only) Logx will show error codes instead of log levels, if ShowLogLevels is switched on
▶︎ RestrictLevelsToKey7 = True Log levels will be restricted to Ley 7 codes - TRACE, DEBUG, INFO, WARNING, ERROR, CRITICAL, FATAL
▶︎ ShowQ1 = True (Log only) Show the column for Q1
▶︎ ShowQ2 = True (Log only) Show the column for Q2
▶︎ ShowQ3 = True (Log only) Show the column for Q3
▶︎ ShowQ4 = True (Log only) Show the column for Q4
▶︎ ShowQ5 = True (Log only) Show the column for Q5
▶︎ ShowQ6 = True (Log only) Show the column for Q6
▶︎ ColorText = True Log/Console will color text as per error codes
▶︎ HighlightText = True Log/Console will highlight text (like denoting) as per error codes
▶︎ AutoMerge = True (Log only) Merge the queues towards the right if there is no data in those queues.
▶︎ PageOnEveryBar = True Clear data from previous bars on each new bar, in conjuction with PageHistory setting.
▶︎ MoveLogUp = True Move log in up direction. Setting to false will push logs down.
▶︎ MarkNewBar = True On each change of bar, add a marker to show the bar has changed
▶︎ PrefixLogLevel = True (Console only) Prefix all messages with the log level corresponding to error code.
▶︎ MinWidth = 40 Set the minimum width needed to be seen. Prevents logx/console shrinking below these number of characters.
▶︎ TabSizeQ1 = 0 If set to more than one, the messages on Q1 or Console messages will indent by this size based on error code (Max 4 used)
▶︎ TabSizeQ2 = 0 If set to more than one, the messages on Q2 will indent by this size based on error code (Max 4 used)
▶︎ TabSizeQ3 = 0 If set to more than one, the messages on Q2 will indent by this size based on error code (Max 4 used)
▶︎ TabSizeQ4 = 0 If set to more than one, the messages on Q2 will indent by this size based on error code (Max 4 used)
▶︎ TabSizeQ5 = 0 If set to more than one, the messages on Q2 will indent by this size based on error code (Max 4 used)
▶︎ TabSizeQ6 = 0 If set to more than one, the messages on Q2 will indent by this size based on error code (Max 4 used)
▶︎ PageHistory = 0 Used with PageOnEveryBar. Determines how many historial pages to keep.
▶︎ HeaderQbarIndex = 'Bar#' (Logx only) The header to show for Bar Index
▶︎ HeaderQdateTime = 'Date' (Logx only) The header to show for Date/Time
▶︎ HeaderQerrorCode = 'eCode' (Logx only) The header to show for Error Codes
▶︎ HeaderQlogLevel = 'State' (Logx only) The header to show for Log Level
▶︎ HeaderQ1 = 'h.Q1' (Logx only) The header to show for Q1
▶︎ HeaderQ2 = 'h.Q2' (Logx only) The header to show for Q2
▶︎ HeaderQ3 = 'h.Q3' (Logx only) The header to show for Q3
▶︎ HeaderQ4 = 'h.Q4' (Logx only) The header to show for Q4
▶︎ HeaderQ5 = 'h.Q5' (Logx only) The header to show for Q5
▶︎ HeaderQ6 = 'h.Q6' (Logx only) The header to show for Q6
▶︎ Status = '' Set the status to this text.
▶︎ HeaderColor Set the color for the header
▶︎ HeaderColorBG Set the background color for the header
▶︎ StatusColor Set the color for the status bar
▶︎ StatusColorBG Set the background color for the status bar
▶︎ TextColor Set the color for the text used without error code or code 0.
▶︎ TextColorBG Set the background color for the text used without error code or code 0.
▶︎ FrameColor Set the color for the frame around Logx/Console
▶︎ FrameSize = 1 Set the size of the frame around Logx/Console
▶︎ CellBorderSize = 0 Set the size of the border around cells.
▶︎ CellBorderColor Set the color for the border around cells within Logx/Console
▶︎ SeparatorColor = gray Set the color of separate in between Console/Logx Attachment
◼︎ Methods (summary)
● init ▶︎ Initialise the log
● log ▶︎ Log the messages. Use method show to display the messages
● page ▶︎ Clear messages from previous bar while logging messages on this bar.
● show ▶︎ Shows a table displaying the logged messages
● clear ▶︎ Clears the log of all messages
● resize ▶︎ Resizes the log. If size is for reduction then oldest messages are lost first.
● turnPage ▶︎ When called, all messages marked with previous page, or from start are cleared
● dateTimeFormat ▶︎ Sets the date time format to be used when displaying date/time info.
● resetTextColor ▶︎ Reset Text Color to library default
● resetTextBGcolor ▶︎ Reset Text BG Color to library default
● resetHeaderColor ▶︎ Reset Header Color to library default
● resetHeaderBGcolor ▶︎ Reset Header BG Color to library default
● resetStatusColor ▶︎ Reset Status Color to library default
● resetStatusBGcolor ▶︎ Reset Status BG Color to library default
● setColors ▶︎ Sets the colors to be used for corresponding error codes
● setColorsBG ▶︎ Sets the background colors to be used for corresponding error codes. If not match of error code, then text color used.
● setColorsHC ▶︎ Sets the highlight colors to be used for corresponding error codes.If not match of error code, then text bg color used.
● resetColors ▶︎ Reset the colors to library default (Total 36, not including error code 0)
● resetColorsBG ▶︎ Reset the background colors to library default
● resetColorsHC ▶︎ Reset the highlight colors to library default
● setLevelNames ▶︎ Set the log level names to be used for corresponding error codes. If not match of error code, then empty string used.
● resetLevelNames ▶︎ Reset the log level names to library default. (Total 36) 1=TRACE, 2=DEBUG, 3=INFO, 4=WARNING, 5=ERROR, 6=CRITICAL, 7=FATAL
● attach ▶︎ Attaches a console to an existing Logx, allowing to have dual logging system independent of each other
● detach ▶︎ Detaches an already attached console from Logx
No Code SignalsNo Code Signals is an intuitive user interface for users to generate their own signals based on indicators they already have applied to their chart.
This indicator makes use of the new input.source() limits for importing data from external sources (indicators) into 1 indicator.
You are now able to import ANY number of sources from up to 10 different indicators.
Features:
- Import up to 10 unique values from up to 10 different indicators already on your chart!
- Compare those values against other imported indicator values, or chart ohlc values.
- Option to use a defined level instead of an active source.
- 5 Signal Options (Currently)
- Alerts, Each signal has its own alert condition.
- Labeled Signals, to tell which signal is which.
Potential Future Plans:
- More Signals & Analysis Options
- Possibly more imports
- Combining 2 (or more) signals into 1
Here is a Screenshot of a chart with signals, and the Interface creating the signals.
Enjoy!

FibonRSI / ErkOziHello,
This software is a technical analysis script written in the TradingView Pine language. The script creates a trading indicator based on Fibonacci retracement levels and the RSI indicator, providing information about price movements and asset volatility by using Bollinger Bands.
There are many different scripts in the market that draw RSI and Fibonacci retracement levels. However, this script was originally designed by me and shared publicly on TradingView.
***The indicator uses RSI (Relative Strength Index) and Bollinger Bands (BB) as the basis for the FibonRSI strategy. RSI measures the strength of a price movement, and BB measures the volatility of an asset. The FibonRSI strategy is based on the idea that the Fibonacci ratios and RSI can be used to predict a asset's price retracement levels.
***The script allows for various parameters to be adjusted. Users can specify the price source type and adjust the periods for RSI and Bollinger Bands. The standard deviation number for Bollinger Bands can also be customized.
***The script calculates the current RSI indicator position and the basic, upper, and lower levels of Bollinger Bands. It then calculates and draws the Fibonacci retracement levels. The color of the RSI line is determined by the upper and lower distribution levels of Bollinger Bands. Additionally, the color of the Fibonacci retracement levels can also be customized by the user.
***This script can be used to determine potential buy and sell signals using Fibonacci retracement levels and RSI. For example, when the RSI is oversold and the price is close to a Fibonacci retracement level, it can be interpreted as a buying opportunity. Similarly, when the RSI is overbought and the price is close to a Fibonacci retracement level, it can be interpreted as a selling opportunity.
***The script takes input parameters such as the price source used for calculation, the period for the RSI indicator, the period for the Moving Average in Bollinger Bands, and the number of standard deviations used in Bollinger Bands.
***The script's conditions include elements such as calculating the current position of the RSI indicator, calculating the upper and lower Bollinger Bands, calculating the dispersion factor, and calculating Fibonacci levels.
***The parameters in the code can be adjusted for calculation, including the price type used, the RSI period, the Moving Average period for BB, and the standard deviation count for BB. After this, the current position of the RSI, Moving Average, and standard deviation for BB are calculated. After calculating the upper and lower BB, the levels above and below the average are calculated using a specific dispersion constant.
CONDITIONS FOR THE SCRIPT
current_rsi = ta.rsi(src, for_rsi) // Current position of the RSI indicator
basis = ta.ema(current_rsi, for_ma)
dev = for_mult * ta.stdev(current_rsi, for_ma)
upper = basis + dev
lower = basis - dev
dispersion = 1
disp_up = basis + (upper - lower) * dispersion
disp_down = basis - (upper - lower) * dispersion
// Fibonacci Levels
f100 = basis + (upper - lower) * 1.0
f78 = basis + (upper - lower) * 0.78
f65 = basis + (upper - lower) * 0.65
f50 = basis
f35 = basis - (upper - lower) * 0.65
f23 = basis - (upper - lower) * 0.78
f0 = basis - (upper - lower) * 1.0
***When calculating Fibonacci levels, the distance between the average of BB and the upper and lower BB is used. These levels are 0%, 23.6%, 35%, 50%, 65%, 78.6%, and 100%. Finally, the RSI line that changes color according to a specific RSI position, Fibonacci levels, and BB are visualized. Additionally, the levels of 70, 30, and 50 are also shown.
The script then sets the color of the RSI position according to the EMA and draws Bollinger Bands, RSI, Fibonacci levels, and the 70, 30, and 50 levels.
In conclusion, this script enables traders to analyze market trends and make informed decisions. It can also be customized to suit individual trading strategies.
This script analyzes the RSI indicator using Bollinger Bands and Fibonacci levels. The default settings are 14 periods for RSI, 233 periods and 2 standard deviations for BB. The MA period inside BB is selected as the BB period and is used when calculating Fibonacci levels.
***The reason for selecting these settings is to provide enough time for BB period to confirm a possible trend. Additionally, the MA period inside BB is matched with the BB period and used when calculating Fibonacci levels.
***Fibonacci levels are calculated from the distance between the upper and lower bands of BB and show how RSI movement is related to these levels. Better results can be achieved when RSI periods are set to Fibonacci numbers such as 21, 55, and 89. Therefore, the use of Fibonacci numbers is recommended when adjusting RSI periods. Fibonacci numbers are among the technical analysis tools that can capture the reflection of naturally occurring movements in the market. Therefore, the use of Fibonacci numbers often helps to better track fluctuations in the market.
Finally, the indicator also displays the 70 and 30 levels and the middle level (50) with Fibonacci levels drawn in circles. Changing these settings can help optimize the Fibonacci levels and further improve the indicator.
Thank you in advance for your suggestions and opinions......

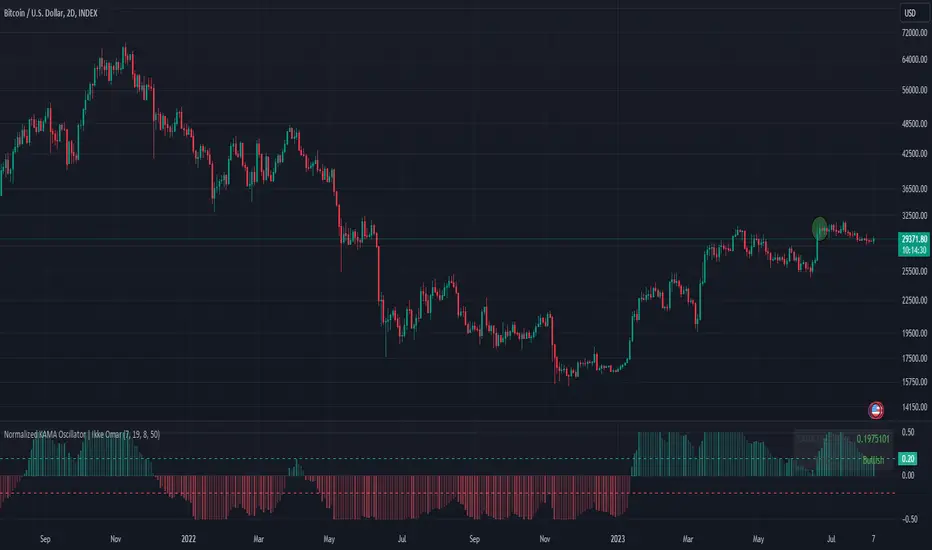
Normalized KAMA Oscillator | Ikke OmarThis indicator demonstrates the creation of a normalized KAMA (Kaufman Adaptive Moving Average) oscillator with a table display. I will explain how the code works, providing a step-by-step breakdown. This is personally made by me:)
Input Parameters:
fast_period and slow_period: Define the periods for calculating the KAMA.
er_period: Specifies the period for calculating the Efficiency Ratio.
norm_period: Determines the lookback period for normalizing the oscillator.
Efficiency Ratio (ER) Calculation:
Measures the efficiency of price changes over a specified period.
Calculated as the ratio of the absolute price change to the total price volatility.
Smoothing Constant Calculation:
Determines the smoothing constant (sc) based on the Efficiency Ratio (ER) and the fast and slow periods.
The formula accounts for the different periods to calculate an appropriate smoothing factor.
KAMA Calculation:
Uses the Exponential Moving Average (EMA) and the smoothing constant to compute the KAMA.
Combines the fast EMA and the adjusted price change to adapt to market conditions.
Oscillator Normalization:
Normalizes the oscillator values to a range between -0.5 and 0.5 for better visualization and comparison.
Determines the highest and lowest values of the KAMA within the specified normalization period.
Transforms the KAMA values into a normalized range.
By incorporating the Efficiency Ratio, smoothing constant, and normalization techniques, the indicator actually allows for the identification of trends on different timeframes, even in extreme market conditions.
The normalization makes it much more adaptive than if you were to just use a normal KAMA line. This way you actually get a lot more data by looking at the histogram, rather than just the KAMA line.
I essentially made the KAMA into an oscillator! Please ask if you want me to code another indicator
I hope you enjoyed this.
Please ask if you have any questions<3
Higher TimeFrame Smooth Moving AveragesScript is designed for those who dislike how plotting a moving average from a higher timeframe on a lower timeframe chart results in a choppy zigzag line when using the standard request.security(syminfo.ticker,"x",ta.sma(src,len)) method.
My more elegant solution was to translate the chart's current timeframe, and the selected higher timeframe into seconds, then check if selected timeframe is Larger than chart timeframe, but not so large that too many bars would be necessary. Then the quotient is calculated by dividing the chosen timeframe (value in seconds) by the chart's timeframe (value in seconds).
Then take that quotient and multiply it by the chosen length. This gives us how many bars of the chart's timeframe would be used in calculating the higher timeframe Moving Average
Use the value to calculate a moving average of choice (SMA,EMA,WMA,LRC,DEMA,TEMA,TRIMA,FRAMA) thanks to @TradingView 's ta library () and @alexgrover 's () for their functions supporting series as length, making this possible.
Basically, get how many of the current chart's bars are in the higher timeframe moving average and use that as the length for calculation using chart's timeframe.
If the higher timeframe relative is too large relative to chart's timeframe, due to bar referencing limits some combinations may not be possible under current limitations, but most will work by either moving chart's timeframe higher or higher timeframe lower assuming you aren't trying to do something too extreme like plotting a weekly moving average onto a 30 second chart etc.

3D BowlingIntroducing the "3D Bowling Game" – a fun and interactive demo scene project in Pine Script, powered by a custom 3D engine! This bowling game showcases the potential of Pine Script for developing engaging and immersive experiences, even within the confines of a trading platform.
To play the game, you'll first be prompted to choose where you want to throw the ball. Next, you'll be asked to draw a line indicating the direction you want the ball to go. Sit back and enjoy as the game takes care of the rest!
The source code features various sections, including:
Types and helper functions to manipulate vectors, matrices, and angles
Routines for calculating cross products, dot products, and vector normalization
Transformation matrices for rotation and scaling
Functions for perspective transformation, mesh transformations, and face normal calculations
Culling and shading algorithms to provide a more realistic visual experience
The project's source code is an excellent starting point for anyone interested in exploring the capabilities of Pine Script beyond the typical trading indicators and strategies. The 3D Bowling Game demonstrates the flexibility of Pine Script and its potential for creating interactive experiences in a seemingly unconventional environment.
So, what are you waiting for? Dive into the source code, tweak it to your liking, or build upon it to create your own interactive 3D experiences. Enjoy the game, and happy coding!
With light. I will say there is an issue with the fact that you cant draw as may linefills as you can lines.

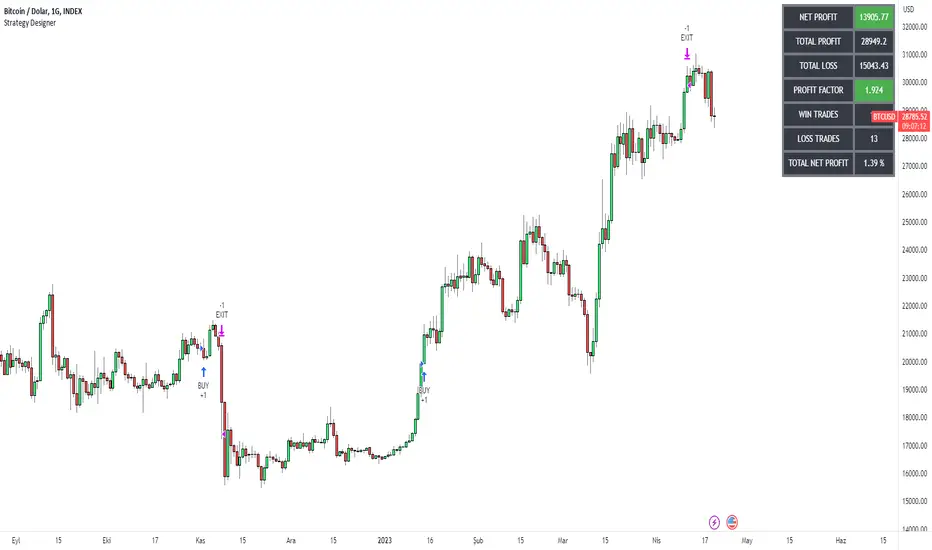
Strategy DesignerHello traders.
Thanks to the tool I have published, everyone who knows or does not know coding will be able to create strategies and see the results instantly on the screen. Yes it looks very nice :)
What does this script do?
Thanks to this tool, even if you don't know any coding, you will be able to create your own strategies. You can add and remove indicators.
Entrance
The first thing you need to do is to set a strategy in your mind.
Then you need to adjust the settings of the indicators installed in the system. Please set the indicators first, because later they are forgotten.
The screen for entering the parameters of the indicators will be as follows.
After entering the parameters there is an important part . In this section, we can adjust the strategy settings.
First we choose between which dates we want the strategy to run. We then choose whether we want the strategy results to be displayed in a table or not.
We choose how the Terms should be linked together. For example, if you have a condition that is expected to produce more than one receive signal, select whether these conditions are connected to each other with and or with the connector.
In this way, you can determine whether all or any of the rules in your strategy should apply.
Next, we choose whether our strategy will work in the spot market or in a bidirectional market. Yes, you can design a strategy for both spot and bidirectional trades :)
At the bottom of the above image, we see a screen where we can adjust the stop level and tp level. As a standard, adjustments are made according to the percentage level you enter. However, if you remove the tick next to the percent sign, the previous stop level and the next profit level are determined as much as the value you entered.
At the bottom is the trailing stop. When you open the trailing stop, the trailing stop becomes active in your strategy.
Very important, when the trailing stop and the stop are active at the same time, the trailing stop value is valid.
It's time to design our strategy. Each chapter that begins with an exclamation point is a separate fiction.
If you do not mark the Active button, that condition will not be included in the calculation.
Direction = It is the direction for which the fiction in this region is valid.
We came to the indicator setting screen. Here, there is a screen where we can select two different indicators on the right and left.
We choose the first indicator starting with 1.
Then we choose from the middle region how we want these two indicators to interact.
We choose our second indicator from the place starting with 2.
If you want an indicator to interact with any value, tick the box where it says Value and fill in the value in the blank. When Value is ticked, the second indicator does not work.
3D Engine OverlayThe Overlay 3D Engine is an advanced and innovative indicator designed to render 3D objects on a trading chart using Pine Script language. This tool enables users to visualize complex geometric shapes and structures on their charts, providing a unique perspective on market trends and data. It is recommended to use this indicator with a time frame of 1 week or greater.
The code defines various data structures, such as vectors, faces, meshes, locations, objects, and cameras, to represent the 3D objects and their position in the 3D space. It also provides a set of functions to manipulate these structures, such as scaling, rotating, and translating the objects, as well as calculating their perspective transformation based on a given camera.
The main function, "render," takes a list of 3D objects (the scene) and a camera as input, processes the scene, and then generates the corresponding 2D lines to be drawn on the chart. The true range of the asset's price is calculated using an Exponential Moving Average (EMA), which helps adjust the rendering based on the asset's volatility.
The perspective transformation function "perspective_transform" takes a mesh, a camera, an object's vertical offset, and the true range as input and computes the 2D coordinates for each vertex in the mesh. These coordinates are then used to create a list of polygons that represent the visible faces of the objects in the scene.
The "process_scene" function takes a list of 3D objects and a camera as input and applies the perspective transformation to each object in the scene, generating a list of 2D polygons that represent the visible faces of the objects.
Finally, the "render" function iterates through the list of 2D polygons and draws the corresponding lines on the chart, effectively rendering the 3D objects in a 2D projection on the trading chart. The rendering is done using Pine Script's built-in "line" function, which allows for scalable and efficient visualization of the objects.
One of the challenges faced while developing the Overlay 3D Engine indicator was ensuring that the 3D objects rendered on the chart would automatically scale correctly for different time frames and trading pairs. Various assets and time frames exhibit different price ranges and volatilities, which can make it difficult to create a one-size-fits-all solution for rendering the 3D objects in a visually appealing and easily interpretable manner.
To overcome this challenge, I implemented a dynamic scaling mechanism that leverages the true range of the asset's price and a calculated ratio. The true range is calculated using an Exponential Moving Average (EMA) of the difference between the high and low prices of the asset. This measure provides a smooth estimate of the asset's volatility, which is then used to adjust the scaling of the 3D objects rendered on the chart.
The ratio is calculated by dividing the asset's opening price by the true range, which is then divided by a constant factor (32 in this case). This ratio effectively normalizes the scaling of the 3D objects based on the asset's price and volatility, ensuring that the rendered objects appear correctly sized and positioned on the chart, regardless of the time frame or trading pair being analyzed.
By incorporating the true range and the calculated ratio into the rendering process, the Overlay 3D Engine indicator is able to automatically adjust the scaling of the 3D objects on the chart, providing a consistent and visually appealing representation of the objects across various time frames and trading pairs. This dynamic scaling mechanism enhances the overall utility and versatility of the indicator, making it a valuable tool for traders and analysts seeking a unique perspective on market trends.
In addition to the dynamic scaling mechanism mentioned earlier, the Overlay 3D Engine indicator also employs a sophisticated perspective transformation to render the 3D objects on the chart. Perspective transformation is an essential aspect of 3D graphics, as it provides the necessary conversion from 3D coordinates to 2D coordinates, allowing the 3D objects to be displayed on a 2D chart.
The perspective transformation process in the Overlay 3D Engine indicator begins by taking the 3D mesh data of the objects and transforming their vertices based on the position, orientation, and field of view of a virtual camera. The camera's field of view (FOV) is adjusted using a tangent function, which ensures that the rendered objects appear with the correct perspective, regardless of the chart's aspect ratio.
Once the vertices of the 3D objects have been transformed, the perspective-transformed 2D coordinates are then used to create polygons that can be rendered on the chart. These polygons represent the visible faces of the 3D objects and are drawn using lines that connect the transformed vertices.
The incorporation of perspective transformation in the Overlay 3D Engine indicator ensures that the 3D objects are rendered with a realistic appearance, providing a visually engaging and informative representation of the market trends. This technique, combined with the dynamic scaling mechanism, makes the Overlay 3D Engine indicator a powerful and innovative tool for traders and analysts seeking to visualize and interpret market data in a unique and insightful manner.
In summary, the Overlay 3D Engine indicator offers a novel way to interpret and visualize market data, enhancing the overall trading experience by providing a unique perspective on market trends.

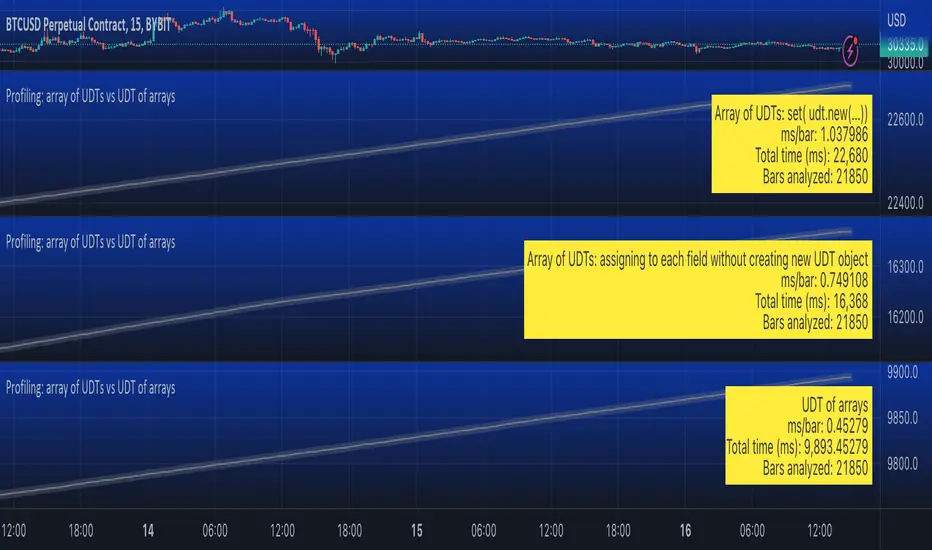
Profiling: array of UDTs vs UDT of arraysUsing Stopwatch Library by PineCoders, I am trying to test which is faster, an array of user-defined type (UDT) objects vs an object with many child arrays.
The task is to store and manipulate array of objects having total 9 values: 4 floats, 4 strings and 1 int.
Option 1: create a UDT with 9 fields and store an array of such UDT objects.
Option 2: create a UDT with 9 arrays individually for each value.
The test task is of three stages:
Populate array(s) with some (timenow) values - in the options you can choose how many values to push into the array/arrays. Note that max size of array(s) is set independently, so you can push 1000 of elements into an array capped at 100 max size and as new elements will be pushed (added to the end) the old exceeding elements will be shifted (removed from the beginning)
Write - write to random elements of the array. Two options for writing to a UDT object: (1) assign to each field independently, (2) create a UDT object and use array.set() function.
Read - read from random elements of the array.
In the options you can how many times per bar to run each of the steps (same number for each step).
I tested by adding three indicators to the chart and choosing different options for each:
1. Array of UDT's where writing is done by creating a new UDT from the values and then using set(udt)
2. Array of UDT's where writing is done by assigning the value of each of the properties of the UDT individually (saving time on creating of a new object).
3. UDT of arrays.
As of 16 Arpil 2023 the UDT of arrays seems about 20-30% faster than the array of UDT's with setting each property without creating new UDT object.
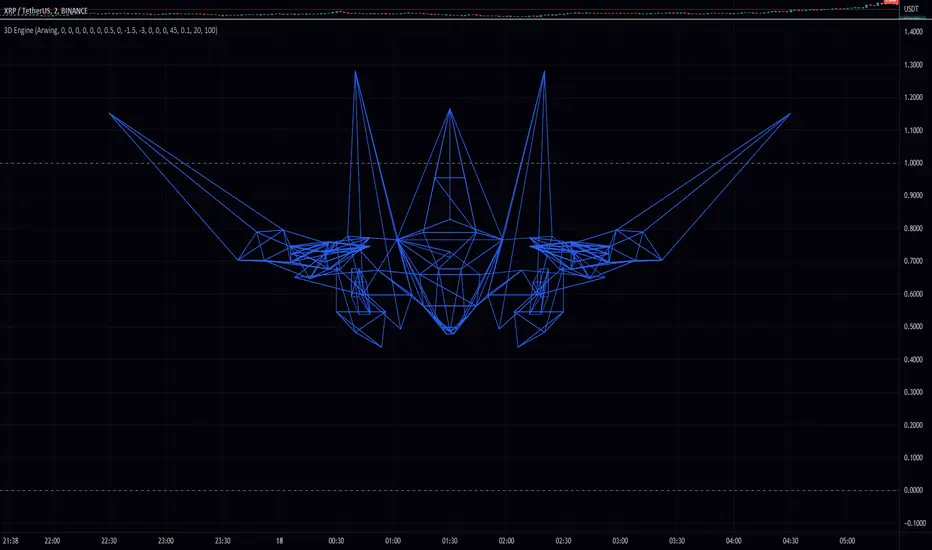
3D EngineHello everyone,
I am excited to share with you the first 3D engine in Pine Script! This is a remarkable achievement that will enable traders to explore the possibilities of 3D objects in their technical analysis.
To use this engine, you will need to use a higher time frame (1W or greater) to load the 3D objects in time. The code is straightforward and easy to use, with various input options to customize the object's position, rotation, and scale. You can select between two default 3D objects, Pin or Ball, by changing the 'list' input string.
The 3D engine is based on the vector and mesh data structures, and it includes several utility functions to perform operations such as rotation, translation, and scaling on these structures. It also includes functions to calculate perspective transformation for projecting 3D objects onto a 2D surface, which is the essential step in rendering the object in a 2D chart.
The 'process_scene' function is the main function that converts the 3D object data into 2D polygon data, which can be rendered on the chart. This function uses the 'process_object' function, which applies the object's transformation (position, rotation, and scale) and returns a scaled and rotated mesh that is ready for projection.
At the end of the code, there is a camera object that defines the camera's position, target, and field of view. You can customize this camera object to change the perspective of the rendered object.
To make your own 3D object, you can use the included Python program to convert an OBJ file into the format used by the engine. This program converts the OBJ file into a list of vector4 objects, which can be copy-pasted into the 'pin_vertex_list' array or a similar array. Please note that this process requires some knowledge of Python and the OBJ file format.
Overall, this is a fantastic achievement that opens up new possibilities for technical analysis in Pine Script. I encourage you to try it out and see what you can create with it.
In this code, there are several functions and data structures used to represent and manipulate 3D objects in a simple 3D engine. I will explain each function in detail below:
radians(degree): Converts an angle in degrees to radians.
quat_identity(): Returns a quaternion representing the identity rotation.
quat_from_axis_angle(axis, angle): Creates a quaternion from an axis of rotation and an angle.
quat_multiply(q1, q2): Multiplies two quaternions, q1 and q2, and returns the result.
quat_conjugate(q): Returns the conjugate of a quaternion, q.
quat_rotate(q, v): Rotates a 3D vector, v, by a quaternion, q, and returns the result.
rotate_vector_by_quaternion(v, q): Rotates a 3D vector, v, by a quaternion, q, and returns the result.
scale_vector(vector, constant): Scales a 3D vector by a constant and returns the result.
scale_mesh(mesh_obj, constant): Scales a mesh by a constant and returns the new mesh.
rotate_mesh(mesh_obj, axis, angle): Rotates a mesh around a specified axis by a given angle and returns the new mesh.
quat_translate(src, offset): Translates a 3D vector, src, by an offset and returns the result.
translate_mesh(mesh_obj, offset): Translates a mesh by an offset and returns the new mesh.
perspective_transform(msh, cam): Transforms a 3D mesh into a 2D mesh using a camera.
process_object(obj, cam): Processes a 3D object with a camera and returns a 2D mesh.
size(scene): Calculates the total number of vertices in a scene.
make_poly(scene): Converts a scene of 2D meshes into an array of polygons.
process_scene(scn, cam): Processes an entire scene of 3D objects with a camera and returns an array of polygons.
These functions work together to create a simple 3D engine that can manipulate, transform, and render 3D objects as 2D polygons. The main part of the script defines the camera, vertices, and faces for a pin object, and then uses the functions to process and render the object.
Note that some types are also defined in the code, including vector2, vector3, vector4, face, mesh, mesh2d, location, object, poly4, polyg, and camera. These types represent various mathematical structures and entities used in 3D graphics, such as vectors, faces, meshes, and cameras.
Here is an explanation of the inputs for all the functions in the given code:
radians(degree):
degree: Angle in degrees to be converted to radians.
quat_from_axis_angle(axis, angle):
axis: A vector3 object representing the axis of rotation.
angle: The angle in radians to rotate about the axis.
quat_multiply(q1, q2):
q1, q2: Two quaternion objects to be multiplied.
quat_conjugate(q):
q: A quaternion object whose conjugate is to be calculated.
quat_rotate(q, v):
q: The quaternion representing the rotation.
v: The vector3 object to be rotated.
rotate_vector_by_quaternion(v, q):
v: The vector3 object to be rotated.
q: The quaternion representing the rotation.
scale_vector(vector, constant):
vector: A vector4 object to be scaled.
constant: The scaling factor.
scale_mesh(mesh_obj, constant):
mesh_obj: A mesh object to be scaled.
constant: The scaling factor.
rotate_mesh(mesh_obj, axis, angle):
mesh_obj: A mesh object to be rotated.
axis: A vector3 object representing the axis of rotation.
angle: The angle in radians to rotate the mesh.
quat_translate(src, offset):
src: A vector4 object representing the source position.
offset: A vector3 object representing the translation offset.
translate_mesh(mesh_obj, offset):
mesh_obj: A mesh object to be translated.
offset: A vector3 object representing the translation offset.
perspective_transform(msh, cam):
msh: A mesh object to be transformed.
cam: A camera object used for the transformation.
process_object(obj, cam):
obj: An object containing a mesh and its location.
cam: A camera object used for processing the object.
make_poly(scene):
scene: An array of mesh2d objects to generate polygons from.
process_scene(scn, cam):
scn: An array of objects containing meshes and their locations.
cam: A camera object used for processing the scene.
Note that some of these functions are utility functions or internal functions, and their inputs are derived from other functions or user inputs.
I will make a library eventually.
OKX Perpetual Swap Position Sizer by RainbowLabsI created this tool to simplify the process of setting up trading bots on OKX perpetual swap pairs via Alertatron.
Instead of manually searching for each pair on www.okx.com and calculating the position size from dollar to contract, I developed a Python bot to scrape the necessary data and built an indicator to convert that data into TradingView.
Simply input the desired order amount in USDT, and the indicator will calculate the maximum number of contracts that can be traded without exceeding the user-defined risk amount.
Please note that this indicator only works with OKX perpetual swap pairs and is intended for educational and informational purposes only.
It should not be construed as financial advice, and traders should always perform their own analysis and make their own decisions regarding whether or not to enter a trade.
This indicator requires human updates. As a result, the most recent coins may not be available until a new update is released.
