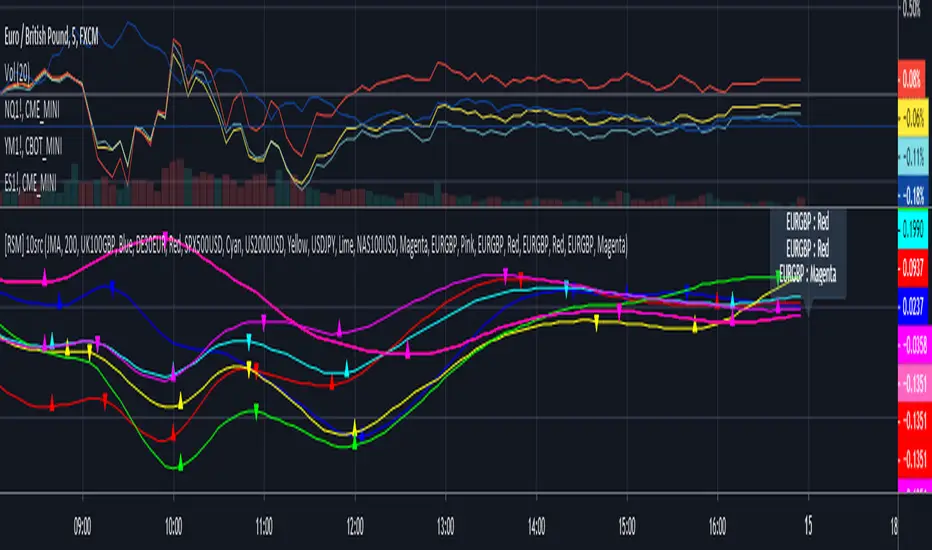
[RSM] Relative Strength Momentum 10 sources v1.1This indicator was designed to compare relative price momentum across multiple related/unrelated symbols, maximum of 10.
Each symbol's momentum/trend is determined by price movement and custom weighted moving averages.
You can use this indicator to determine changing trends by looking at correlated leading symbols.
Description of Input Parameters:
Dark theme: Turn on this checkbox if you are using the dark theme in Tradingview.
MA Type: Default is preferred, but allows you to choose different Moving Averages to determine momentum.
MA Period: Ideal period is 200 for a Chart TF of 15 minutes to 1 Hour for most symbols I've tested. (US/Euro Indexes CFD and Futures )
Symbol 1-10: Enter a valid Symbol in Tradingview otherwise indicator will return an error.
Color Symbol 1-10: Pick a unique color for each corresponding Symbol.
Display Symbol 1-10: Checkbox to turn on/off corresponding symbol's plot.
Access to Script:
Please contact me privately on Tradingview, user id: a.tesla2018
Alternatively, use the links below for method of payment/access to this indicator. Please do not forget to mention your TV name in notes.
Relativestrength
Price Relative / Relative StrengthThe Price Relative indicator compares the performance of one security to another with a ratio chart. This indicator is also known as the Relative Strength indicator or Relative Strength Comparative. Often, the Price Relative indicator is used to compare the performance of a stock against a benchmark index, S&P 500, BIST:XU100 etc.
Chartists can also use the Price Relative to compare the performance of a stock to its sector or industry group. This makes it possible to determine if a stock is leading or lagging its peers. The Price Relative indicator can also be used to find stocks that are holding up better during a broad market decline or showing weakness during a broad market advance. (Source: stockcharts)
This also can be used for Trend Identification and Bullish/Bearish Divergences.
Good Luck

[RSM] Relative Strength Momentum v1.0 [pvt]This indicator was designed to compare relative price momentum across multiple related/unrelated symbols, maximum of 6.
Each symbol's momentum/trend is determined by price movement and custom weighted moving averages.
You can use this indicator to determine changing trends by looking at correlated leading symbols.
Description of Input Parameters:
Dark theme: Turn on this checkbox if you are using the dark theme in Tradingview.
MA Type: Default is preferred, but allows you to choose different Moving Averages to determine momentum.
MA Period: Ideal period is 200 for a Chart TF of 15 minutes to 1 Hour for most symbols I've tested. (US/Euro Indexes CFD and Futures)
Symbol 1-6: Enter a valid Symbol in Tradingview otherwise indicator will return an error.
Display Symbol1-6: Checkbox to turn on/off corresponding symbol's plot.
Access to Script:
Please contact me privately on Tradingview, user id: a.tesla2018
Alternatively, use the links below for method of payment/access to this indicator.

🧬dRSI Signals Internal Beta Test by Cryptorthyhms🧬dRSI Signals Internal Beta Test by Cryptorthyhms
Test release, for internal testing only. Debut release soon!
Thank you all for your patience!

Combo Backtest 123 Reversal & Comparative Relative Strength This is combo strategies for get a cumulative signal.
First strategy
This System was created from the Book "How I Tripled My Money In The
Futures Market" by Ulf Jensen, Page 183. This is reverse type of strategies.
The strategy buys at market, if close price is higher than the previous close
during 2 days and the meaning of 9-days Stochastic Slow Oscillator is lower than 50.
The strategy sells at market, if close price is lower than the previous close price
during 2 days and the meaning of 9-days Stochastic Fast Oscillator is higher than 50.
Second strategy
Comparative Relative Strength Strategy for ES
WARNING:
- For purpose educate only
- This script to change bars colors.

Combo Strategy 123 Reversal & Comparative Relative Strength This is combo strategies for get a cumulative signal.
First strategy
This System was created from the Book "How I Tripled My Money In The
Futures Market" by Ulf Jensen, Page 183. This is reverse type of strategies.
The strategy buys at market, if close price is higher than the previous close
during 2 days and the meaning of 9-days Stochastic Slow Oscillator is lower than 50.
The strategy sells at market, if close price is lower than the previous close price
during 2 days and the meaning of 9-days Stochastic Fast Oscillator is higher than 50.
Second strategy
Comparative Relative Strength Strategy for ES
WARNING:
- For purpose educate only
- This script to change bars colors.


Relative Strength RankRelative Strength Rank Indicator
( ( Long Term Price Change + Short Term Price Change ) / 2 ) / 10 Day ATR

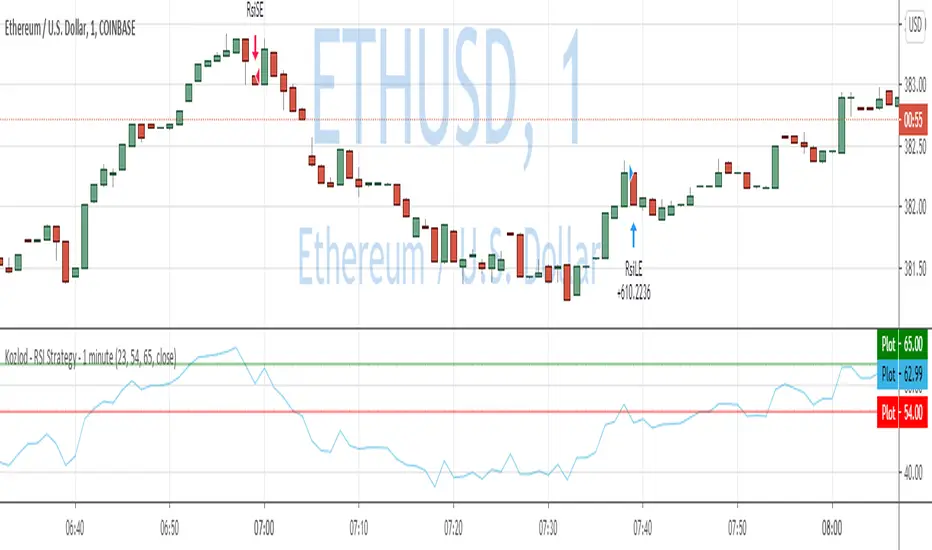
Kozlod - RSI Strategy - 1 minute - ETHUSDTrying to find simple strategies with optimal parameters which work well for certain symbols/timeframe.
Found that basic RSI strategy without any position management works pretty good for 1m chart for BTCUSDT.
It might not work very good on it's not but can give you a pretty good base for more complicated indicators.
Also, some position management as simple as static SL and PT can improve performance quite a lot.
And remember:
Past performance does not guarantee future results.
Relative Strength (MA) to KLCICompares a stock's relative strength against Malaysia market index (KLCI)

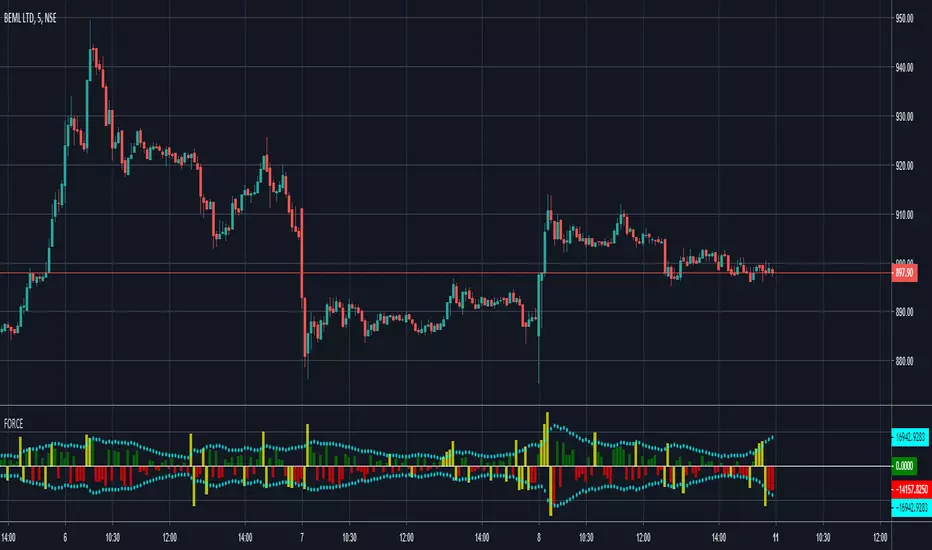
FORCEFORCE indicator calculates the pressure of buyer and seller in each candle based on volume, price, and shape. It outputs leading volume over that period and its relative strength.
Relative Volume Index(RVOLI)The RVOLI is derived from the Relative Strength Index. It is a momentum indicator that evaluates overbought and oversold conditions based on changes in volume over a specified period.
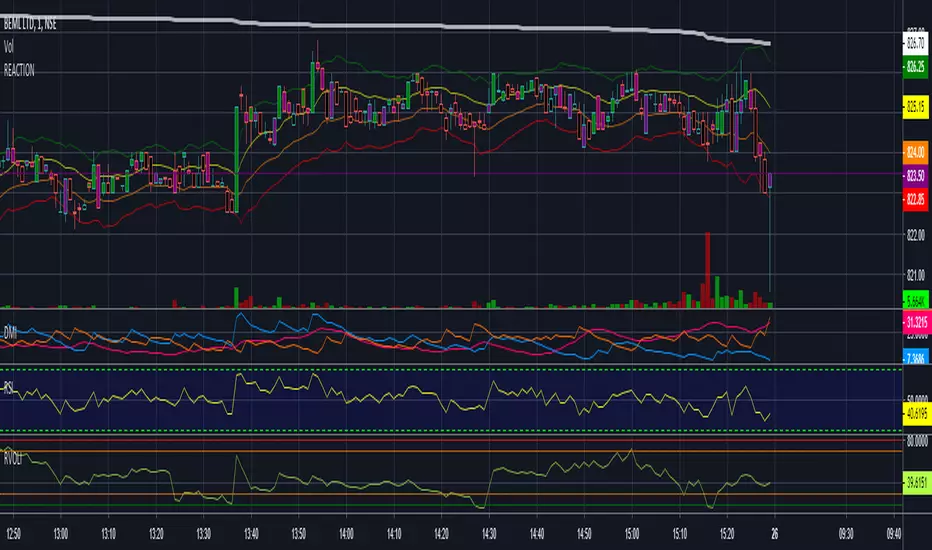
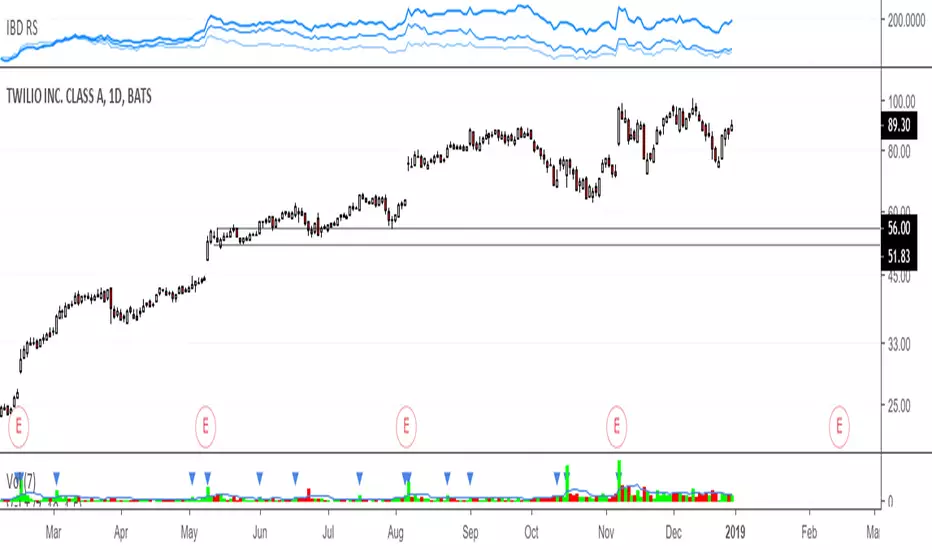
IBD RS, Relative strengthRelative Strength calculation of 3 time periods: 12 months, 6 months and 3 months.
Bitfinex Longs vs. Shorts RSILongs VS shorts RSI indicator.
You can chose length and source.
Uses BitFinex exchange to get long and short data.

RSI StrapFollowers, this RSI is for you!
RSI Strap uses a normal Relative Strength Index (RSI) to determine what price level is in the over-bought or over-sold range.
This minimalist overlay improves the technical trading experience as indicators take up a lot of space and leave your chart area cluttered.
Change the RSI length, as well as the overbought and oversold levels in the indicator settings panel.
The default RSI length is set at 14, and the overbought and oversold levels are 70% and 30% respectively.
Happy Trading!
Find this indicator by searching "RSI Strap" in the public indicator library.
Don't forget to like!

RSI+RSI+ is an augmented version of standard Relative Strength Index (RSI) enhanced with a EMA cloud and some momentum background highlights.
Includes 7 Color Themes (4 dark, 3 light).

Mansfield Relative Strength indicatorUse this indicator to compare how security is performing in compare with preferred index (SPX by default).
> 0 outperforming
< 0 underperforming
Works best for weekly, but can be applied to monthly and daily charts. It will be rather useless to use it in smaller timeframes
Apply it to SPX, industry index, sector index or other security in similar sector

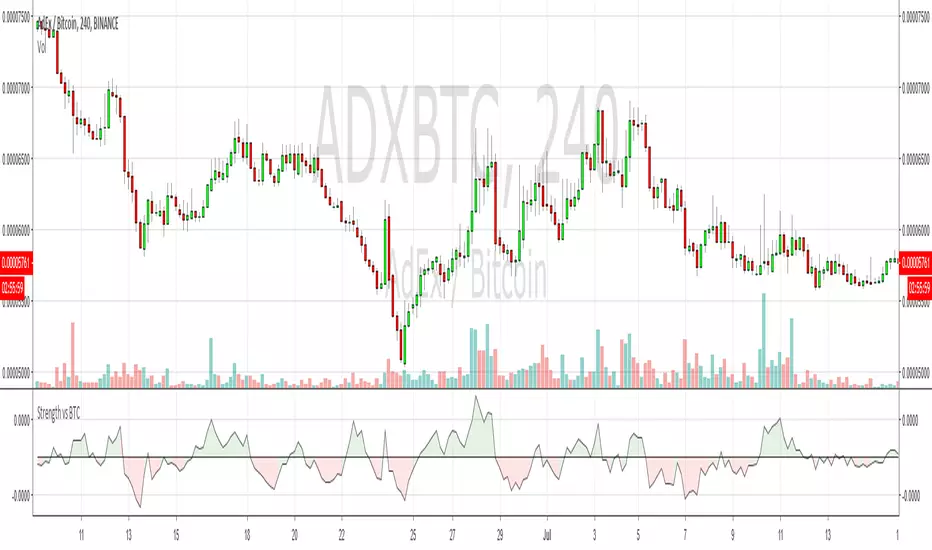
Strength Relative to BTCShows strength of the currently charted alt compared to BTCUSD. If BTC is going down or sideways and the alt is going up, then you'll see green and vice-versa for red. Good for quick at-a-glance strength evaluation when flying through a watchlist. The output uses a normalised moving average to reduce signal noise.