AM Trend Exhaustion/ChopThis indicator lets you see when a trend may be exhausted and require consolidation, as well as choppy trading zones.
When the oscillator is in the bottom bar, the price is in a chop zone. When it reaches the top bar, it is due for consolidation.
Truerange

ADR - Average Daily Range [@treypeng] [v2]
This is an intraday indicator.
Average Daily Range provides an upper and lower level around the daily open. It is calculated by taking an EMA/SMA average of a given number of previous days' True Range.
It can be useful for helping guide support and resistance, for taking profits and for placing stops.
It's a similar idea to the ATR indicator, but calculated on a daily timeframe only.
Settings:
Length: number of days to take an average from
Offset: Set this to 0 to include today's range. Set to 1 to exclude today. Set to 2 to exclude today and yesterday.....and so on.
The other settings should be self explanatory :)

True Range Specified VolumeThis indicator measures the "Effort" required to shift price.
By using Volume and Average True Range, it reveals how much volume was used to create each candle period.
The resistance threshold is set to 1.5x and will light up with an aqua or purple colour (bullish or bearish candle).
This means that the current bar is 1.5 times the previous bar and can be seen as a signal of a buying or selling frenzy - potential reversal.
If the bars light up with lime green or red, then this indicates that the value has exceeded TWICE the resistance threshold - a very strong signal.
A moving average is also included and can be set to filter out lower level signals. you can choose either a SMA or EMA and can adjust this moving average up or down by a percentage.
There is also an option to use the standard candle range rather than Average true range, should you get curious.
Enjoy!!
------------------------------------------------------------------
Kind regards
Created 2018 - by @Squiggles#8806
Want to support the creation of these indicators?
LTC Tip Jar: LX4bUBdjiRPsagUbZoAczSGgDC4YqTJL7w

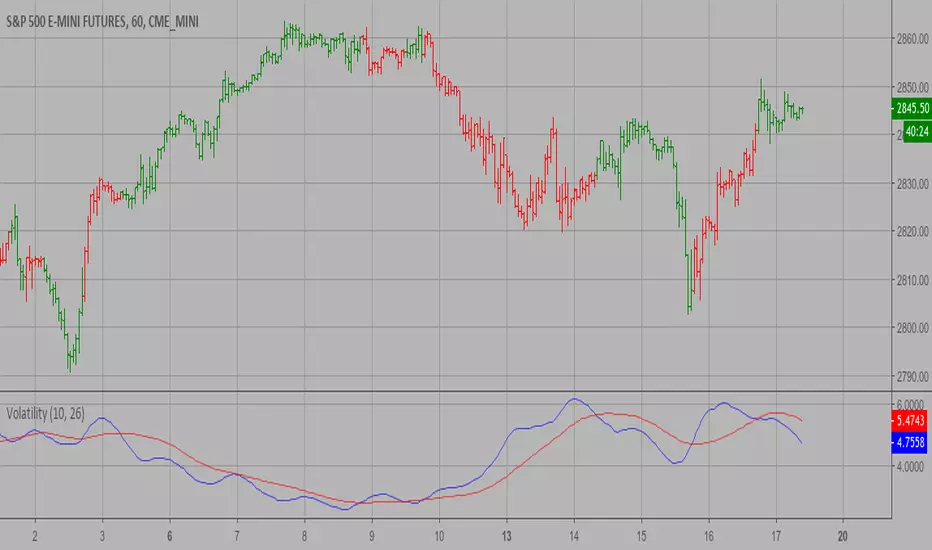
Volatility Backtest The Volatility function measures the market volatility by plotting a
smoothed average of the True Range. It returns an average of the TrueRange
over a specific number of bars, giving higher weight to the TrueRange of
the most recent bar.
You can change long to short in the Input Settings
WARNING:
- For purpose educate only
- This script to change bars colors.

Volatility Strategy The Volatility function measures the market volatility by plotting a
smoothed average of the True Range. It returns an average of the TrueRange
over a specific number of bars, giving higher weight to the TrueRange of
the most recent bar.
WARNING:
- This script to change bars colors.


Volatility RatioVolatility Ratio indicator script. This indicator was originally developed by Jack Schwager.

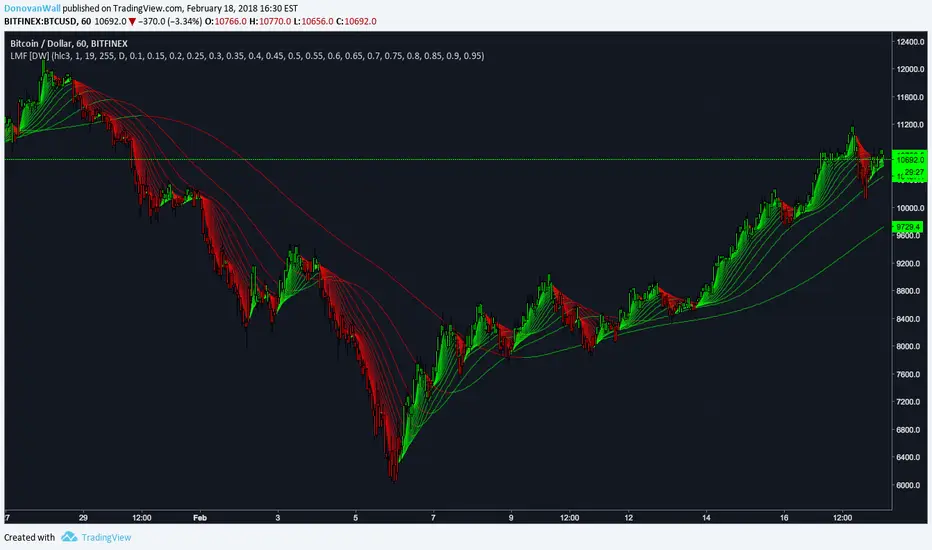
Laguerre Multi-Filter [DW]This is an experimental study designed to identify underlying price activity using a series of Laguerre Filters.
Two different modes are included within this script:
-Ribbon Mode - A ribbon of 18 Laguerre Filters with separate Gamma values is calculated.
-Band Mode - An average of the 18 filters generates the basis line. Then, Golden Mean ATR over the specified sampling period multiplied by 1 and 2 are added and subtracted to the basis line to generate the bands.
Multi-Timeframe functionality is included. You can choose any timeframe that TradingView supports as the basis resolution for the script.
Custom bar colors are included. Bar colors are based on the direction of any of the 18 filters, or the average filter's direction in Ribbon Mode. In Band Mode, the colors are based solely on the average filter's direction.
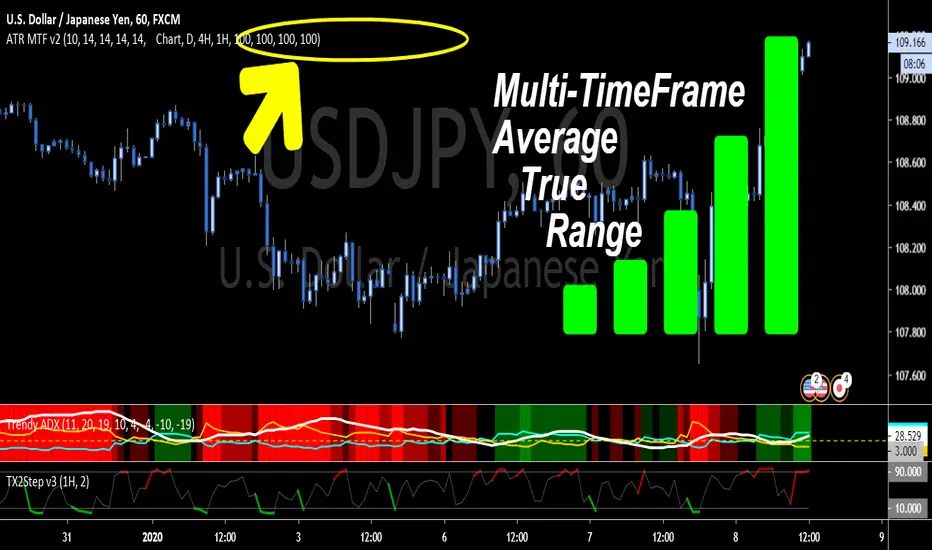
ATR True Range - Multi Timeframe - BonavestTo add this indicator to your charts:
Click the 'Add to Favorite Scripts' button down below this description.
This simple indicator is merely for displaying mulitple ATR ranges at a glance on one chart.
SETTINGS
Each ATR is completely configurable:
Length - to base the ATR on
Timeframe - 'Chart' uses the current chart resolution; other timeframes are available on pull downs
Multiplier - Each ATR can use a multiplier to be able to show multiples or fractions of the full ATR. (i.e. 85=85%, 150=150%)
Dark Theme - Default colors for black or dark backgrounds
I use this indicator for:
Determining price ranges
Setting stop losses and take profit levels
J-PipsI made this tool to measure the exact PIP range of different currency pairs in an easy to understand format.
It comes with the option to convert the PIP Values to XXX/JPY Pairs with a simple check-box.
"H" is the highest PIP movement in 377 time periods.
"N" is the EMA-377 of the PIP ranges.
"P" is the current time periods PIP moment (true range).

Relative True RangeDots show the total movement for the period as a percentage (profit potential).
Line shows the volatility of the period in relation to the beginning of the period.
