Wave Analysis
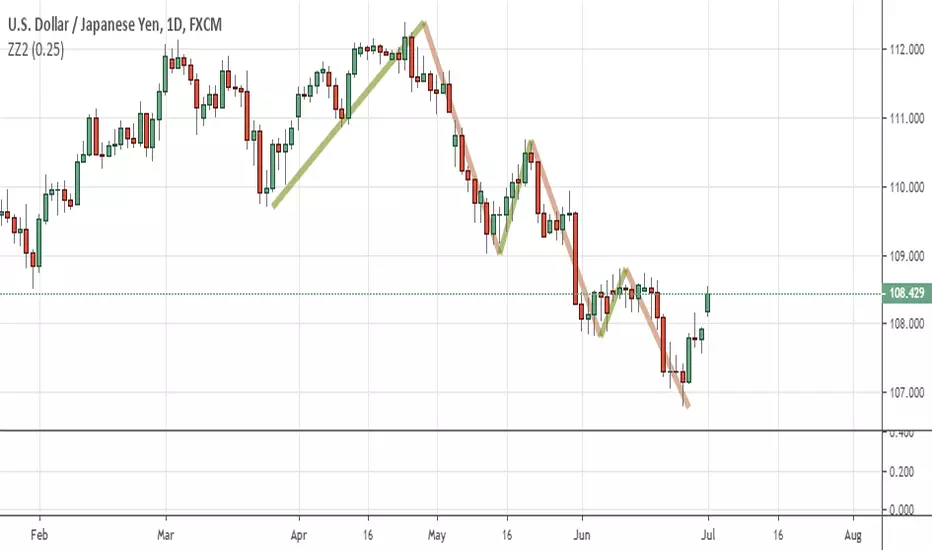
[RS]ZigZag Percent Reversal - Forecast - patterns - labels description:
• Zig Zag indicator plots points on the chart whenever prices reverse
by a percentage greater than a pre-chosen variable.
• Forecasts area based on zigzag statistics.
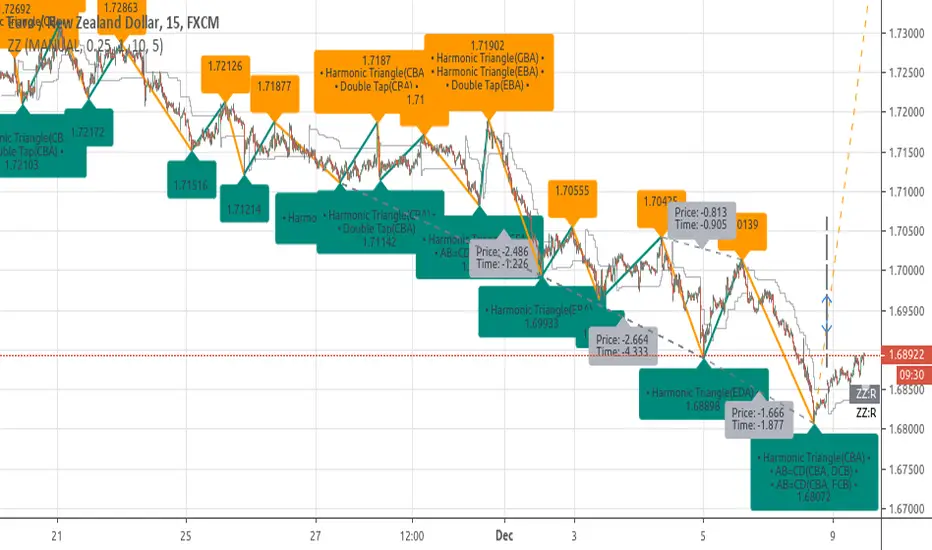
• Displays labels with detected patterns.
• Displays slope information rate of price, time diferentials and angle(experimental)
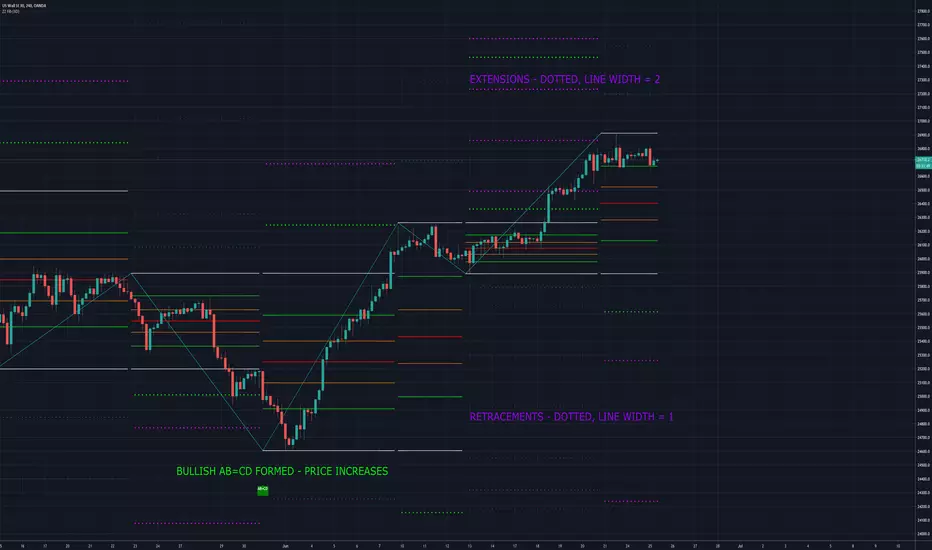
MoT - ZigZag Fibonacci + Ext./Ret. (Extended Ver.)The Indicator plots ZigZags and then overlays Fibonacci Levels (With Extension and Retracement Levels).
W have also programmed the indicator to search for Bullish/Bearish chart patterns in the form of ABC's, ABCD's, 3 Drives , BAT etc etc.
We have also added multiple time frame (MTF) options so the script will search for swing Highs/Lows over a larger period.
Please Note - This Version is with Extended lines of the most current Fib Levels. Which can make the charts look very busy. The other Indicator (No Extensions - Cleaner) is here:

MoT - ZigZag Fibonacci w/Extensions + Chart Pattern RecognitionOne of my favourite indicators we have created over an extremely creative weekend while also watching Bitcoin keep pushing on! The Indicator plots ZigZags and then overlays Fibonacci Levels (With Extensions). I have also programmed the indicator to search for Bullish/Bearish chart patterns in the form of ABC's, ABCD's, 3 Drives, BAT etc etc. This evening we have also added multiple time frame (MTF) options.

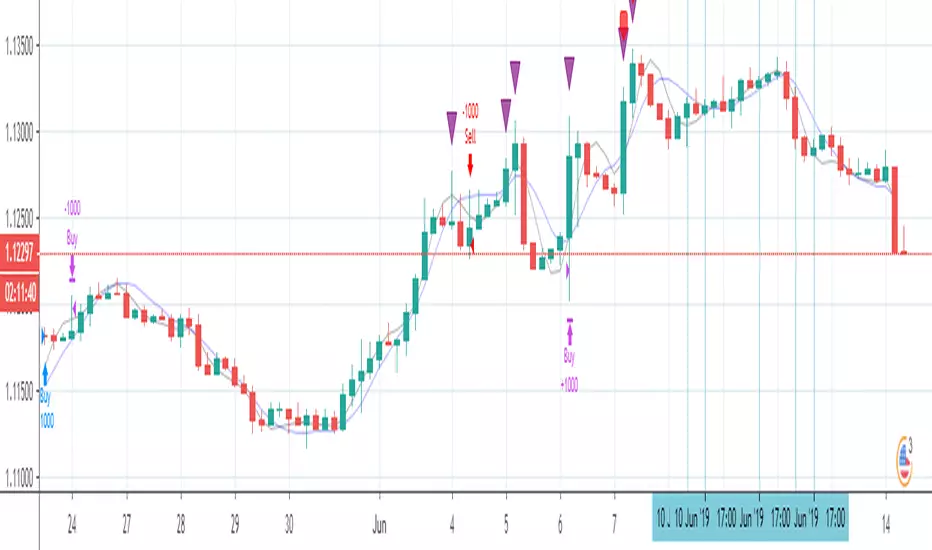
Peaks ReversalThis is a script request by trader @liquidentourage
This script analyses the market at high or low peaks and uses price action to enter the trade
[RS]ZigZag Percent Reversal(Multiple) - Forecast Areasnaive level forecasting of multiple zigzag's
based on this principle:
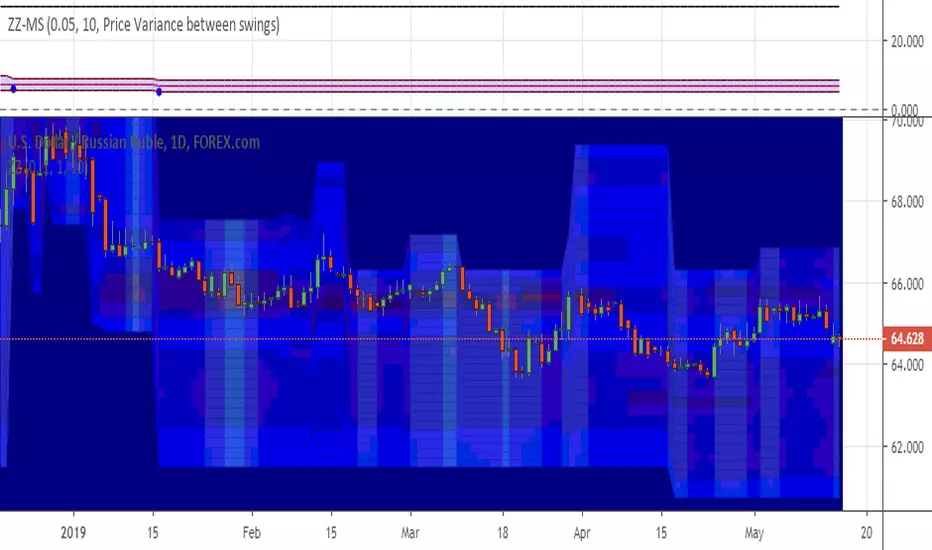
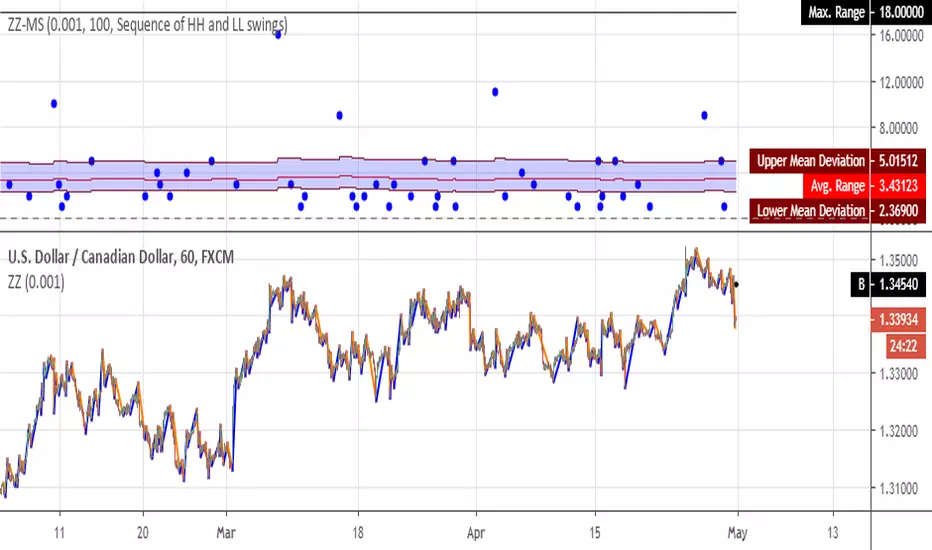
[RS]ZigZag Percent Reversal - Multiple StatisticsMultiple Statistics from zigzag:
• Price range between swings.
• Bar range between swings.
returns maximum value, avg value and mean deviation.
if you find something missing, please leave a message bellow.
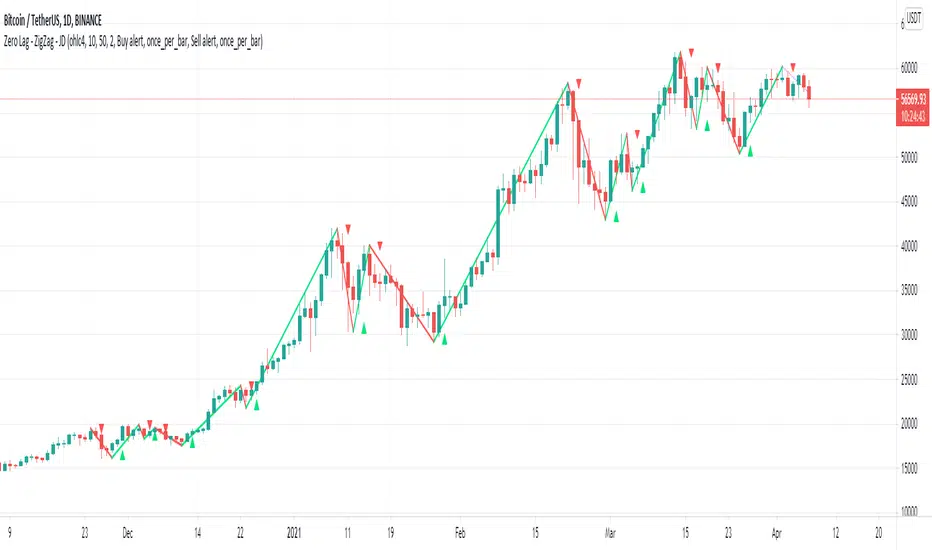
Zero Lag - ZigZag - JDThis is a alternative version of the well known "ZigZag indicator" but it uses turning points of the Jurik ma
instead of the traditional "pivot points" that are by definition lagging by a large lookback period, the (almost-) Zero Lag ZigZag lags by about 2 bars on average (depending on the candles forming)
The ZigZag pattern can be used to draw trendlines and S/R lines
It can also be used for "wave counting" in a way that reduces interpretation.
If you find other uses, please leave your ideas in the comments!
Shoutout to Everget for the awesome Jurik code!!
JD.
#NotTradingAdvice #DYOR
Simple LinesIntroduction
Making lines is great in technical analysis since it can highlights principal movements and make the analysis of the price easier when using certain methodologies (Elliott Waves, patterns).
However most of the indicators making lines (Zig-Zag, simple linear regression) are non causal (repaint), this is the challenge i tried to overcome, making an indicator capable of making lines in a smart way (able to follow price without loosing a linear approach) and with the least lag possible, i inspired myself from the behaviour of the renko when using a small brick size. This indicator does not repaint .
The code is short and i hope, understandable for all of you, making lines is not a difficult task and its important to know that when a problem appear complex it does not mean that the code used to solve this problem must be complex. Lets see the indicator in details.
The indicator
The indicator have 4 parameters, the length parameter who control the length of lines, the emphasis parameter who control the stability and also the ability to make lines closer to the price (thus minimizing the sum of squares) , the mult parameter which is similar to emphasis and a point option that we will discuss later.
When emphasis and mult are both equal to 1 the indicator will sometimes draw a perfect line, however this line will try to follow the price and thus can create a noisy result.
This is where emphasis and mult will correct this behaviour. The emphasis parameter give a more periodic look as well as some control to the lines but can also destroy them.
This should not happen with mult , this parameter also give more predictability to the lines. Overall it correct the drawbacks of the parameters combinations mentioned earlier.
Its also possible to mix both the emphasis and mult parameter, but take into account that when both are equals the result consist of less reactive lengthy lines with low accuracy. Its better to only use one of them and let the other stay to 1.
Point Option
The indicator can sometimes have a weird look, appearing almost flat or just dont appearing at all. When such thing happen use the point option.
XPDUSD without point option.
with point option :
Time Frame Problem and Its Fix
When using higher time-frames the result of the indicator can appear different, in general the higher the time frame the lengthier are the lines. In order to fix this you can use decimals in the length parameter
length and mult both equal to 5.5, emphasis cant use decimals.
Conclusion
I have highlighted a simple way to make use of the small renko box size method in order to return reactive lines without making the indicator repaint. However Its ability to be close to the price as well as being always super reactive is not a guarantee.
For any suggestion/help feel free to pm me, i would be happy to help you :)

Double Top Pattern IdentifierI believe the most of users know the Double Top Pattern, so I omit the introduction.
The algorithm uses 10 internal watchers to identify the incomplete M-pattern. If any of the watchers finds the pattern, the signal will be plotted on the chart. You can customize the lookback periods for the watchers as well as you can specify the precision of the difference between two possible tops.
By default, all watchers wait for bar closing to avoid repainting issues. You can switch off this option.
Additionally, you can shift up/down the signal labels to the preferred distance.
NOTE: the orange straight lines are not included.

Elliott strategyIt uses Elliott teory to shift two moving averages 8 positions (based on 5-3 fractal), and the crossing is close to reversions. And it keeps an eye on RSI level to be sure it is on hot level to sell/buy

Double Bottom Pattern IdentifierI think everybody knows the Double Bottom Pattern, so I omit the introduction.
The algorithm uses 8 internal watchers to identify the incomplete W-pattern. If any of the watchers finds the pattern, the signal will be plotted on the chart. You can customize the lookback periods for the watchers as well as you can specify the precision of the difference between two possible bottoms.
By default, all watchers wait for bar closing to avoid repainting issues. You can switch off this option.
Additionally, you can shift down the signal labels to the preferred distance and set an alert for a new pattern found.
NOTE: the blue straight lines are not included.

Divergences for many indicators v2.0A gift from me to all.
This script is developed to find Divergences for many indicators. it analyses divergences and then draws line on the graph. red for negatif, lime for positive divergences.
Currently script checks divergence for RSI, MACD, MACD Histogram, Stochastic, CCI, Momentum, OBV, Diosc, VWMACD and CMF indicators. You can use some or all of these indicators to check divergences as you wish by choosing them on the menu. Also you can add/remove many other indicators to the script to check if there is divergence.
The script first calculates tops/bottoms by using higher time frame zig zag and then finds divergences.
Higher Time Frames are
if currend period 1 min => HTF = 5 mins
if currend period 3 mins => HTF = 15 mins
if currend period 5 mins => HTF = 15 mins
if currend period 15 mins => HTF = 1 hour
if currend period 30 mins => HTF = 1 hour
if currend period 45 mins => HTF = 1 hour
if currend period 1 hour => HTF = 4 hours
if currend period 2 hours => HTF = 4 hours
if currend period 3 hours => HTF = 4 hours
if currend period 4 hours => HTF = 1 day
if currend period 1 day => HTF = 1 week
if currend period 1 week => HTF = 1 week
future plan : script finds regular divergences, soon I will add hidden divergences and also I plan to add alert ;)

Elliott wave strategy (lirshah)Elliott wave strategy has been written based on Elliott oscillator.
the strategy has good results on crypto pair at H1 time frame..

Fractal FramerThis indicator constructs dynamic high/low price range levels, based on 3 point fractals. Trend lines are drawn (zigzag style) at fractal points when trend direction is clearly established.
This is a lagging indicator: fractals lag by one bar and trend lines can lag by many bars. However, its strength lays in objectively defining historic price action: e.g. support/resistance levels and waves within a trend.
See the comments at the beginning of the script for a complete description.

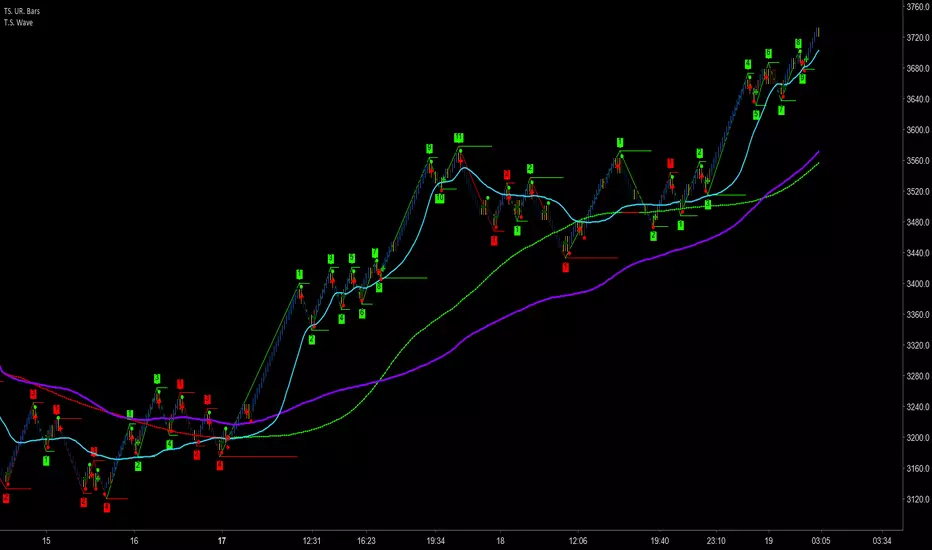
Trader Set - Wave CountThis is a wave counting tool for my methodology with little addition of drawing high low sections of wave reversal as local support / resistance.
Please don't contact me for getting access, these tools are only available for my students. The English version of website and learning materials are under development and soon they will be ready. I will announce it under every script related to my methodology so that you get informed and participate in the course if you want to.
Market Compass [yoxxx]For all markets and all timeframes,
based on Constance Brown's observation, that rsi bull range is 40 to 80 and bear's 20 to 65 (almost strictly).
The histogramm tells you which longer term market you#re in.
The short term curves identify the wave within the trend (similat to EW impulse / corrective) incl. overdoing action
Example: longterm= green, wave =red--> Bullmarket, corrective wave etc.
(I locked this one to remind you that the length of the indicators are essential)

Gann Swings Trend CounterBased on Rick Santos ' Swing Charts V1 Darvas Box V0.1'
However I have migrated script to pine version 3, customized to suite and added a higher number for the trend count

ZigZag Repaint Examplesimple example showing how to use na to create straight lines that "repaint" as the latest bars update.

Levels and Zones • Minimalist TradingThe Levels and Zones is a leading indicator which automatically identifies the best support and resistance levels as well as their corresponding bullish and bearish zones.
The indicator constantly detects and highlights for you the optimum levels and zones where you will find the greatest opportunities to go long or short .
As soon as the market moves to a new level with the Levels and Zones you will be ready to catch the next profitable trade .
The indicator is available via subscription and you can enjoy a free trial . To know more about the indicator and start the trial simply visit the link below.
➡ Try the indicator

BullTrading ZigZagSome people say the ZigZag indicator is the Holy Grail... I think half of this statement is true :)
This is an alert friendly ZigZag indicator with MultiTimeframe Capabilities, it will alert you each time the ZigZag plots a new line (Higher Timeframe ZigZags are plotted with respective timeframe offset).
Note: The indicator works on higher timeframes (D and above)
Default Resolution is D, adjust resolution to your favorite timeframe and Min %
Use in conjunction with your Fib tool and enjoy.
