AAVE Daily Chart – Key Buy Zone & Two ScenariosAAVE is currently moving within a well-defined ascending channel on the daily timeframe. The last major bullish leg began from the $120 support and surged nearly +180% to a local high near $330.
Now, after a 25% pullback, price is consolidating around the midline of the channel near $250. More impo
Related pairs

AVVE IS TIME TO BUYHello friends🙌
Given the good growth we had, now in a correction there is a good opportunity for the price to reach our high volume range or even lower and we can buy in steps and with risk and capital management.
🔥Follow us for more signals🔥
*Trade safely with us*

AAVE 1H – Triple Tap Support + Bullish Divergence Incoming?AAVE is painting a compelling reversal setup on the 1H timeframe. After a sharp selloff last week, price has tapped the $278–282 demand zone multiple times — each time printing higher local lows on the Stochastic RSI and showing signs of exhaustion from sellers.
This zone has now been tested three

Aave (AAVE): Sellers Taking Over | Looking For Bearish CME FillAave caught our attention with current sell-side dominance, which might lead to a breakdown from the local neckline zone, which then again will lead the price towards the bearish CME gap (to fill it).
What we are looking here is a proper breakdown; after that, we want to see steep movement to lowe

Aave shor to $276 todayAAVE Short Setup (Limit Order) just filled
Entry: $288.89
SL: $293.15+
TP: $276.00

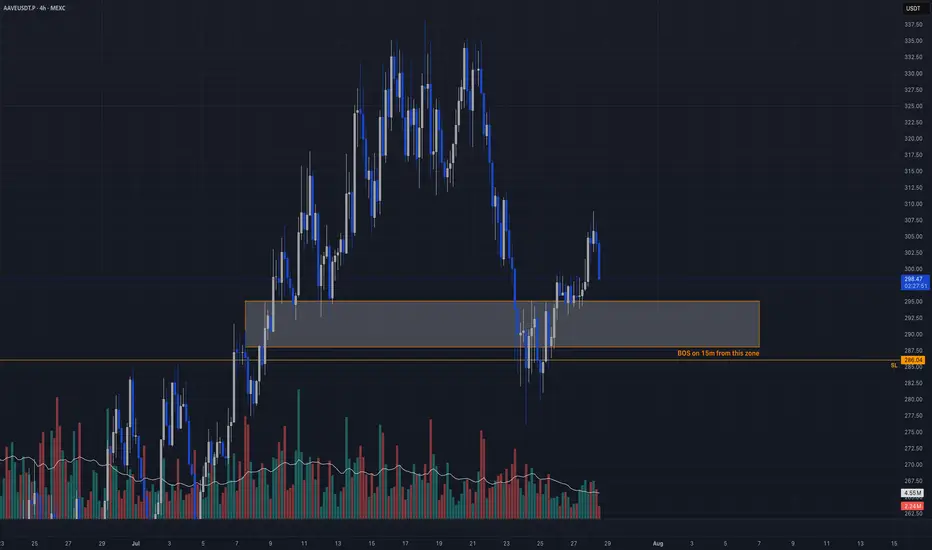
AAVE Reversal + Breaker Block Retest + BOS TriggerCandle Craft fam — we’re watching a sharp reclaim play unfold on AAVEUSDT.P (4H). After a hard drop and sweep of structure, price has returned to a demand zone that’s already printed bullish intent on the lower timeframes.
Now it’s all about precision and confirmation.
⸻
📈 Bias: Long
🧠 Strategy:
AAVEUSDTlet see what will happen my expactation it is. it is doing w and high. there is idm level and below of it exist fvg and order block when you check daily and weekly you will see the level which i mention. There is just one thing it they want to decide this pull back into deeply then right side one to

aave extended pump to $310.8I hopped into this long position a while ago on aave. Time sensitive
Anticipating an impulsive push up to $310.8 before correction again
Sl: 298.96
Will be monitoring closely to potentially exit earlier as its quite high and can reverse soon

AAVE 1H – Trendline Intact, But Will 271 Support Hold?AAVE has been climbing steadily along its ascending trendline, breaking through key resistance levels and tapping 281+. Price is now pulling back toward the 271–272 support zone, which aligns with the first structural retest and sits just above EMA support.
If buyers defend this area, continuation

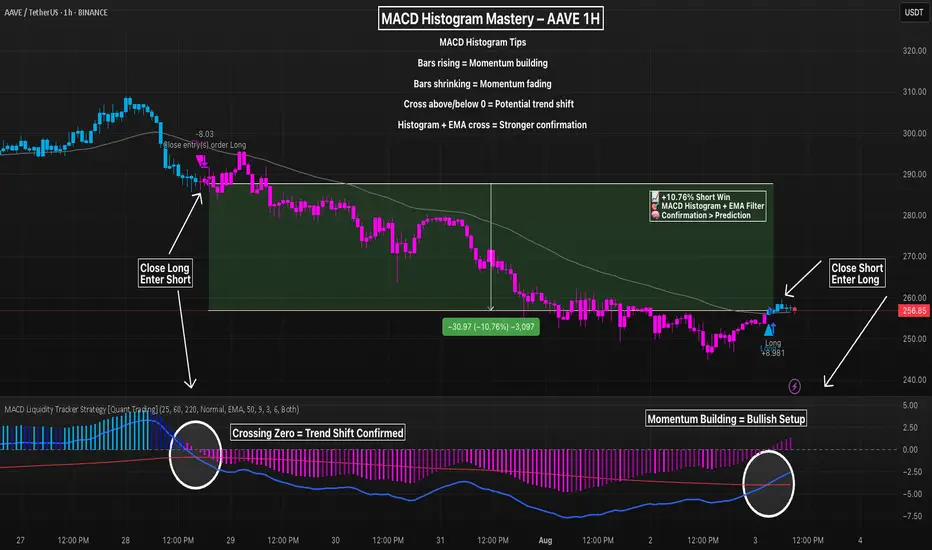
Master MACD Histogram + EMA Filter To Filter Out NoiseThe MACD histogram isn’t just noise — it’s a leading signal for momentum shifts when interpreted correctly. On this AAVE 1H chart, a textbook transition plays out:
– Rising histogram fades → crosses below 0
– EMA filter confirms trend shift
– Strategy flips short at the peak, locks in a +10.76% mov
See all ideas
Summarizing what the indicators are suggesting.
Oscillators
Neutral
SellBuy
Strong sellStrong buy
Strong sellSellNeutralBuyStrong buy
Oscillators
Neutral
SellBuy
Strong sellStrong buy
Strong sellSellNeutralBuyStrong buy
Summary
Neutral
SellBuy
Strong sellStrong buy
Strong sellSellNeutralBuyStrong buy
Summary
Neutral
SellBuy
Strong sellStrong buy
Strong sellSellNeutralBuyStrong buy
Summary
Neutral
SellBuy
Strong sellStrong buy
Strong sellSellNeutralBuyStrong buy
Moving Averages
Neutral
SellBuy
Strong sellStrong buy
Strong sellSellNeutralBuyStrong buy
Moving Averages
Neutral
SellBuy
Strong sellStrong buy
Strong sellSellNeutralBuyStrong buy
Displays a symbol's price movements over previous years to identify recurring trends.
Frequently Asked Questions
The current price of AAVE / TetherUS (AAVE) is 297.36 USDT — it has fallen −2.19% in the past 24 hours. Try placing this info into the context by checking out what coins are also gaining and losing at the moment and seeing AAVE price chart.
AAVE / TetherUS price has risen by 20.68% over the last week, its month performance shows a −2.49% decrease, and as for the last year, AAVE / TetherUS has increased by 218.65%. See more dynamics on AAVE price chart.
Keep track of coins' changes with our Crypto Coins Heatmap.
Keep track of coins' changes with our Crypto Coins Heatmap.
AAVE / TetherUS (AAVE) reached its highest price on May 18, 2021 — it amounted to 668.00 USDT. Find more insights on the AAVE price chart.
See the list of crypto gainers and choose what best fits your strategy.
See the list of crypto gainers and choose what best fits your strategy.
AAVE / TetherUS (AAVE) reached the lowest price of 25.94 USDT on Nov 5, 2020. View more AAVE / TetherUS dynamics on the price chart.
See the list of crypto losers to find unexpected opportunities.
See the list of crypto losers to find unexpected opportunities.
The safest choice when buying AAVE is to go to a well-known crypto exchange. Some of the popular names are Binance, Coinbase, Kraken. But you'll have to find a reliable broker and create an account first. You can trade AAVE right from TradingView charts — just choose a broker and connect to your account.
Crypto markets are famous for their volatility, so one should study all the available stats before adding crypto assets to their portfolio. Very often it's technical analysis that comes in handy. We prepared technical ratings for AAVE / TetherUS (AAVE): today its technical analysis shows the buy signal, and according to the 1 week rating AAVE shows the buy signal. And you'd better dig deeper and study 1 month rating too — it's buy. Find inspiration in AAVE / TetherUS trading ideas and keep track of what's moving crypto markets with our crypto news feed.
AAVE / TetherUS (AAVE) is just as reliable as any other crypto asset — this corner of the world market is highly volatile. Today, for instance, AAVE / TetherUS is estimated as 5.92% volatile. The only thing it means is that you must prepare and examine all available information before making a decision. And if you're not sure about AAVE / TetherUS, you can find more inspiration in our curated watchlists.
You can discuss AAVE / TetherUS (AAVE) with other users in our public chats, Minds or in the comments to Ideas.