$PLL longPiedmont Lithium has been on a tear recently. i would be long here. I would also expect a little bit of digestion around the 16.65 level (+10%), maybe even pulling back a little bit from there. However, if it does break thru the purple resistance line, it should be a quick move to the next resistanc
Next report date
—
Report period
—
EPS estimate
—
Revenue estimate
—
−0.043 AUD
−98.18 M AUD
151.42 M AUD
2.15 B
About Piedmont Lithium Inc.
Sector
Industry
CEO
Keith D. Phillips
Website
Headquarters
Belmont
Founded
2021
ISIN
AU000000PLL5
FIGI
BBG00YY93H52
Piedmont Lithium, Inc. is an exploration stage company, which engages in the exploration and development of mineral properties. The firm focuses on developing and manufacturing battery quality lithium hydroxide for the electric vehicle industry. Its projects include Carolina Lithium, Quebec, and Ghana. The company was founded in 2016 and is headquartered in Belmont, NC.
Related stocks


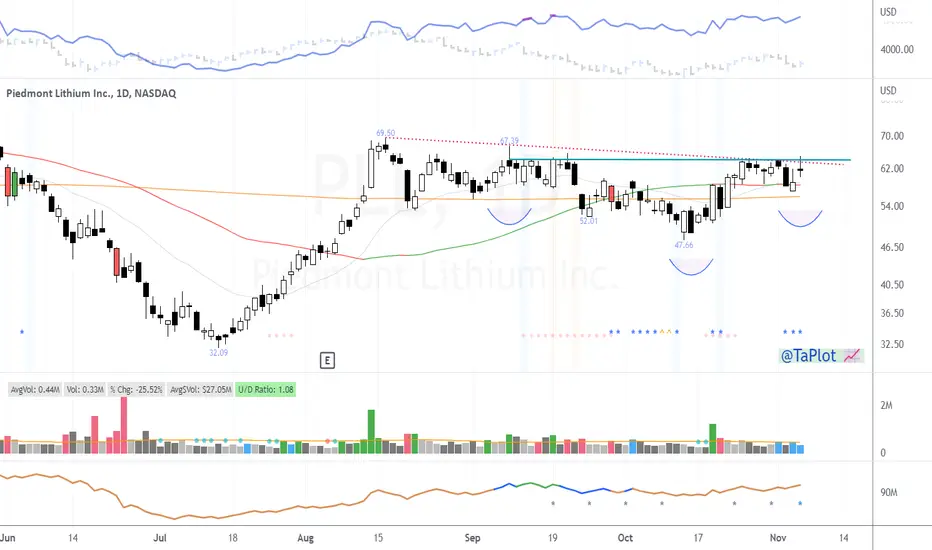
Falling Wedge- BullishAfter finally retracing, the lithium sector is starting to look ready to breakout with buyers starting to step in. Watching LAC & PLL closely here as both are holding massive falling wedges, however, PLL is seemingly forming an ascending triangle as well on its weekly timeframe (See Attached Chart B

PLL - Inverse Head and Shoulders - WeeklyWatching LAC & PLL closely here as the lithium sector heads into earnings. PLL is seemingly holding the same channel after breaking out and retracing back to the channel it's currently holding. PLL is holding the same channel on the 4-Hour timeframe with its Bollinger bands squeezing, along with a B

Piedmont Divergence UpdateHey Folks!
The fact that the current higher low, is disproportionately higher and is more over sold than the previous circled lows, and volume is at 60% of the 10-day, tells me that selling pressure is weakening and I should game plan an entry.
I am looking for bullish divergence to form within th

Piedmont Lithium continuation of Bullish DivergenceHey Folks!
This is an update to my Head and Shoulders bullish divergence idea.
You can see the double bottom Stochastic RSI and continued price increase. Granted it's not the most bullish divergence, but the H&S pattern at this moment, is more likely to play out than not imo. It's not unusual

Piedmont Lithium: Inverse Head & ShoulderI found Bullish Divergence on the 1hr to support a move higher and maybe the H&S plays out.
Happy Trading!
OnePath

Stock Idea: $PLL (10 Feb 2023)$PLL
- Sector showing relative strength $AMLI $LAC
- Tightening up in a flag pattern, while surfing 10 DMA
- On weekly chart, stock has been building multi-month base

$PLL Head and Shoulders Continuation Setup$PLL lithium production industry with a head and shoulders trend continuation pattern.
Right shoulder 12% deep for a technical stop.
Worth watching.
$SGML been on fire in that group.
$PLL Setting UpLithium play setting up. potentially pyramid into this with small position over the high of this cheat area and add to it on new high grounds and potentially market improving.

See all ideas
Summarizing what the indicators are suggesting.
Neutral
SellBuy
Strong sellStrong buy
Strong sellSellNeutralBuyStrong buy
Neutral
SellBuy
Strong sellStrong buy
Strong sellSellNeutralBuyStrong buy
Neutral
SellBuy
Strong sellStrong buy
Strong sellSellNeutralBuyStrong buy
An aggregate view of professional's ratings.
Neutral
SellBuy
Strong sellStrong buy
Strong sellSellNeutralBuyStrong buy
Neutral
SellBuy
Strong sellStrong buy
Strong sellSellNeutralBuyStrong buy
Neutral
SellBuy
Strong sellStrong buy
Strong sellSellNeutralBuyStrong buy
Displays a symbol's price movements over previous years to identify recurring trends.