AUDNZD Looks Bullish – 1.0870 in SightI believe AUD/NZD is currently showing bullish signs and could continue to move higher. The price seems to be gaining strength, and I expect it to reach the 1.0870 level soon, which is about 50 pips above the current price. If the upward momentum continues, this target could be hit soon.
About Australian Dollar / New Zealand Dollar
The two Australasian currencies are represented in the Australian Dollar vs. the New Zealand Dollar pair. High Rollover rates and like geographical locations cause them to often trade alike against other currencies. Because of this the pair is not extremely affected by global factors or trends but instead reacts more to changes in the local economies.
Related currencies

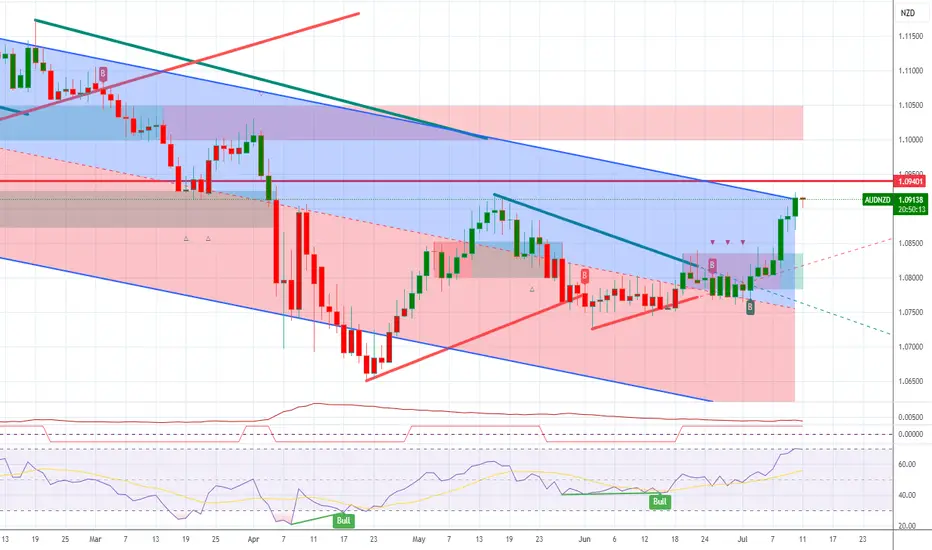
AUD-NZD Short From Resistance! Sell!
Hello,Traders!
AUD-NZD keeps growing
And the pair is overbought
So after it hits the horizontal
Resistance of 1.0921 from
Where we will be expecting
A local bearish correction
Sell!
Comment and subscribe to help us grow!
Check out other forecasts below too!
Disclosure: I am part of Trade

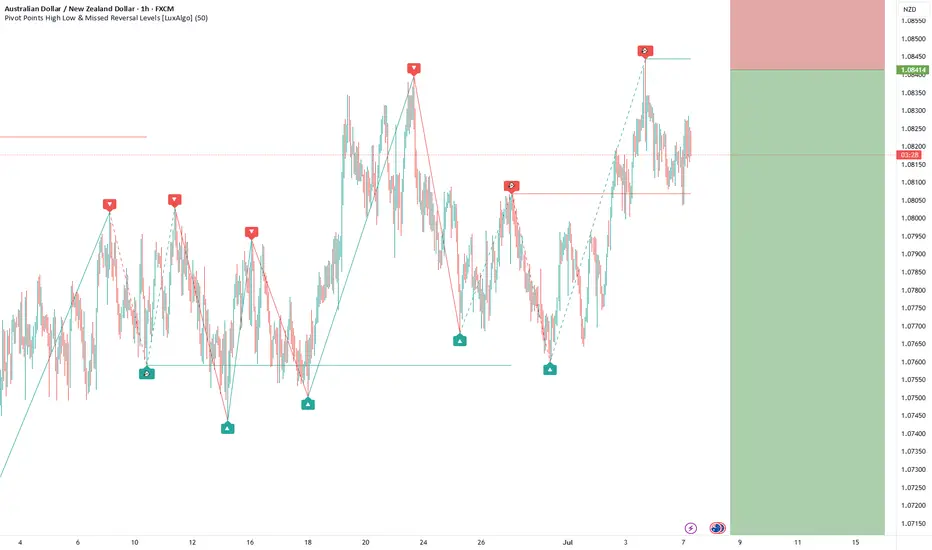
BUY AUDNZD now for a four hour time frame bullish trend continuBUY AUDNZD now for a four hour time frame bullish trend continuation ...............
STOP LOSS: 1.0815
This buy trade setup is based on hidden bullish divergence trend continuation trading pattern ...
Always remember, the trend is your friend, so whenever you can get a signal that the trend will

Congratulations to those of us that took this trade Congratulations to those of us that took this trade

AUDNZD Breakout Retest – Ready for the Next Bullish Leg?
AUDNZD has broken out of a prolonged consolidation box, supported by a demand zone below. Price is currently retesting the breakout level, which often acts as a launchpad for the next move.
🧠 Key Observations:
🔷 Consolidation Breakout – Price cleanly broke above the consolidation range.
🔁 Ret

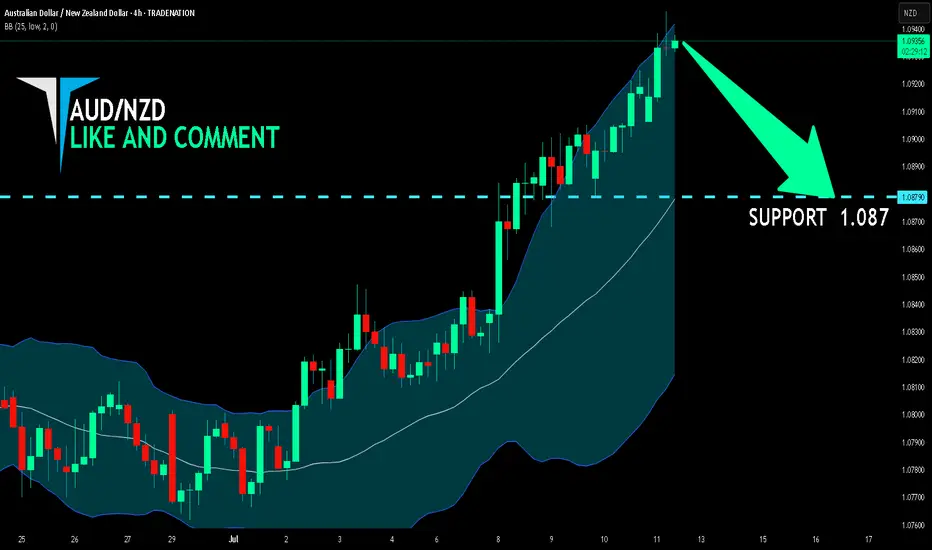
AUD/NZD SHORT FROM RESISTANCE
Hello, Friends!
AUD/NZD pair is in the downtrend because previous week’s candle is red, while the price is clearly rising on the 4H timeframe. And after the retest of the resistance line above I believe we will see a move down towards the target below at 1.087 because the pair is overbought due
AUD-NZD Local Long! Buy!
Hello,Traders!
AUD-NZD is already making
A bullish rebound from the
Horizontal support of 1.0810
So we are locally bullish biased
And we will be expecting a
Further bullish move up
Buy!
Comment and subscribe to help us grow!
Check out other forecasts below too!
Disclosure: I am part of Tr

AUD_NZD SWING SHORT|
✅AUD_NZD has been growing recently
And the pair seems locally overbought
So as the pair is approaching a horizontal resistance of 1.0920
Price decline is to be expected
SHORT🔥
✅Like and subscribe to never miss a new idea!✅
Disclosure: I am part of Trade Nation's Influencer program and r

AUDNZD LongAUDNZD is now net long, and this is it's first break in months.
I am reviewing all AUD pairs.
I’m short AUDNZD.⚠️ AUD looks strong — but I’m short AUDNZD.
China’s bounce helps Aussie for now, but cracks are showing: weak CPI, soft PMI, and looming rate cuts.
🧊 NZD’s not exciting, but it’s stable — and that’s enough when AUD’s running on fumes.
This pair’s climbing a shaky ladder. I’m betting it slips.
📉 Wou
See all ideas
Summarizing what the indicators are suggesting.
Oscillators
Neutral
SellBuy
Strong sellStrong buy
Strong sellSellNeutralBuyStrong buy
Oscillators
Neutral
SellBuy
Strong sellStrong buy
Strong sellSellNeutralBuyStrong buy
Summary
Neutral
SellBuy
Strong sellStrong buy
Strong sellSellNeutralBuyStrong buy
Summary
Neutral
SellBuy
Strong sellStrong buy
Strong sellSellNeutralBuyStrong buy
Summary
Neutral
SellBuy
Strong sellStrong buy
Strong sellSellNeutralBuyStrong buy
Moving Averages
Neutral
SellBuy
Strong sellStrong buy
Strong sellSellNeutralBuyStrong buy
Moving Averages
Neutral
SellBuy
Strong sellStrong buy
Strong sellSellNeutralBuyStrong buy
Displays a symbol's price movements over previous years to identify recurring trends.
Frequently Asked Questions
The current rate of AUDNZD is 1.09398 NZD — it has increased by 0.04% in the past 24 hours. See more of AUDNZD rate dynamics on the detailed chart.
The value of the AUDNZD pair is quoted as 1 AUD per x NZD. For example, if the pair is trading at 1.50, it means it takes 1.5 NZD to buy 1 AUD.
The term volatility describes the risk related to the changes in an asset's value. AUDNZD has the volatility rating of 0.22%. Track all currencies' changes with our live Forex Heatmap and prepare for markets volatility.
The AUDNZD showed a 1.08% rise over the past week, the month change is a 1.35% rise, and over the last year it has decreased by −1.36%. Track live rate changes on the AUDNZD chart.
Learn how you can make money on rate changes in numerous trading ideas created by our community.
Learn how you can make money on rate changes in numerous trading ideas created by our community.
AUDNZD is a minor currency pair, i.e. a popular pair that is not associated with USD. Such pairs are also called cross currency pairs.
Currencies are usually traded through forex brokers — choose the one that suits your needs and go ahead. You can trade AUDNZD right from TradingView charts — just log in to you broker account. Check out the list of our integrated brokers and find the best one for your needs and strategy.
When deciding to buy or sell currency one should keep in mind many factors including current geopolitical situation, interest rates, and other. But before plunging into a deep research, you can start with AUDNZD technical analysis. The technical rating for the pair is buy today, but don't forget that markets can be very unstable, so don't stop here. According to our 1 week rating the AUDNZD shows the strong buy signal, and 1 month rating is buy. See more of AUDNZD technicals for a more comprehensive analysis.