AUDUSD: Bearish Continuation from broken supportThe current setup is a clean example of a trend continuation play. Price recently broke decisively below a structure zone, this break and retest now flips the narrative, what once was a buy zone is now an opportunity for short entries.
Following the aggressive move down, price now began pulling bac
About Australian Dollar / U.S. Dollar
The Australian Dollar and the US Dollar pair belong the Majors, a group of the most popular traded pairs in the world. This pair's popularity soared because traders were attracted to the interest rate differential of the pair. This has waned in recent years due to economic volatility worldwide.
Related currencies

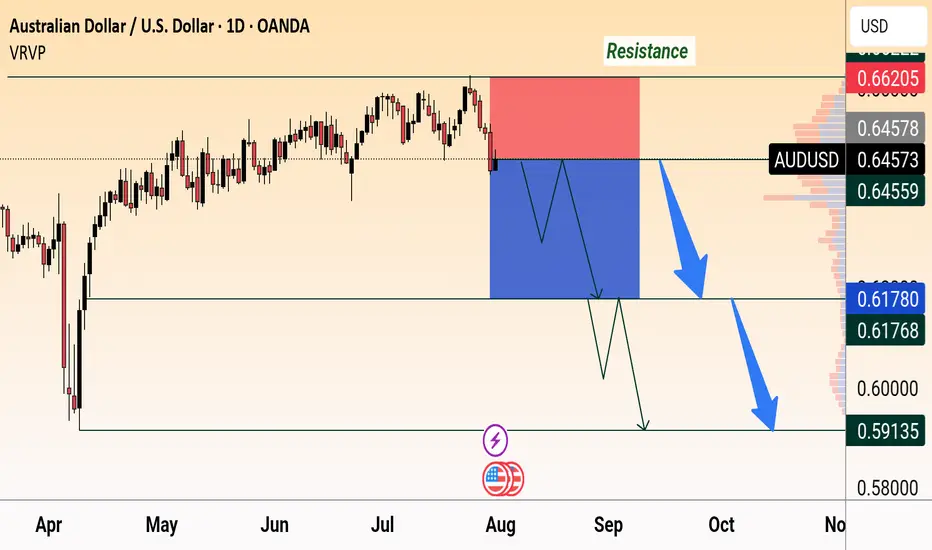
AUD/USD Bearish OutlookAUD/USD faces strong resistance at 0.6620 and is showing bearish momentum. Price is expected to drop below 0.6450 with targets near 0.6178 and 0.5913, following a possible consolidation.
AUDUSD Breakout and Potential RetraceHey Traders, in today's trading session we are monitoring AUDUSD for a buying opportunity around 0.64700 zone, AUDUSD was trading in a downtrend and successfully managed to break it out. Currently is in a correction phase in which it is approaching the retrace area at 0.64700 support and resistance

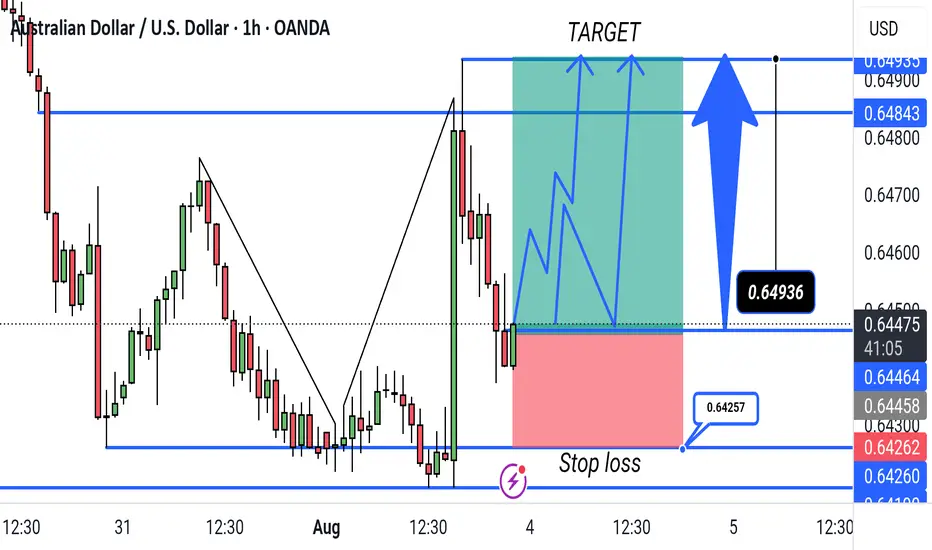
"AUD/USD Bullish Breakout Setup – 1H Timeframe. This chart shows a bullish trade setup for AUD/USD on the 1-hour timeframe. The entry is near 0.64464, with a target at 0.64843 and a stop loss at 0.64257. The trade aims to capitalize on a potential upward breakout following a support bounce.
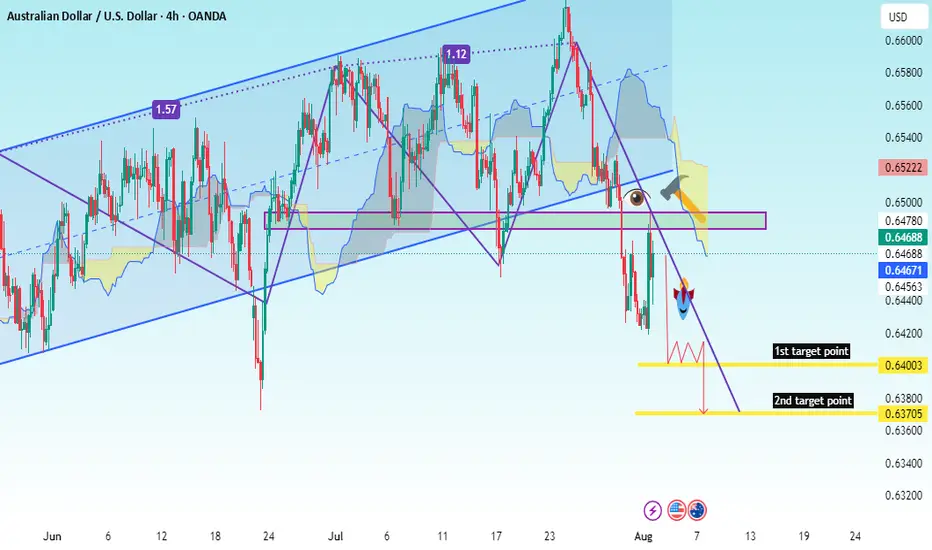
AUDUSD Potential UpsidesHey Traders, in today's trading session we are monitoring AUDUSD for a buying opportunity around 0.64000 zone, AUDUSD is trading in an uptrend and currently is in a correction phase in which it is approaching the trend at 0.64000 support and resistance area.
Trade safe, Joe.

Sell the Rip? AUDUSD Retest Zone AlertHello TradingView Family / Fellow Traders. This is Richard, also known as theSignalyst.
📈AUDUSD has been overall bearish , trading within the falling red channel and it is currently retesting the upper bound of the channel.
Moreover, it is rejecting a structure marked in blue.
📚 As per my tradi

AUDUSD Potential UpsidesHey Traders, in today's trading session we are monitoring AUDUSD for a buying opportunity around 0.64900 zone, AUDUSD is trading in an uptrend and currently is in a correction phase in which it is approaching the trend at 0.64900 support and resistance area.
Trade safe, Joe.

30.07.25 Morning ForecastPairs on Watch -
FX:AUDUSD
FX:NZDUSD
FX:EURUSD
A short overview of the instruments I am looking at for today, multi-timeframe analysis down to what I will be looking at for an entry. Enjoy!

AUD/USD Bearish Breakout – Retest & Sell Continuation SetupAUD/USD (Australian Dollar vs. US Dollar)
Likely a 4H (4-hour) timeframe based on candlestick density and scale.
---
2. Structure & Patterns:
Rising wedge/ascending channel: Already broken to the downside.
Breakout zone: Around 0.6480–0.6500, clearly marked and now acting as resistance.
Rete
AUD/USD) Bearish Trend Read The captionSMC Trading point update
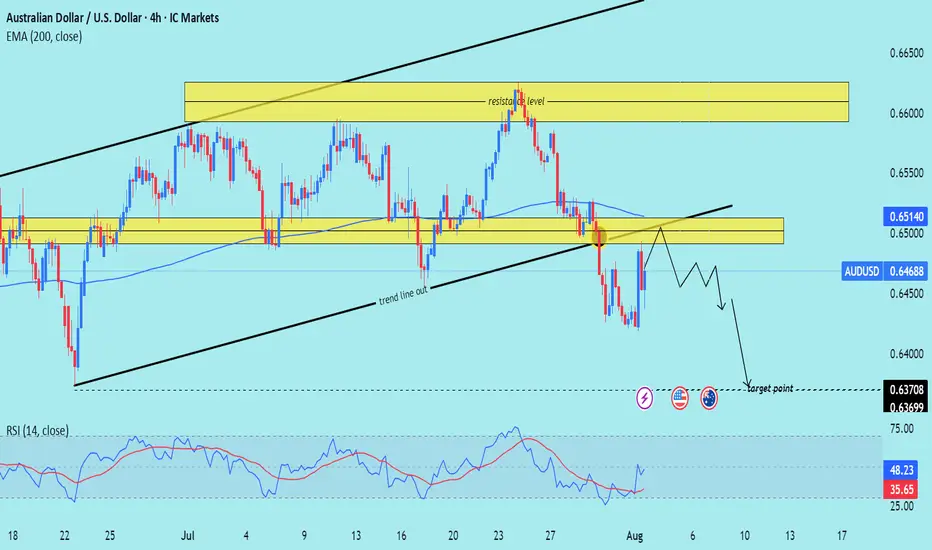
Technical analysis of AUD/USD (Australian Dollar / U.S. Dollar) on the 4-hour timeframe, with a likely setup for further downside. Here's a breakdown of the idea:
---
Technical Summary
Pair: AUD/USD
Timeframe: 4H
Current Price: 0.64688
EMA 200: 0.65140 (price is
See all ideas
Displays a symbol's price movements over previous years to identify recurring trends.
Frequently Asked Questions
The value of the AUDUSD pair is quoted as 1 AUD per x USD. For example, if the pair is trading at 1.50, it means it takes 1.5 USD to buy 1 AUD.
AUDUSD is a major currency pair, i.e. a popular currency paired with USD.
Currencies are usually traded through forex brokers — choose the one that suits your needs and go ahead. You can trade AUDUSD right from TradingView charts — just log in to you broker account. Check out the list of our integrated brokers and find the best one for your needs and strategy.