AUD/USD - Triangle Breakout (02.06.2025)The AUD/USD pair on the M30 timeframe presents a Potential Buying Opportunity due to a recent Formation of a Triangle Pattern. This suggests a shift in momentum towards the upside and a higher likelihood of further advances in the coming hours.
Possible Long Trade:
Entry: Consider Entering A Long
About Australian Dollar / U.S. Dollar
The Australian Dollar and the US Dollar pair belong the Majors, a group of the most popular traded pairs in the world. This pair's popularity soared because traders were attracted to the interest rate differential of the pair. This has waned in recent years due to economic volatility worldwide.

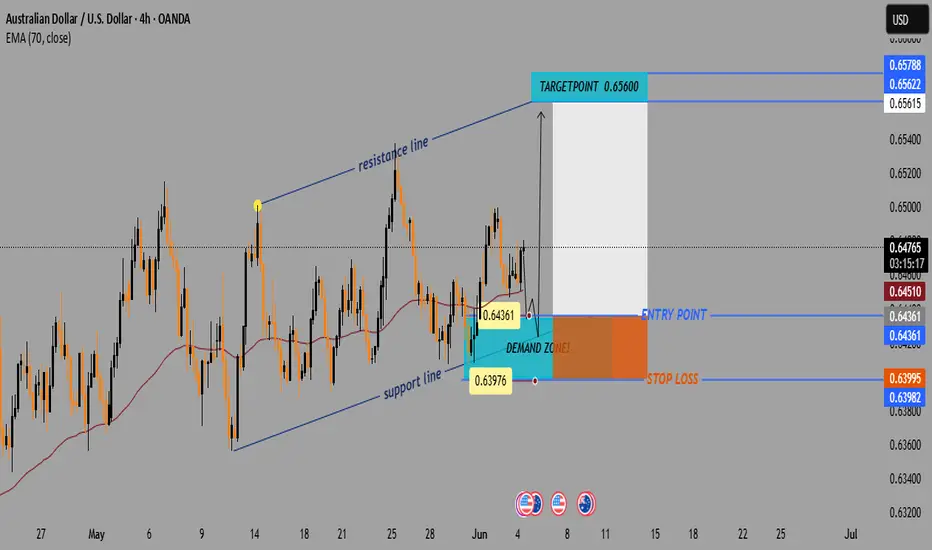
AUD/USD Bullish Setup: Demand Zone Bounce Toward 0.65600📈 Price Channel Analysis
🔼 The pair is moving within an ascending channel: • Support Line 🟦 – lower trendline showing bullish structure
* Resistance Line 🟥 – upper boundary acting as potential target
💡 This suggests bullish momentum is intact unless the price breaks below support.
📌 Key Trade Lev
Bearish drop off pullback resistance?GBP/USD has rejected off the pivot and could drop to the 1st support, which aligns with the 127.2% Fibonacci extension.
Pivot: 0.6446
1st Support: 0.6358
1st Resistance: 0.6538
Risk Warning:
Trading Forex and CFDs carries a high level of risk to your capital and you should only trade with money

#AUDUSD:We are yet to see weaken USD! AUDUSD to make yearly highAUDUSD hasn’t seen strong bullish volume yet, but tomorrow’s NFP will be crucial for determining the future trend of the AUDUSD. Based on your analysis, you can set multiple targets.
If you like our work and want to support us, you can do so by following us:
-Liking our ideas
-Commenting on our ide

02.06.25 Morning ForecastPairs on Watch -
FX:AUDUSD
FX:USDJPY
FX:EURGBP
A short overview of the instruments I am looking at for today, multi-timeframe analysis down to what I will be looking at for an entry. Enjoy!

AUDUSD: Complex Price Action with Bullish BiasAUDUSD: Complex Price Action with Bullish Bias
AUDUSD is exhibiting a complex price pattern, often characterized by small and choppy movements. The chart shows that the price has been repeatedly halted near the current zone.
If this level holds, the likelihood of a bullish continuation increases,

AUD/USD.1Day chart patternAUDUSD 1 DAY CHART
📊 Observations:
Price has broken out of a resistance zone around 0.65500.
There are two key targets drawn on the chart:
1. First target zone: ~0.66800
2. Second (major) target zone: ~0.69000
---
🎯 Target Estimations:
Using the breakout base near 0.65000 and measuring

05.06.25 Morning ForecastPairs on Watch -
FX:AUDUSD
OANDA:XPTUSD
A short overview of the instruments I am looking at for today, multi-timeframe analysis down to what I will be looking at for an entry. Enjoy!

AUDUSD The Target Is DOWN! SELL!
My dear friends,
My technical analysis for AUDUSD is below:
The market is trading on 0.6477 pivot level.
Bias - Bearish
Technical Indicators: Both Super Trend & Pivot HL indicate a highly probable Bearish continuation.
Target - 0.6446
Recommended Stop Loss - 0.6495
About Used Indicators:
A pi
06.06.25 Morning ForecastPairs on Watch -
FX:EURUSD
FX:AUDUSD
FX:USDJPY
FX:AUDCAD
A short overview of the instruments I am looking at for today, multi-timeframe analysis down to what I will be looking at for an entry. Enjoy!

See all ideas
Displays a symbol's price movements over previous years to identify recurring trends.
Related currencies
Frequently Asked Questions
The value of the AUDUSD pair is quoted as 1 AUD per x USD. For example, if the pair is trading at 1.50, it means it takes 1.5 USD to buy 1 AUD.
AUDUSD is a major currency pair, i.e. a popular currency paired with USD.
Currencies are usually traded through forex brokers — choose the one that suits your needs and go ahead. You can trade AUDUSD right from TradingView charts — just log in to you broker account. Check out the list of our integrated brokers and find the best one for your needs and strategy.