AUD/USD - Breakout (25.07.2025)The AUD/USD Pair on the M30 timeframe presents a Potential Selling Opportunity due to a recent Formation of a Trendline Pattern. This suggests a shift in momentum towards the downside in the coming hours.
Possible Short Trade:
Entry: Consider Entering A Short Position around Trendline Of The Pattern.
Target Levels:
1st Support – 0.6551
2nd Support – 0.6513
🎁 Please hit the like button and
🎁 Leave a comment to support for My Post !
Your likes and comments are incredibly motivating and will encourage me to share more analysis with you.
Best Regards, KABHI_TA_TRADING
Thank you.
Disclosure: I am part of Trade Nation's Influencer program and receive a monthly fee for using their TradingView charts in my analysis.
AUDUSD trade ideas

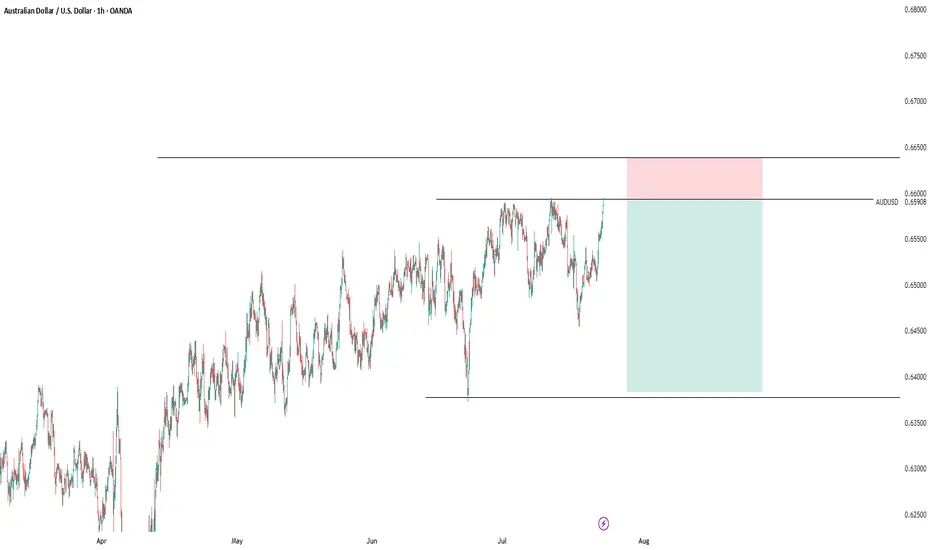
AUD/USD Bearish Reversal Setup (1H Chart) Analysis:The pair has recently broken down from the ascending channel (highlighted in blue), indicating a potential trend reversal.
A lower high has formed after the peak near 0.66200, followed by a sharp drop, confirming bearish momentum.
Current price is hovering around 0.6573, and the structure shows a bearish flag/pullback, hinting at another drop.
Bearish Target Zones:
1. First Support/TP1: 0.6550 – 0.6549 (short-term support zone)
2. Second Support/TP2: 0.6510 – 0.6515 (major support level and key target)
Confirmation:
Watch for price to reject any bullish pullbacks below the broken channel and drop past 0.6550 for stronger confirmation of the move toward 0.6510.
Bias: Bearish
Timeframe: 1H
Invalidation Level: Break back above 0.6620 resistance zone.

AUDUSD Sells In sells based on H4 bearish structure. H4 Double top, 61.8% Daily Retracement & evening star pattern. Im aiming for the daily support of 0.64160.

AUDUSD: Sell The Rip!Welcome back to the Weekly Forex Forecast for the week of July 21-25th.
In this video, we will analyze the following FX market:
AUDUSD
AUDUSD has been difficult to trade, as it chops its slow grind upwards. Last week it gave a bearish close. With the USD expected to continue to gain strength, look for sells directed to the liquidity lows in AUDUSD.
Enjoy!
May profits be upon you.
Leave any questions or comments in the comment section.
I appreciate any feedback from my viewers!
Like and/or subscribe if you want more accurate analysis.
Thank you so much!
Disclaimer:
I do not provide personal investment advice and I am not a qualified licensed investment advisor.
All information found here, including any ideas, opinions, views, predictions, forecasts, commentaries, suggestions, expressed or implied herein, are for informational, entertainment or educational purposes only and should not be construed as personal investment advice. While the information provided is believed to be accurate, it may include errors or inaccuracies.
I will not and cannot be held liable for any actions you take as a result of anything you read here.
Conduct your own due diligence, or consult a licensed financial advisor or broker before making any and all investment decisions. Any investments, trades, speculations, or decisions made on the basis of any information found on this channel, expressed or implied herein, are committed at your own risk, financial or otherwise.

AUDUSD Potential UpsidesHey Traders, in tomorrow's trading session we are monitoring AUDUSD for a buying opportunity around 0.64200 zone, AUDUSD is trading in an uptrend and currently is in a correction phase in which it is approaching the trend at 0.64200 support and resistance area.
Trade safe, Joe.

AUDUSD Engineered to Drop?🧠MJTrading:
📸 Viewing Tip:
🛠️ Some layout elements may shift depending on your screen size.
🔗 View the fixed high-resolution chart here:
🔻 OANDA:AUDUSD – Tagged the Top | Smart Money Eyes Lower Levels??
📍 Perfect Respect of Channel Structure
AUDUSD has just kissed the upper boundary of a long-standing ascending channel, showing sharp rejection — a sign that premium pricing might now shift toward discount levels.
📈 The aggressive push into the highs likely aimed to clear buy stops — fulfilling smart money objectives before a potential reversal.
📉 And here’s the subtle clue:
Just below the last bullish candle lies a thin slide — a structural weakness.
If price breaks and closes below that full body bearish candle (Below 0.66000), the market could slip fast, unleashing a momentum-driven drop into the first liquidity zone (0.6520s).
🧠 For smart money lovers, this is the classic:
Sweep → Trap → Slide
📏 And for fans of parallelism, the chart’s geometry offers a rare beauty — lines in harmony, structure in rhythm, and opportunity in alignment.
🔍 What to Watch For:
Break below 0.66000 (last candle body) = entry signal
0.6520–0.6540: first liquidity zone
0.6400–0.6300: deeper cleanout, if bearish pressure sustains
Inset: DXY bouncing from long-term demand supports bearish thesis
Manage your risk wisely...
For Lower time frame traders:
Psychology Always Matters:
(Click on the pictures for caption and concepts)
#AUDUSD #SmartMoney #LiquiditySweep #ChannelTrading #ChartDesigner #MJTrading #PriceAction #Forex

AUD/USD Bulls Eye BreakoutThe Australian Dollar surged more than 1.8% this week with AUD/USD now testing multi-month uptrend resistance at fresh yearly highs. A four-day rally takes price into confluent resistance at the September low / upper parallel at 6622- The focus is on today’s close with the immediate advance vulnerable while below this key slope. Subsequent resistance objectives eyed at the 2019 low at 6671 and the 78.6% retracement of the broader 2024 decline at 6723.
Initial support rests with the July open at 6581 and is backed by the May high-day close (HDC) / weekly open at 6486-6506. Losses would need to be limited to this region for the late-June advance to remain viable (near-term bullish invalidation). Subsequent support seen at the June low-day close (LDC) at 6458 with a break below 6350 ultimately needed to suggest a more significant high is in place / larger reversal is underway.
Bottom line: A breakout of the July opening-range takes AUD/USD into confluent uptrend resistance- risk for topside exhaustion / price inflection here. From a trading standpoint, a good zone to reduce portions of long-exposure / raise protective stops – losses shudl be limited to 6486 IF price is heading higher on this stretch with a close above this slope needed to fuel the next leg of the advance.
Keep in mind the FOMC interest rate decision is on tap next week with Core Personal Consumption Expenditures (PCE) and Non-Farm Payrolls (NFPs) slated into the monthly cross. Stay nimble into the releases and watch the weekly closes here.
-MB

AUDUSD • Premium Supply Zone (Resistance):
• Price is projected to revisit the supply zone between 0.65650–0.65800, which previously led to strong bearish displacement.
• This zone is likely to attract institutional sell orders.
• Current Price Structure:
• Market is retracing upward within a bearish internal structure.
• Expectation: A “lower high” formation before a continuation to the downside.
• Sell Setup Projection:
• Price likely to induce buyers near the mid-range before sweeping them and shifting bearish.
• Anticipated move: Price into premium zone → rejection → continuation toward 0.64700 demand area (gray box).
• Liquidity Engineering:
• Potential internal liquidity being built up to fuel a deeper drop.
• Smart money may use this retracement to trap breakout traders before driving price down.
⸻
🧠 Smart Money Narrative:
1. Retracement into premium for better risk-to-reward shorts.
2. Inducement of breakout buyers before reversal.
3. Short continuation toward demand zone and potential liquidity pockets below.
4. Strategic zone to watch: 0.65700 area for high-probability shorts

LOOKING FOR SHORTS ON AUD/USDWith Weekly time frame showing a strong downtrend then it is expected that lower timeframe aligns with it andso the Daily and 4HR are showing exactly that .
Double top formed and price trading in the area of our fib GOLDEN ZONE, We are expecting a decline in AUD potentially this upcoming week
AUD/USD Sell SetupOANDA:AUDUSD
Timeframe: m30
Entry: 0.66151
SL: 0.66266
TP1: 0.66033
TP2: 0.65914
TP4: 0.65681
📊 Setup Rationale
🔺 Channel Top Rejection (8H Overlay) Price has touched the upper boundary of a descending channel visible on the 8-hour chart. This zone has historically acted as a strong resistance, increasing the probability of a reversal.
🧱 Local Structure (30min) Entry aligns with a minor double top (in lower TFs) and bearish momentum. The tight SL allows for a high R:R profile.
🔄 Momentum Shift Watch for bearish engulfing or rejection wick on lower timeframes to confirm entry.
#MJTrading #Forex #AUDUSD #Sell
Psychology always matters:

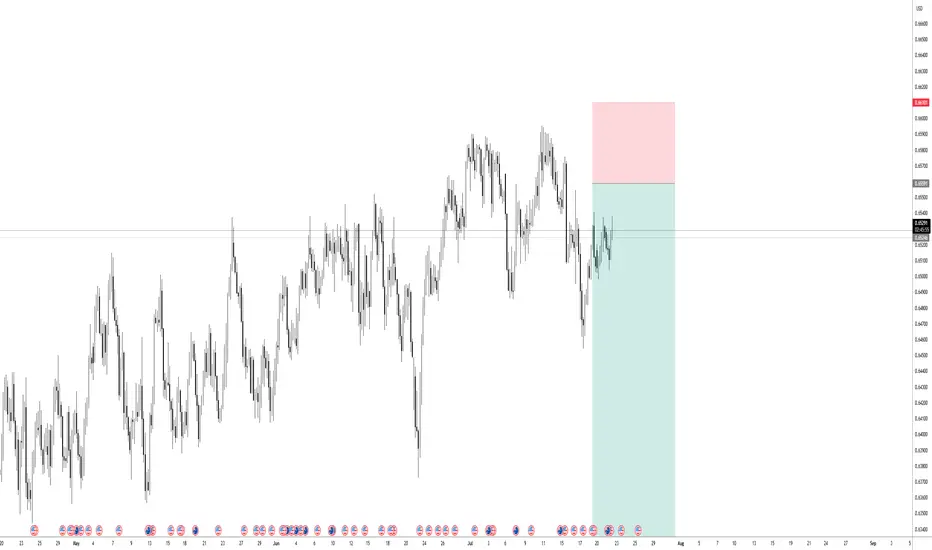
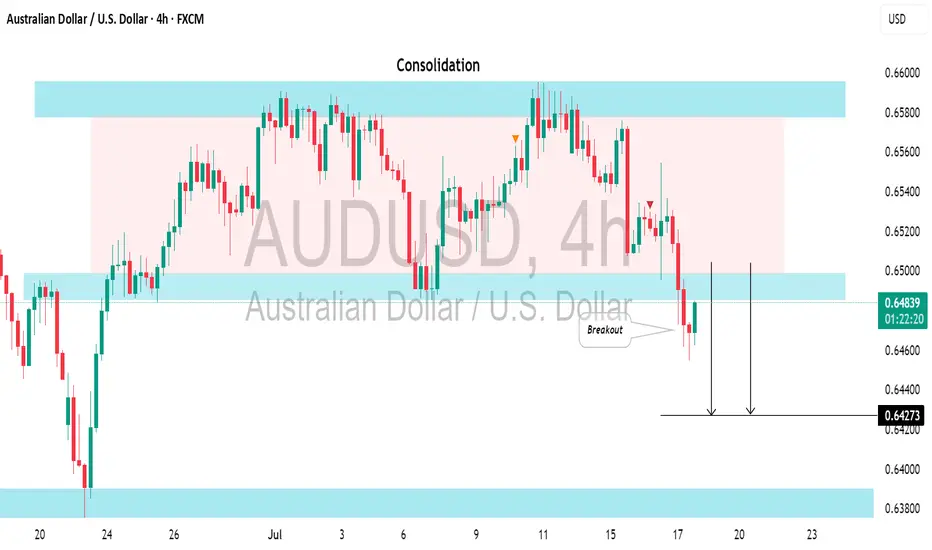
AUDUSD: Strong Bearish Signal?!The AUDUSD appears to be bearish following a few weeks of consolidation.
And a bearish breakout from the support of a sideways range serves as a strong confirmation signal.
We can anticipate a decline to at least the 0.6427 level.
Buy idea!Hello everyone. as you see market returned from middle of nowhere and we need an LFT zone. Lets go up. BE happy and have a wealthy life(wink)

AUDUSD: Bearish Continuation is Highly Probable! Here is Why:
The charts are full of distraction, disturbance and are a graveyard of fear and greed which shall not cloud our judgement on the current state of affairs in the AUDUSD pair price action which suggests a high likelihood of a coming move down.
Disclosure: I am part of Trade Nation's Influencer program and receive a monthly fee for using their TradingView charts in my analysis.
❤️ Please, support our work with like & comment! ❤️

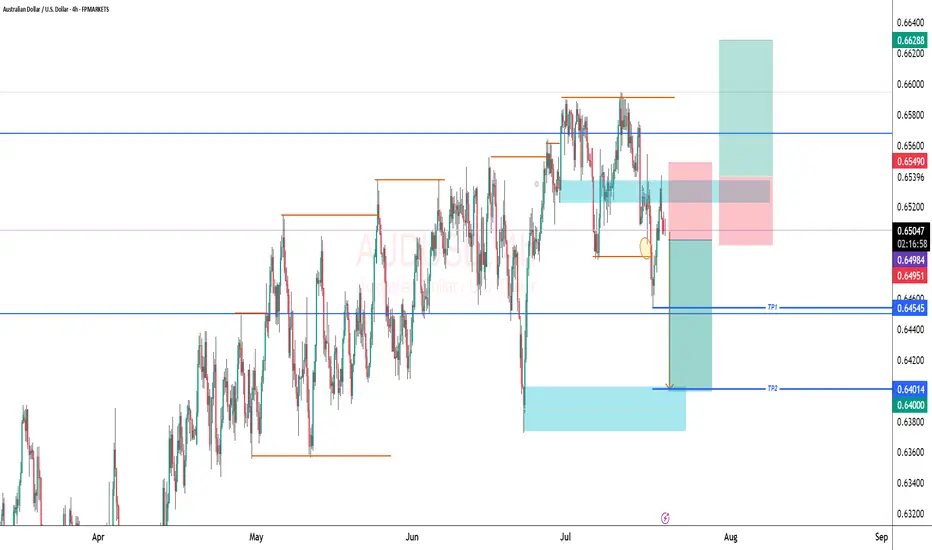
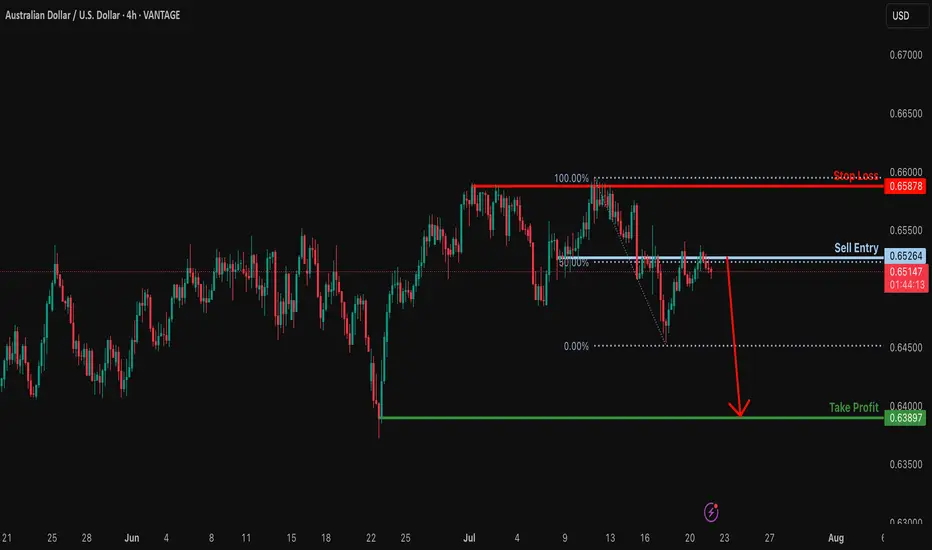
Could the Aussie drop from here?The price is reacting off the resistance level which is a pullback resistance that aligns with the 50% Fibonacci retracement and could drop from this level to our take profit.
Entry: 0.6526
Why we like it:
There is a pullback resistance that lines up with the 50% Fibonacci retracement.
Stop loss: 0.6587
Why we like it:
There is a multi swing high resistance.
Take profit: 0.6389
Why we like it:
There is a pullback support.
Enjoying your TradingView experience? Review us!
Please be advised that the information presented on TradingView is provided to Vantage (‘Vantage Global Limited’, ‘we’) by a third-party provider (‘Everest Fortune Group’). Please be reminded that you are solely responsible for the trading decisions on your account. There is a very high degree of risk involved in trading. Any information and/or content is intended entirely for research, educational and informational purposes only and does not constitute investment or consultation advice or investment strategy. The information is not tailored to the investment needs of any specific person and therefore does not involve a consideration of any of the investment objectives, financial situation or needs of any viewer that may receive it. Kindly also note that past performance is not a reliable indicator of future results. Actual results may differ materially from those anticipated in forward-looking or past performance statements. We assume no liability as to the accuracy or completeness of any of the information and/or content provided herein and the Company cannot be held responsible for any omission, mistake nor for any loss or damage including without limitation to any loss of profit which may arise from reliance on any information supplied by Everest Fortune Group.
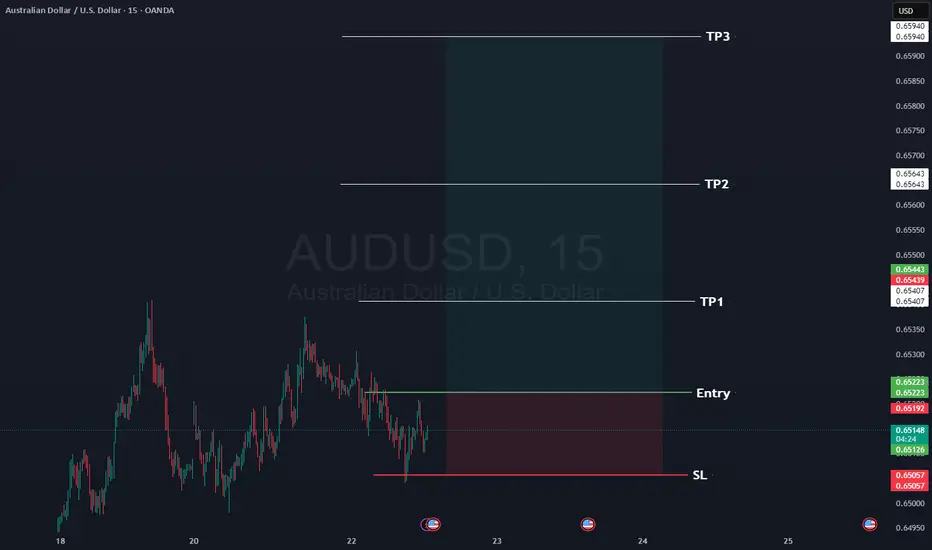
AUDUSD Here is our signal for AUDUSD
Occasionally we give a free signal, so here's AUDUSD long.
Rules:
1- Wait for the 15 minute to close with momentum above the entry, ideally we want a re-test of the entry.
2- at TP1 move your SL to entry.
3- If you want to close at TP2 then do so.
📊Entry: 0.65223
⚠️SL: 0.65057
✔️TP1: 0.65407
✔️TP2: 0.65643
✔️TP3: 0.65940
Happy Trading,
Sarah
AUD_USD BULLISH BREAKOUT|LONG|
✅AUD_USD is going up
Now and the pair made a bullish
Breakout of the key horizontal
Level of 0.6590 and the breakout
Is confirmed so we are bullish
Biased and we will be expecting
A further bullish move up
LONG🚀
✅Like and subscribe to never miss a new idea!✅
Disclosure: I am part of Trade Nation's Influencer program and receive a monthly fee for using their TradingView charts in my analysis.

Signal-to-Noise Ratio: The Most Misunderstood Truth in Trading█ Signal-to-Noise Ratio: The Most Misunderstood Truth in Quant Trading
Most traders obsess over indicators, signals, models, and strategies.
But few ask the one question that defines whether any of it actually works:
❝ How strong is the signal — compared to the noise? ❞
Welcome to the concept of Signal-to-Noise Ratio (SNR) — the invisible force behind why some strategies succeed and most fail.
█ What Is Signal-to-Noise Ratio (SNR)?
⚪ In simple terms:
Signal = the real, meaningful, repeatable part of a price move
Noise = random fluctuations, market chaos, irrelevant variation
SNR = Signal Strength / Noise Level
If your signal is weak and noise is high, your edge gets buried.
If your signal is strong and noise is low, you can extract alpha with confidence.
In trading, SNR is like trying to hear a whisper in a hurricane. The whisper is your alpha. The hurricane is the market.
█ Why SNR Matters (More Than Sharpe, More Than Accuracy)
Most strategies die not because they’re logically flawed — but because they’re trying to extract signal in a low SNR environment.
Financial markets are dominated by noise.
The real edge (if it exists) is usually tiny and fleeting.
Even strong-looking backtests can be false positives created by fitting noise.
Every quant failure story you’ve ever heard — overfitting, false discoveries, bad AI models — starts with misunderstanding the signal-to-noise ratio.
█ SNR in the Age of AI
Machine learning struggles in markets because:
Most market data has very low SNR
The signal changes over time (nonstationarity)
AI is powerful enough to learn anything — including pure noise
This means unless you’re careful, your AI will confidently “discover” patterns that have no predictive value whatsoever.
Smart quants don’t just train models. They fight for SNR — every input, feature, and label is scrutinized through this lens.
█ How to Measure It (Sharpe, t-stat, IC)
You can estimate a strategy’s SNR with:
Sharpe Ratio: Signal = mean return, Noise = volatility
t-Statistic: Measures how confident you are that signal ≠ 0
Information Coefficient (IC): Correlation between forecast and realized return
👉 A high Sharpe or t-stat suggests strong signal vs noise
👉 A low value means your “edge” might just be noise in disguise
█ Real-World SNR: Why It's So Low in Markets
The average daily return of SPX is ~0.03%
The daily standard deviation is ~1%
That's signal-to-noise of 1:30 — and that's for the entire market, not a niche alpha.
Now imagine what it looks like for your scalping strategy, your RSI tweak, or your AI momentum model.
This is why most trading signals don’t survive live markets — the noise is just too loud.
█ How to Build Strategies With Higher SNR
To survive as a trader, you must engineer around low SNR. Here's how:
1. Combine signals
One weak signal = low SNR
100 uncorrelated weak signals = high aggregate SNR
2. Filter noise before acting
Use volatility filters, regime detection, thresholds
Trade only when signal strength exceeds noise level
3. Test over longer horizons
Short-term = more noise
Long-term = signal has more time to emerge
4. Avoid excessive optimization
Every parameter you tweak risks modeling noise
Simpler systems = less overfit = better SNR integrity
5. Validate rigorously
Walk-forward, OOS testing, bootstrapping — treat your model like it’s guilty until proven innocent
█ Low SNR = High Uncertainty
In low-SNR environments:
Alpha takes years to confirm (t-stat grows slowly)
Backtests are unreliable (lucky noise often looks like skill)
Drawdowns happen randomly (even good strategies get wrecked short-term)
This is why experience, skepticism, and humility matter more than flashy charts.
If your signal isn’t strong enough to consistently rise above noise, it doesn’t matter how elegant it looks.
█ Overfitting Is What Happens When You Fit the Noise
If you’ve read Why Your Backtest Lies , you already know the dangers of overfitting — when a strategy is tuned too perfectly to historical data and fails the moment it meets reality.
⚪ Here’s the deeper truth:
Overfitting is the natural consequence of working in a low signal-to-noise environment.
When markets are 95% noise and you optimize until everything looks perfect?
You're not discovering a signal. You're just fitting past randomness — noise that will never repeat the same way again.
❝ The more you optimize in a low-SNR environment, the more confident you become in something that isn’t real. ❞
This is why so many “flawless” backtests collapse in live trading. Because they never captured signal — they captured noise.
█ Final Word
Quant trading isn’t about who can code the most indicators or build the deepest neural nets.
It’s about who truly understands this:
❝ In a world full of noise, only the most disciplined signal survives. ❞
Before you build your next model, launch your next strategy, or chase your next setup…
Ask this:
❝ Am I trading signal — or am I trading noise? ❞
If you don’t know the answer, you're probably doing the latter.
-----------------
Disclaimer
The content provided in my scripts, indicators, ideas, algorithms, and systems is for educational and informational purposes only. It does not constitute financial advice, investment recommendations, or a solicitation to buy or sell any financial instruments. I will not accept liability for any loss or damage, including without limitation any loss of profit, which may arise directly or indirectly from the use of or reliance on such information.
All investments involve risk, and the past performance of a security, industry, sector, market, financial product, trading strategy, backtest, or individual's trading does not guarantee future results or returns. Investors are fully responsible for any investment decisions they make. Such decisions should be based solely on an evaluation of their financial circumstances, investment objectives, risk tolerance, and liquidity needs.

audusd sell signal. Don't forget about stop-loss.
Write in the comments all your questions and instruments analysis of which you want to see.
Friends, push the like button, write a comment, and share with your mates - that would be the best THANK YOU.
P.S. I personally will open entry if the price will show it according to my strategy.
Always make your analysis before a trade
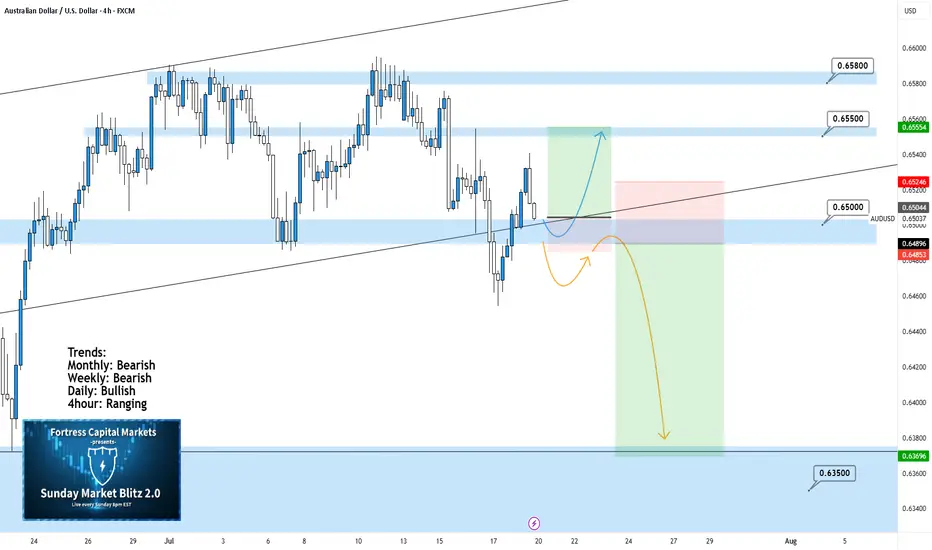
AUDUSD 4Hour TF - July 20th, 2025AUDUSD 7/20/2025
AUDUSD 4hour Neutral idea
Monthly - Bearish
Weekly - Bearish
Dailly - Bullish
4hour - Ranging
We’re looking at a fairly large range here on AU and although the higher timeframe suggests a potential bearish move, I am unsure until we have some clarity around 0.65000. Here are two scenarios that break down what could happen this week and how 0.65000 plays into it:
Range Continuation - Since late June we have seen price action establish this large range and stick to it (0.65800 Resistance & 0.65000 Support).
Currently, we can see price action attempting to break 0.65000 support but it has not done so yet. If we don’t break below 0.65000 early this week it is very likely we will see a rally into the top of the range.
Bearish Breakout - This is the setup we want to see play out this week as it presents a beauty of a trade.
For us to see AU as bearish on the 4hour we need to see a clear break below 0.65000 with a confirmed lower high below. If this happens look to target toward major support levels like 0.63500 area.
Market Analysis: AUD/USD Climbs as Dollar WeakensMarket Analysis: AUD/USD Climbs as Dollar Weakens
AUD/USD started a decent increase above the 0.6520 level.
Important Takeaways for AUD/USD Analysis Today
- The Aussie Dollar rebounded after forming a base above the 0.6450 level against the US Dollar.
- There is a connecting bullish trend line forming with support at 0.6540 on the hourly chart of AUD/USD.
AUD/USD Technical Analysis
On the hourly chart of AUD/USD at FXOpen, the pair started a fresh increase from the 0.6450 support. The Aussie Dollar was able to clear the 0.6500 resistance to move into a positive zone against the US Dollar.
There was a close above the 0.6550 resistance and the 50-hour simple moving average. Finally, the pair tested the 0.6565 zone. A high was formed near 0.6564 and the pair recently started a consolidation phase.
On the downside, initial support is near the 0.6540 level. There is also a connecting bullish trend line forming with support at 0.6540. It is close to the 23.6% Fib retracement level of the upward move from the 0.6454 swing low to the 0.6564 high.
The next major support is near the 0.6495 zone. If there is a downside break below it, the pair could extend its decline toward the 0.6480 level. It is close to the 76.4% Fib retracement level.
Any more losses might signal a move toward 0.6450. On the upside, the AUD/USD chart indicates that the pair is now facing resistance near 0.6565. The first major resistance might be 0.6575. An upside break above the 0.6575 resistance might send the pair further higher.
The next major resistance is near the 0.6600 level. Any more gains could clear the path for a move toward the 0.6650 resistance zone.
This article represents the opinion of the Companies operating under the FXOpen brand only. It is not to be construed as an offer, solicitation, or recommendation with respect to products and services provided by the Companies operating under the FXOpen brand, nor is it to be considered financial advice.

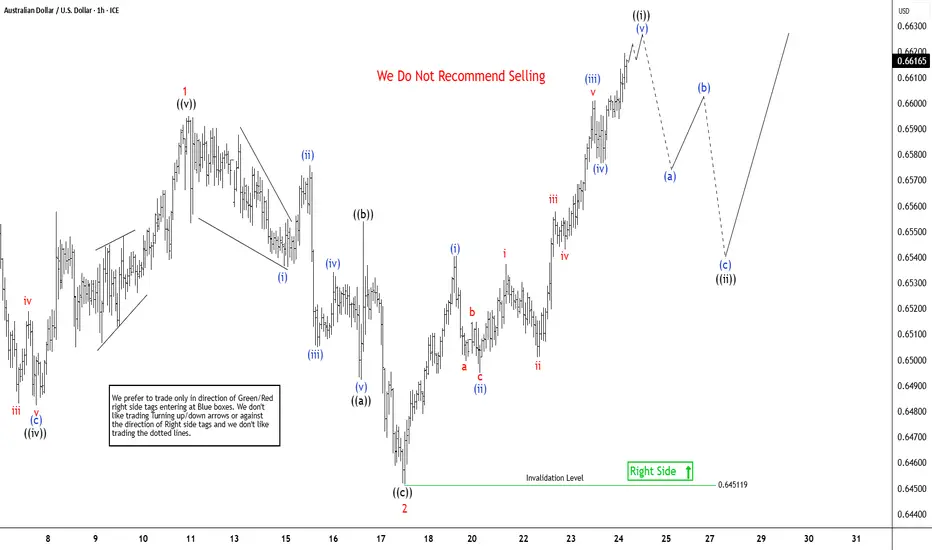
AUDUSD Elliott Wave Outlook: Impulse Pattern Approaching To EndThe AUDUSD pair is showing higher high from 4.09.2025 low, expecting rally to continue from 5.12.2025 low. It favors zigzag corrective bounce from April-2025 low & should continue rally against 0.6451 low. In daily, it started corrective bounce from 4.09.2025 low & may extend towards 0.6720 – 0.6955 area in next few weeks. Above 4.09.2025 low, it ended (A) at 0.6515 high of 5.06.2025, (B) at 0.6354 low of 5.12.2025 & favors upside in (C). Ideally, (C) can extend towards 0.6955 or higher levels, while pullback holds above 5.12.2025 low. Within (C), it placed 1 at 0.6595 high, 2 at 0.6451 low in corrective pullback & favors upside in 3. Within 1, it ended ((i)) at 0.6552 high, ((ii)) at 0.6369 low, ((iii)) at 0.6590 high, ((iv)) at 0.6451 low & ((v)) at 0.6595 high in overlapping diagonal. Below 1 high, it ended 2 in zigzag correction at extreme area before resume rally in 3.
It placed ((a)) of 2 at 0.6492 low in 5 swings, ((b)) at 0.6554 high & ((c)) at 0.6451 low in 5 swings. Wave 2 pullback ended at 0.618 Fibonacci retracement of 1. Within 3, it favors impulse in ((i)) started from 7.17.2025 low. It placed (i) of ((i)) at 0.6540 high, (ii) at 0.6495 low, (iii) at 0.6601 high, (iv) at 0.6576 low & favor upside in (v) targeting in to 0.6606 – 0.6637 area to finish it. It already reached minimum area, but can see more upside above 0.6593 low. Alternatively, the current move even can be (iii) of ((i)) followed by small pullback in (iv) & higher in (v). Later, it expects ((ii)) to correct in 3, 7 or 11 swings against 7.17.2025 low & find support from extreme area to continue rally. Wave 3 should extend in to 0.6692 – 0.6841 area in 5 swings before correcting in 4 of (C). We like to buy the pullback in 3, 7 or 11 swings at extreme area against 7.17.2025 low.
Sell area audusdStrong sell expected from the marked level
Wait to sweep high and high possible to respect the downtrend channel
