AUD/USD - Breakout (25.07.2025)The AUD/USD Pair on the M30 timeframe presents a Potential Selling Opportunity due to a recent Formation of a Trendline Pattern. This suggests a shift in momentum towards the downside in the coming hours.
Possible Short Trade:
Entry: Consider Entering A Short Position around Trendline Of The Pa
About Australian Dollar / U.S. Dollar
The Australian Dollar and the US Dollar pair belong the Majors, a group of the most popular traded pairs in the world. This pair's popularity soared because traders were attracted to the interest rate differential of the pair. This has waned in recent years due to economic volatility worldwide.
Related currencies

AUD/USD Bearish Reversal Setup (1H Chart) Analysis:The pair has recently broken down from the ascending channel (highlighted in blue), indicating a potential trend reversal.
A lower high has formed after the peak near 0.66200, followed by a sharp drop, confirming bearish momentum.
Current price is hovering around 0.6573, and the structure shows a

AUDUSD: Sell The Rip!Welcome back to the Weekly Forex Forecast for the week of July 21-25th.
In this video, we will analyze the following FX market:
AUDUSD
AUDUSD has been difficult to trade, as it chops its slow grind upwards. Last week it gave a bearish close. With the USD expected to continue to gain strength,

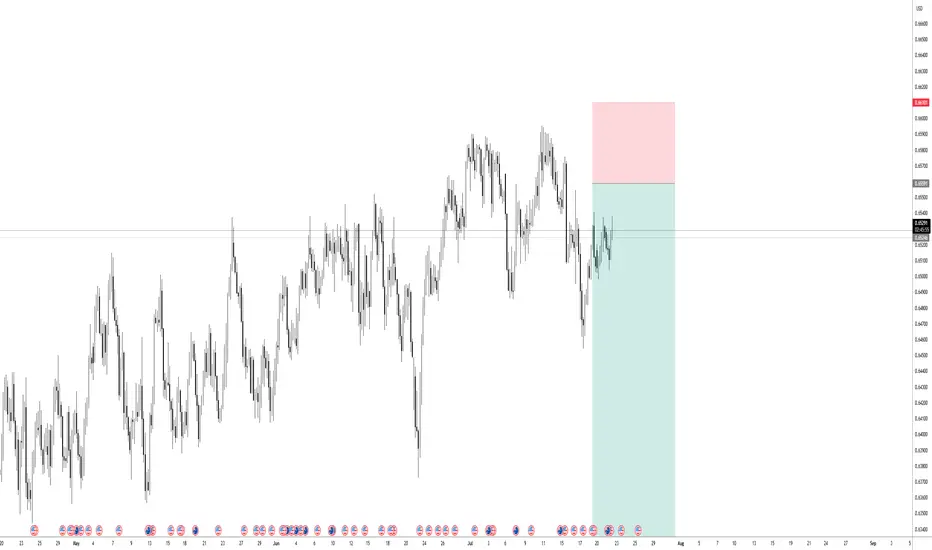
AUDUSD Potential UpsidesHey Traders, in tomorrow's trading session we are monitoring AUDUSD for a buying opportunity around 0.64200 zone, AUDUSD is trading in an uptrend and currently is in a correction phase in which it is approaching the trend at 0.64200 support and resistance area.
Trade safe, Joe.

AUDUSD Sells In sells based on H4 bearish structure. H4 Double top, 61.8% Daily Retracement & evening star pattern. Im aiming for the daily support of 0.64160.

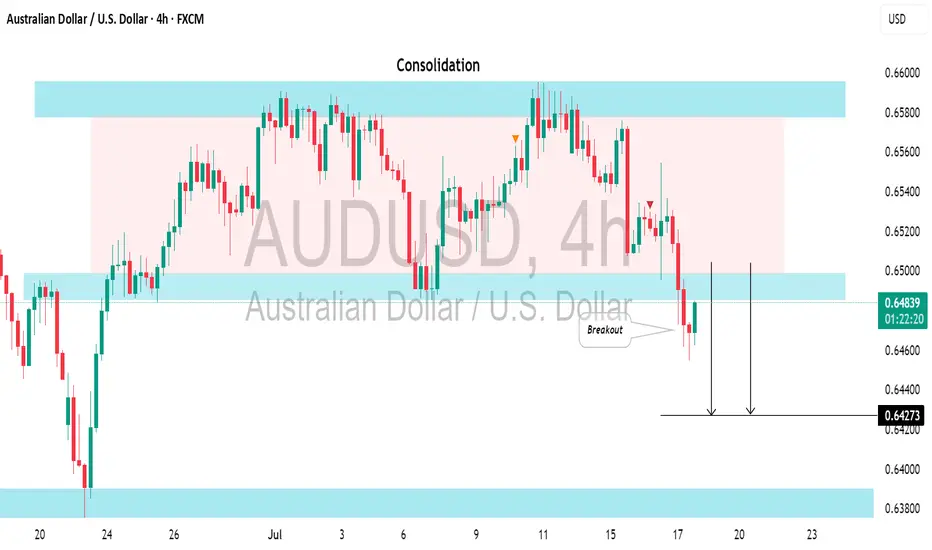
AUDUSD: Strong Bearish Signal?!The AUDUSD appears to be bearish following a few weeks of consolidation.
And a bearish breakout from the support of a sideways range serves as a strong confirmation signal.
We can anticipate a decline to at least the 0.6427 level.
AUDUSD Engineered to Drop?🧠MJTrading:
📸 Viewing Tip:
🛠️ Some layout elements may shift depending on your screen size.
🔗 View the fixed high-resolution chart here:
🔻 OANDA:AUDUSD – Tagged the Top | Smart Money Eyes Lower Levels??
📍 Perfect Respect of Channel Structure
AUDUSD has just kissed the upper boundary of a lo

AUD/USD Bulls Eye BreakoutThe Australian Dollar surged more than 1.8% this week with AUD/USD now testing multi-month uptrend resistance at fresh yearly highs. A four-day rally takes price into confluent resistance at the September low / upper parallel at 6622- The focus is on today’s close with the immediate advance vulnerab

AUDUSD • Premium Supply Zone (Resistance):
• Price is projected to revisit the supply zone between 0.65650–0.65800, which previously led to strong bearish displacement.
• This zone is likely to attract institutional sell orders.
• Current Price Structure:
• Market is retracing upward within a bearish

See all ideas
Summarizing what the indicators are suggesting.
Oscillators
Neutral
SellBuy
Strong sellStrong buy
Strong sellSellNeutralBuyStrong buy
Oscillators
Neutral
SellBuy
Strong sellStrong buy
Strong sellSellNeutralBuyStrong buy
Summary
Neutral
SellBuy
Strong sellStrong buy
Strong sellSellNeutralBuyStrong buy
Summary
Neutral
SellBuy
Strong sellStrong buy
Strong sellSellNeutralBuyStrong buy
Summary
Neutral
SellBuy
Strong sellStrong buy
Strong sellSellNeutralBuyStrong buy
Moving Averages
Neutral
SellBuy
Strong sellStrong buy
Strong sellSellNeutralBuyStrong buy
Moving Averages
Neutral
SellBuy
Strong sellStrong buy
Strong sellSellNeutralBuyStrong buy
Displays a symbol's price movements over previous years to identify recurring trends.
Frequently Asked Questions
The current rate of AUDUSD is 0.65650 USD — it has decreased by −0.38% in the past 24 hours. See more of AUDUSD rate dynamics on the detailed chart.
The value of the AUDUSD pair is quoted as 1 AUD per x USD. For example, if the pair is trading at 1.50, it means it takes 1.5 USD to buy 1 AUD.
The term volatility describes the risk related to the changes in an asset's value. AUDUSD has the volatility rating of 0.72%. Track all currencies' changes with our live Forex Heatmap and prepare for markets volatility.
The AUDUSD showed a 1.32% rise over the past week, the month change is a 0.89% rise, and over the last year it has increased by 0.44%. Track live rate changes on the AUDUSD chart.
Learn how you can make money on rate changes in numerous trading ideas created by our community.
Learn how you can make money on rate changes in numerous trading ideas created by our community.
AUDUSD is a major currency pair, i.e. a popular currency paired with USD.
Currencies are usually traded through forex brokers — choose the one that suits your needs and go ahead. You can trade AUDUSD right from TradingView charts — just log in to you broker account. Check out the list of our integrated brokers and find the best one for your needs and strategy.
When deciding to buy or sell currency one should keep in mind many factors including current geopolitical situation, interest rates, and other. But before plunging into a deep research, you can start with AUDUSD technical analysis. The technical rating for the pair is buy today, but don't forget that markets can be very unstable, so don't stop here. According to our 1 week rating the AUDUSD shows the strong buy signal, and 1 month rating is buy. See more of AUDUSD technicals for a more comprehensive analysis.