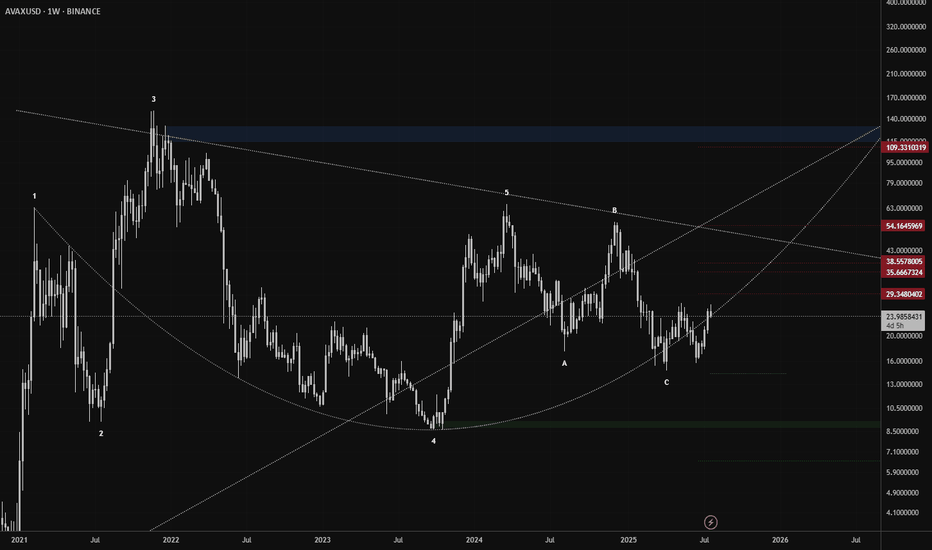
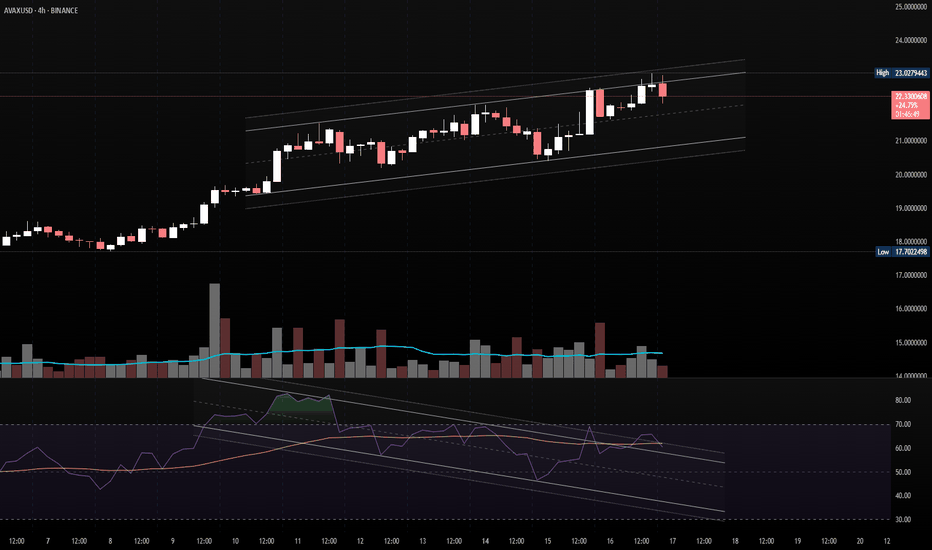
AVAXUSD trade ideas
Weekly trading plan for AVAXIn this idea I marked the important levels for this week and considered a few scenarios of price performance
The price is near the resistance zone so it is worth considering the risks
Write a comment with your coins & hit the like button and I will make an analysis for you
The author's opinion may differ from yours,
Consider your risks.
Wish you successful trades ! mura
AVAX Dual Scenario Analysis: Breakout or Further Drop?In the analysis of the AVAX 1H chart, if the highlighted candle gets strongly engulfed by a solid red candle, we could expect a continuation of the Avalanche downtrend. On the other hand, if the blue line is broken to the upside, it could present a good long opportunity.
Keep in mind that in both scenarios, the blue box serves as our stop-loss reference. In the bullish case, the bottom of the box will be our stop-loss level, while in the bearish case, the blue line will act as our stop-loss.
Analysis provided based on market conditions as of May 23, 2025Analysis provided based on market conditions as of May 23, 2025, at 17:56:48 New York time.
Section 0: Instant Trading Signal
Symbol: AVAX-USD
Trade Direction: Sell
Suggested Entry Range: 23.80 - 23.90 (wait for retracement)
Stop Loss: 24.05
Main Target(s): 23.15 and 22.34
Very Short Note: Entry is conditional upon price returning to the entry range, medium risk, pay attention to time and price confluence.
Section 1: Title and Quick Summary
Live AVAX/USD Analysis: Sell Opportunity on a Pullback to Target Lower Liquidity?
Symbol and Probable Direction: AVAX-USD / Sell
Current Situation Simply Put: Based on the analysis on May 23, 2025, at 17:56:48 New York time, the AVAX/USD market shows an uptrend on the daily timeframe but with a recent significant downward move, and it is in a ranging phase on the 4-hour timeframe. On lower timeframes (1-hour, 15-minute, and 5-minute), the order flow is clearly bearish, and the price is targeting lower liquidity levels. After a recent sharp downward move, the price is currently near short-term support levels and may have an upward pullback (Retracement) before continuing its downward move.
Section 2: Proposed Trading Setup
Trade Direction: Sell
Precise Entry Range: Entry is suggested within the 23.80 - 23.90 range. This range is near the center (CE - Consequent Encroachment) and the upper part of a Bearish FVG (Fair Value Gap) on the 4-hour timeframe (23.66 - 23.93), which formed after the recent strong downward move. This area can act as a Discount zone for sell-side traders. We expect the price, after testing the current lower levels, to pull back to this area to continue its downward move. A more precise entry after observing LTF (Lower Time Frame) confirmation (such as a bearish break of structure and formation of a new FVG) on the 5-minute or 1-minute timeframe if the price reaches the 23.80 - 23.90 range can reduce risk, but the main setup is defined based on the 4-hour zone.
Stop Loss: 24.05. This level is just above the 4-hour FVG (23.66 - 23.93) and above the last significant Swing High before the creation of this FVG on the 4-hour timeframe. A decisive break of this level invalidates the entry scenario based on this FVG.
Price Targets:
First Target: 23.15 (PDL or Previous Daily Low). This is the first significant liquidity level identified on the daily and 1-hour timeframes and is the first logical target for profit-taking after entry.
Second Target: 22.34 (SL or significant Swing Low on the daily timeframe). This is a more significant and lower liquidity level that could be the next price target, especially considering the PWL (Probable Weekly Low) of 21.27 nearby. Estimated Timeframe to Reach Targets: Given that the time is May 23, 2025, 17:56:48 New York time, which is late in the New York session and the beginning of the Asia session, movement towards the targets may be slower. We expect the main move to occur during the London or New York sessions of the next trading day (May 24, 2025). Reaching the first target might take an estimated 12-24 hours, and the second target 24-48 hours, conditional upon the entry point being activated.
Confidence Level in the Setup: Medium.
Justification: The alignment of the bearish trend on lower timeframes and the targeting of lower liquidity are positive factors. The presence of a 4-hour FVG above the current price provides a logical entry zone. However, the daily trend is still identified as bullish (albeit weak), and the quality of recent structural breaks on lower timeframes has been average and not accompanied by strong FVGs. Also, the setup is contingent on a pullback to the entry range.
ICT Entry Model and Main Logic: This setup is based on a combination of Market Structure analysis, Liquidity, and the use of PD Arrays (FVG) on different timeframes. After a bearish break of structure on lower timeframes and the creation of a bearish order flow, we expect the price to pull back to a Premium area or an Inefficiency zone like the 4-hour FVG to gather more sell orders. Entering in this zone (within a relative OTE - Optimal Trade Entry - for the recent downward move) with a logical stop loss above the invalidation point allows for targeting liquidity at lower levels (PDL and SL/PWL) with a favorable risk-to-reward ratio.
Setup Validity: This setup is valid as long as the price does not reach the stop loss at 24.05. Also, if the price reaches the first or second targets without a significant pullback, the validity of the setup for a new entry decreases.
Special Precautionary Notes: Avoid emotional entry at the current price; wait for a pullback to the 23.80 - 23.90 range. Refrain from trading during major economic news releases (if any in the coming days). Due to the average quality of recent BOS (Break of Structure) on LTF, manage your position size.
Section 3: Why the Analysis and a Deeper ICT Look
Higher Timeframe In-depth Analysis: On the daily timeframe (1D), the overall market trend is identified as bullish, but this trend has entered a mid-term corrective or bearish phase after price highs (like 55.84 and 30.85). The last bullish Break of Structure (BOS) on the daily had average quality (4.7/10) and was not accompanied by the creation of an FVG, indicating not-so-strong buyer power at that point. Currently, the price on the 4-hour timeframe (4H) is in a ranging phase, but the recent move downwards from the 26.82 high indicates seller dominance in this area. The market narrative from an ICT perspective is that after a distribution phase at higher tops, the price is now collecting liquidity at lower levels in a corrective phase or the beginning of a larger bearish move, even if the daily trend has not officially changed yet. Key pivots like 22.34 (Daily SL) and 21.27 (PWL) are important targets for the Interbank Price Delivery Algorithm (IPDA). The current price, as of May 23, 2025, at 17:56:48 New York time, is near the bottom of the recent 4-hour trading range.
(Very Important) Reference to Previous Analysis: No prior analysis has been provided for the AVAX-USD symbol, so this analysis is our first assessment of the current state of this asset based on ICT principles.
Entry Timeframe Analysis: On the 1-hour (1H), 15-minute (15min), and 5-minute (5min) timeframes, the market structure has clearly turned Bearish, and bearish Breaks of Structure (BOS) have been repeated, although the quality of these BOS (score around 5/10) and the lack of strong FVG creation immediately after the breaks indicate a lack of strong momentum in each bearish wave. However, the dominant order flow on these timeframes is bearish, and the price is targeting lower internal and external liquidity levels. At the current time, May 23, 2025, at 17:56:48 New York time, the Asia session is active. Sharp moves often occur during the London or New York sessions, so expecting a pullback during the Asia session and the main move in subsequent sessions is more logical. The suggested entry range of 23.80 - 23.90 is based on the 4-hour FVG, which is a significant inefficiency area in the path of the recent downward move and could be ideal for re-entry for sell-side traders after a pullback.
Main Confluences:
Dominant bearish order flow on lower timeframes (1-hour, 15-minute, 5-minute).
Targeting significant liquidity levels below the current price (PDL 23.15 and SL 22.34).
Existence of a 4-hour FVG (23.66 - 23.93) as a potential pullback area for sellers to re-enter.
Price position in the lower part of the 4-hour trading range and approaching important targets.
Invalidation Conditions and Alternative Scenario: The main scenario (sell after pullback) is invalidated if the price reaches the stop loss at 24.05. In this case, the price will likely intend to fill higher inefficiencies or target liquidity above recent swing highs (like PDH 25.43 or 25.97). If the price reaches the lower liquidity levels (first and second targets) without a significant pullback, the sell setup based on this entry point will no longer be valid, and planning for a new setup at lower levels (e.g., based on testing a lower OTE or reacting to the 22.34 liquidity) will be necessary.
Section 4: Educational Tip or Small Exercise
ICT Educational Tip of the Week: The importance of combining timeframes and following institutional order flow. As we saw in the AVAX/USD analysis, even if the overall trend on a very high timeframe (daily) is bullish, examining mid-term (4-hour) and lower (1-hour, 15-minute, 5-minute) timeframes can indicate a change in order flow in the short and medium term. Observing Breaks of Structure (BOS) and following the path price takes to collect liquidity helps us predict the probable direction of the next move and find entry zones (PD Arrays) in the direction of the dominant order flow on the entry timeframe. Always try to align your bias with the institutional order flow on the main timeframes.
Exercise for You: On the AVAX/USD chart, identify the 4-hour FVG range (23.66 - 23.93). Also, mark the liquidity levels PDL 23.15 and SL 22.34. Monitor the price movement in the coming hours and days. Does the price pull back to the 4-hour FVG? If it pulls back, what reaction do you observe on the 5-minute or 1-minute timeframe in this area (e.g., CHoCH - Change of Character - and bearish FVG)? Does the price succeed in targeting the lower liquidity levels? This exercise will help you better understand how to use PD Arrays and liquidity levels alongside market structure analysis.
Section 5: Risk Management and Disclaimer
Risk Management Warning and Disclaimer: Trading in financial markets involves significant risk and may result in the loss of your capital. The analysis and signals provided are purely for educational and analytical purposes and are by no means financial advice or definitive trading signals. The final decision to enter any trade, determine position size, stop loss, and targets is your own responsibility. Always use appropriate risk management (such as determining position size based on a small percentage of your capital per trade) and only trade with capital you can afford to lose. The responsibility for any profit or loss resulting from the use of this analysis lies with the individual trader.
AVAX 5/19/25 - Getting in early? Putting this one on!!!Here is an update on AVAXUSD via analyzing Cumulative Delta Volume (CDV), divergence between price and the Money Flow Index (MFI), and the 4h and D McGinley Moving Averages!
This setup is showing me what I want to see, so I will be putting this trade on!!!
Happy trading, and I hope the video was helpful!
AVAX Trade Setup: Targeting a 7:1 Risk-to-Reward RatioAVAX has reached the Fibonacci golden zone at $22. This is a high-risk, high-reward setup with a potential 7:1 risk-to-reward ratio. If Bitcoin breaks to a new all-time high, this could mark a potential bottom for AVAX.
Entry: $23.30
Stop Loss: $21.80
Target: $34.00
For educational purposes only.
AVAX Breakout: 33% Upside? Crypto Market Heating UpAVAX just broke out of an ascending triangle pattern with a potential 33% upside. In this video, we walk through the setup, risk management, and why this might still have legs. We also look at Bitcoin, Ethereum, and Solana to understand how correlated moves could affect altcoins like AVAX. Don't miss the key levels and timing to consider before it's too late.
This content is not directed to residents of the EU or UK. Any opinions, news, research, analyses, prices or other information contained on this website is provided as general market commentary and does not constitute investment advice. ThinkMarkets will not accept liability for any loss or damage including, without limitation, to any loss of profit which may arise directly or indirectly from use of or reliance on such information.
Weekly plan for AVAXIn this idea I marked the important levels for this week and considered a few scenarios of price performance
Write a comment with your coins & hit the like button and I will make an analysis for you
The author's opinion may differ from yours,
Consider your risks.
Wish you successful trades ! mura
AVAX/USD Analysis – Testing Major Demand Zone! Is a Reversal Pair: Avalanche / USD
Timeframe: 15-Minute
Indicator: LuxAlgo Supply and Demand + Volume Range
Current Price: $20.06
Key Support: $20.15
Major Resistance Zones:
$21.23 (mid-range target)
$22.15 (supply zone)
---
Chart Breakdown:
AVAX has dropped into a strong demand zone between $20.15–$20.00, which has historically triggered bullish reactions. A bullish candle has formed right at this zone, hinting at a possible reversal setup.
Two trade paths:
1. Reversal Scenario (High Probability):
A bounce from this zone could push price toward $21.23 or even $22.15.
Watch for bullish candlestick patterns (like engulfing or pin bars) around this area.
2. Breakdown Scenario:
If price breaks and closes below $20.00 with high volume, expect continuation to lower demand zones (watch for a separate update).
---
Trade Setup:
Buy Zone: $20.00–$20.15 (on bullish confirmation)
Target 1: $21.23
Target 2: $22.15
Stop Loss: Below $19.80 (tight) or $19.60 (conservative)
---
What to Watch:
The next 3–5 candles will be crucial. A bullish reaction from this demand zone could signal the next upward leg.
Engage:
If this analysis helped, drop a like, comment your thoughts, and follow for daily crypto setups!
#AVAX #Avalanche #CryptoTrading #SupplyDemand #PriceAction #LuxAlgo #Scalping #CryptoAnalysis
AVAX grows the slowestIn this video I marked the important levels for this week and considered a few scenarios of price performance
For this week the important level is $21 + near it is the lower boundary of the rising channel, if the price breaks it and gets stuck under it, there are more chances to see a correction to the first support zone
Write a comment with your coins & hit the like button and I will make an analysis for you
The author's opinion may differ from yours,
Consider your risks.
Using Bitcoin to boost AVAX trade successIn this video, I’ll show you tactics I use where a trigger in Bitcoin helps build confidence in an AVAX position. I combine a large descending triangle with a smaller ascending triangle to size up aggressively with a strong risk-reward ratio, staying heavy long to maximise upside in a bullish market.
This content is not directed to residents of the EU or UK. Any opinions, news, research, analyses, prices or other information contained on this website is provided as general market commentary and does not constitute investment advice. ThinkMarkets will not accept liability for any loss or damage including, without limitation, to any loss of profit which may arise directly or indirectly from use of or reliance on such information.
AVAX trading plan through the 27th In this video I considered the global possible price movement, also made possible scenarios for the current week
Right now the price has reached an important level and considering the bearish divergences there is a chance to see a quick correction
Write a comment with your coins & hit the like button, and I will make an analysis for you
The author's opinion may differ from yours,
Consider your risks.
Wish you successful trades! MURA
These 3 Things Will Show You How To Take Profit On Trades.Its been a crazy week.This is because i am developing
a new trading strategy.Trying to learn something new
is not easy at all.
When you look at this chart you will see:
-The cross below the 20 level
-The blue line is above the orange line
-The Stochastic has coordinates
These 3 things will show you how to take profit on
trades.Also they will show you when to enter them.
i had to change Stochastic coordinates
to show you the "Dip Buy" Strategy.
This strategy is based on buying
prices that are cheap.
It is not easy to follow.Because when you decide to
buy at these prices,You are going against the crowd.
To take profit , you have to exit at the top of this indicator.
This is why these coordinates are important.The purpose
is to show you when to take profit, and how to take profit.
This will help you on your trading path.
Rocket boost this content to learn more.
Disclaimer:Trading is risky please risk management
and profit taking strategies.Also feel free to
use a simulation trading account.
AVAXUSD cooking massive Triangle bullish tradeAvalanche / AVAXUSD is trading inside a massive Triangle pattern for the entirety of its history.
The price just hit its bottom this week and is rebounding with force.
The first target is 45.000, right at the top of the pattern.
If however the 2021 Bull Cycle is confirmed then the price can break massively above the Triangle and exceed $300, but this is arguably an ambitious target.
Follow us, like the idea and leave a comment below!!
Avalanche (AVA): Overextended! Is This Ready for a Bullish Move?Avalanche (AVAX) is currently presenting an intriguing setup, with price action showing signs of being overextended on the daily and 4-hour timeframes. The cryptocurrency has recently traded into a critical support zone, defined by previous swing lows on the daily chart. This area has historically acted as a strong demand zone, attracting buyers. However, AVAX has now dipped below these lows, triggering sell-side liquidity in the form of stop-loss orders placed beneath this level. This liquidity grab could be a precursor to a potential bullish reversal. 🚀
On the 15-minute timeframe, AVAX is consolidating within a tight range, reflecting indecision among market participants. A break above this range, coupled with a bullish market structure shift, could signal the start of a reversal and provide a high-probability buy opportunity. This setup aligns with the concept of a "liquidity sweep," where price manipulates stop orders before reversing direction.
Key Observations:
Daily Timeframe: Price has dipped below key swing lows, eating into sell-side liquidity.
4-Hour Timeframe: Overextension is evident, with price trading into a significant support zone.
15-Minute Timeframe: Consolidation within a range, awaiting a breakout.
Trading Plan:
Wait for Confirmation: Monitor the 15-minute timeframe for a bullish breakout above the current range. 📈
Market Structure Shift: Look for higher highs and higher lows to confirm bullish intent. 🔍
Entry Strategy: Enter long positions after a confirmed breakout, with a stop-loss placed below the range low. 🛡️
Target Levels: Aim for resistance zones on the 4-hour and daily timeframes as potential take-profit areas. 🎯
Key Levels to Watch:
Support Zone: Previous daily swing lows (now acting as a liquidity zone).
Resistance Zone: The upper boundary of the 15-minute range and key levels on the 4-hour chart.
This setup highlights the importance of patience and discipline in trading. While the liquidity grab below support is a promising signal, confirmation of a bullish breakout is essential to avoid false moves. As always, this is not financial advice, and traders should conduct their own research before making any decisions. ⚠️
AVAX - Side-Ways TradingI believe AVAX has seen the worst, the price won't drop any lower, as its quite below the 50MA on a weekly time frame (VAN ECK ETF filing will draw investment opportunities). I further believe the price will climb back up to 30USD and create a sideways channel, fluctuating in the 30-15USD range, for the coming weeks/months. Holistically viewing, we are in an overall sentiment of market uncertainty (With the Trump-Pump out the window and all mixed signals from the USA with import tariff increases), so I don't see the price breaking bullish anytime soon (above the 30USD range). Lets wait and see what the Crypto Market does as a whole, with all eyes on Bitcoin & its ETF which stole the Altcoin-Season spotlight. We are not yet overall bearish yet 2025.