Attempting a breakout The price is attempting a breakout of the blue resistance.
Daily 200-period SMA is also located at $25.10.
It’s important to watch today’s closing price, if the breakout is confirmed, the next target will be the light blue resistance at $26.60
0.32 USD
7.12 B USD
56.51 B USD
About Pfizer
Sector
Industry
CEO
Albert Bourla
Website
Headquarters
New York
Founded
1849
ISIN
ARDEUT111424
FIGI
BBG000HG7R08
Pfizer Inc. is a research-based global biopharmaceutical company, which engages in the discovery, development, manufacture, marketing, sales and distribution of biopharmaceutical products worldwide. The firm works across developed and emerging markets to advance wellness, prevention, treatments and cures that challenge the most feared diseases. The company was founded by Charles Pfizer Sr. and Charles Erhart in 1849 and is headquartered in New York, NY.
Related stocks

PFIZER INC. (NYSE)For all vaccine enthusiasts, Pfizer shares are currently among the best options.
At the time of publication, the price is holding steady at $24.83 . Our forecast is that the price will rise to $27.48 (minimum)! Most likely by August.
Personally, I don't trade stocks, as I have decided to change

Aggressive Trend Trade 1HAggressive Trend Trade 1H
- short trend
+ volumed T1
+ support level
+ biggest volume 2Sp+
Daily Trend
+ long impulse
+ T2 level
+ support level
+ 1/2 correction"
Monthly CounterTrend
"- short balance
+ expanding ICE
+ support level
+ unsuccessful biggest volume manipulation"
Yearly Trend
"+ long

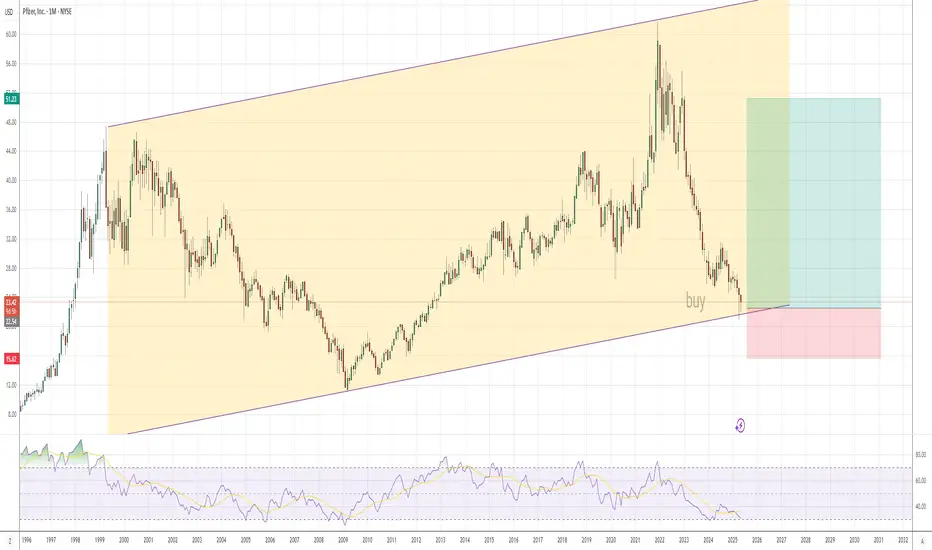
PFIZER is taking Viagrathe stock price of Pfizer is about to overdose on viagra. Looking at the bounce from the downfall due to corona virus there is solid support from previous wave 4. With the news of Vaccines, Pfizer is promising to produce one. I am looking at a target price of $45.00

BUY Pfizer (PFE) growth by Viagra
Tomorrow, I’m entering a position in Pfizer Inc. (NYSE: PFE)—a globally recognized pharmaceutical giant with strong fundamentals and an attractive technical setup.
Pfizer maintains a solid revenue base, reporting $62.46 billion in total revenue in the last fiscal year. Despite recent fluctuatio

Bullish news failure. Reversal has begun ?Getting 2 major news failures is a strong indication the bottom is already in for Pfizer and maybe the vaccine space as a whole.

PFE - A GOOD DIVIDEND PLAY LONG TERMGood Morning,
I have been keeping an eye on PFE for awhile as I want to get it on a low to hold in my TFSA long term for dividend payments.
PFE created an initial support at level 21-21.50$. PFE continued to climb aggressively until seeing some rejection at the 24$ level. It dropped down to ret

PFE – Long Trade Setup !📈 🟢
Ticker: Pfizer, Inc. (NYSE: PFE)
Chart: 30-Min Timeframe
Pattern: Ascending triangle breakout continuation
🔹 Entry: $24.38 (breakout from consolidation + trendline support)
🔹 Stop-Loss: $24.01 (below ascending trendline)
🔹 Take Profits:
TP1: $24.89 – Gap-fill resistance zone
TP2: $25.55 – M

Pfizer Stock Chart Fibonacci Analysis 042925Trading Idea
1) Find a FIBO slingshot
2) Check FIBO 61.80% level
3) Entry Point > 22.7/61.80%
Chart time frame:D
A) 15 min(1W-3M)
B) 1 hr(3M-6M)
C) 4 hr(6M-1year)
D) 1 day(1-3years)
Stock progress: C
A) Keep rising over 61.80% resistance
B) 61.80% resistance
C) 61.80% support
D) Hit the bottom

See all ideas
Summarizing what the indicators are suggesting.
Oscillators
Neutral
SellBuy
Strong sellStrong buy
Strong sellSellNeutralBuyStrong buy
Oscillators
Neutral
SellBuy
Strong sellStrong buy
Strong sellSellNeutralBuyStrong buy
Summary
Neutral
SellBuy
Strong sellStrong buy
Strong sellSellNeutralBuyStrong buy
Summary
Neutral
SellBuy
Strong sellStrong buy
Strong sellSellNeutralBuyStrong buy
Summary
Neutral
SellBuy
Strong sellStrong buy
Strong sellSellNeutralBuyStrong buy
Moving Averages
Neutral
SellBuy
Strong sellStrong buy
Strong sellSellNeutralBuyStrong buy
Moving Averages
Neutral
SellBuy
Strong sellStrong buy
Strong sellSellNeutralBuyStrong buy
Displays a symbol's price movements over previous years to identify recurring trends.
P
PFE5588844
Pfizer Investment Enterprises Pte. Ltd. 5.34% 19-MAY-2063Yield to maturity
6.19%
Maturity date
May 19, 2063
P
PFE5588843
Pfizer Investment Enterprises Pte. Ltd. 5.3% 19-MAY-2053Yield to maturity
6.06%
Maturity date
May 19, 2053
P
PFE5588591
Pfizer Investment Enterprises Pte. Ltd. 5.11% 19-MAY-2043Yield to maturity
5.84%
Maturity date
May 19, 2043
See all PFED bonds
Curated watchlists where PFED is featured.


