SHOP has one more seller to BuyHello I am the Cafe Trader.
Today we are going to be looking at Shopify, Thanks to a request from a follower.
Couple things to note here. This is a Massive range for a decent stock.
With a bottom of 23.61, and a high of 176.34 some may wonder if we might see some more downside before testing the
0.010 USD
1.79 B USD
7.89 B USD
About Shopify Inc.
Sector
CEO
Tobias Albin Lütke
Website
Headquarters
Ottawa
Founded
2004
ISIN
ARBCOM460341
Shopify, Inc. engages in the cloud-based commerce platform designed for small and medium-sized businesses. Its software is used by merchants to run business across all sales channels, including web, tablet and mobile storefronts, social media storefronts, and brick-and-mortar, and pop-up shops. The firm's platform provides merchants with a single view of business and customers and enables them to manage products and inventory, process orders and payments, build customer relationships and leverage analytics and reporting. It focuses on merchant and subscription solutions. The company was founded on September 28, 2004 and is headquartered in Ottawa, Canada.
Related stocks

Shopify (SHOP) – Powering the Next Wave of Global E-CommerceCompany Snapshot:
Shopify NASDAQ:SHOP continues to dominate as a leading commerce infrastructure provider, backed by record merchant adoption, a recurring revenue engine, and cutting-edge AI integration that enhances merchant capabilities.
Key Catalysts:
AI-Powered Ecosystem 🤖
From automated co

SHOP watch $126.79-127.28: Major Resistance may start a RetraceSHOP surged into a significant resistance at $126.79-127.28.
Zone of a Golden Genesis fib paired with a Covid Simulus fib.
Looking for a Break-n-Retest or Dip-to-Fib for long entries.
.

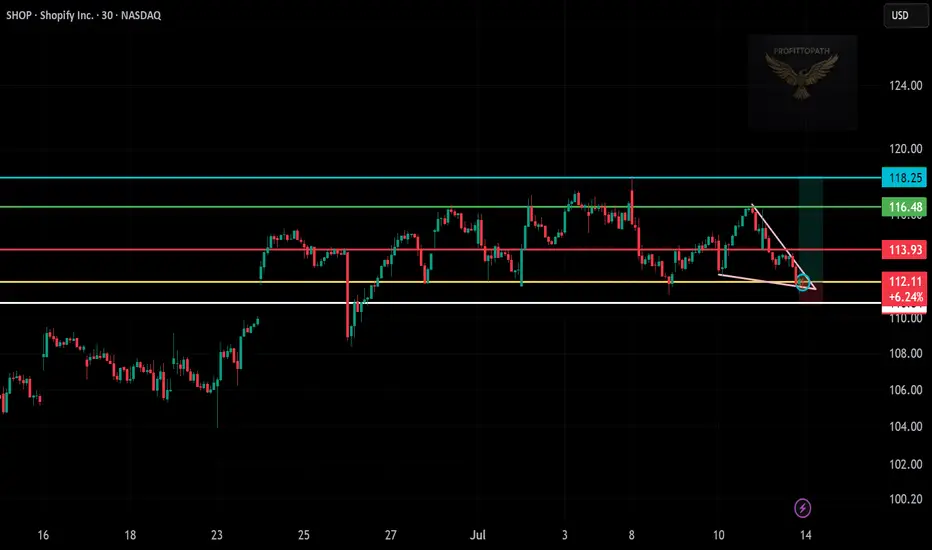
Trade Setup: Long on SHOP!📊
🕒 Timeframe:
30-minute chart
📍 Technical Overview:
Falling wedge breakout detected ✅
Support zone: $111.50–$112 (held well)
Breakout confirmation near $113
Target zones:
TP1 🎯: $116.48 (green resistance)
TP2 🎯: $118.25 (major resistance)
🔐 Risk Management:
Stop loss: Below $111.50 (white s
Ascending Triangle With Breakout Incoming?📈 Ascending Triangle formation (bullish)
🔥 MACD crossover above signal line, bullish momentum gaining
✅ RSI at 61, showing strength but not overbought
📊 Watching for volume confirmation on breakout
Plan: Wait for daily close or strong intraday breakout above 160. If it confirms, this could be a

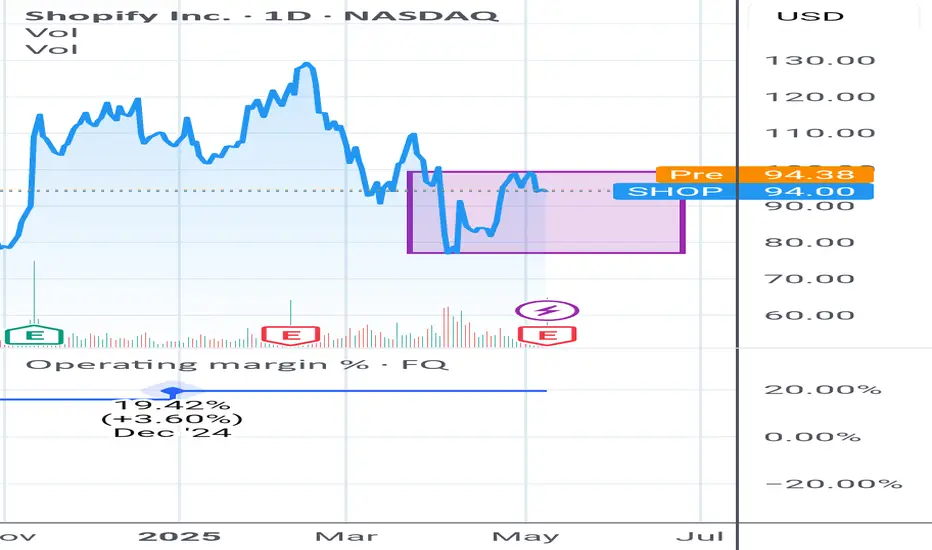
Trading box for SHOPThesis : the operating performance of SHOP's business is positive and it provides an optimistic outlook.
How to trade it: at this juncture the stock seems poised to go higher, therefore I will setup a trading box to confirm or deny the thesis.
Sell if it drops below 77
Buy if it breaks the
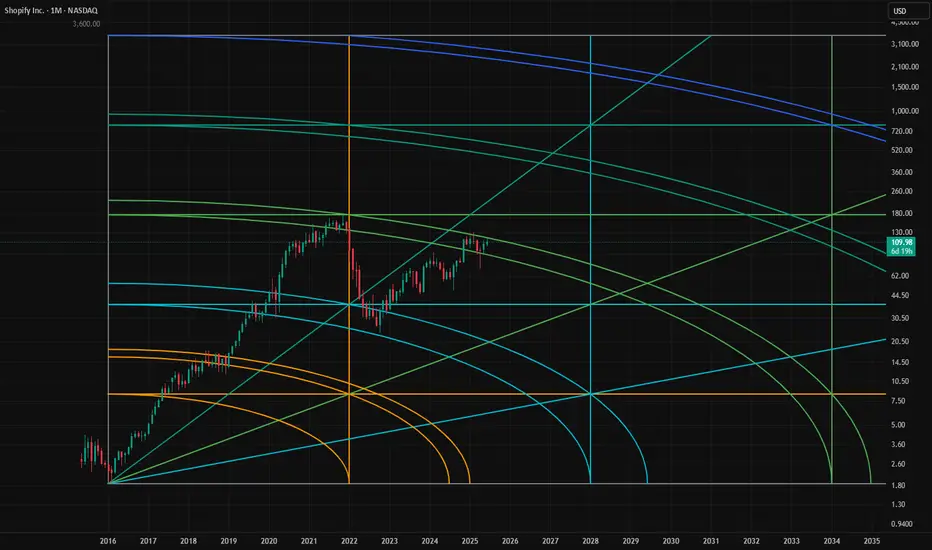
$SHOP will break out shortly! Shopify is dtuck under it's arc for a while now, Ones it breaks it will gravitade to the next one. Good Symmetry.
Bullish Opportunity with Strong Technical Signals
Targets:
- T1 = $110.00
- T2 = $117.00
Stop Levels:
- S1 = $104.00
- S2 = $102.00
**Wisdom of Professional Traders:**
This analysis synthesizes insights from thousands of professional traders and market experts, leveraging collective intelligence to identify high-probability trade setups. The w

Shopify's Technical Setup Signals Potential Upside Opportunity
Current Price: $105.34
Direction: LONG
Targets:
- T1 = $108.50
- T2 = $111.90
Stop Levels:
- S1 = $104.00
- S2 = $102.10
**Wisdom of Professional Traders:**
This analysis synthesizes insights from thousands of professional traders and market experts, leveraging collective intelligence to

Shopify Escapes Tight ConsolidationShopify has been trapped in a tight range, but now the e-commerce stock may be breaking out.
The first pattern on today’s chart is the falling trendline since May 14 (based on closing prices). SHOP ended Friday above it, which may draw fence-sitters from the sidelines.
Second is the April high of

See all ideas
Summarizing what the indicators are suggesting.
Oscillators
Neutral
SellBuy
Strong sellStrong buy
Strong sellSellNeutralBuyStrong buy
Oscillators
Neutral
SellBuy
Strong sellStrong buy
Strong sellSellNeutralBuyStrong buy
Summary
Neutral
SellBuy
Strong sellStrong buy
Strong sellSellNeutralBuyStrong buy
Summary
Neutral
SellBuy
Strong sellStrong buy
Strong sellSellNeutralBuyStrong buy
Summary
Neutral
SellBuy
Strong sellStrong buy
Strong sellSellNeutralBuyStrong buy
Moving Averages
Neutral
SellBuy
Strong sellStrong buy
Strong sellSellNeutralBuyStrong buy
Moving Averages
Neutral
SellBuy
Strong sellStrong buy
Strong sellSellNeutralBuyStrong buy
Displays a symbol's price movements over previous years to identify recurring trends.