BCH SELL SETUP ,Sold From $494BCH SELL SETUP
Currently $494
Sold From $494
(Trading plan If BCH go up to $508
will add more shorts)
Expecting target $483 OR DOWN
In the event of an early exit,
this analysis will be updated.
Its not a Financial advice
BCHUSD trade ideas

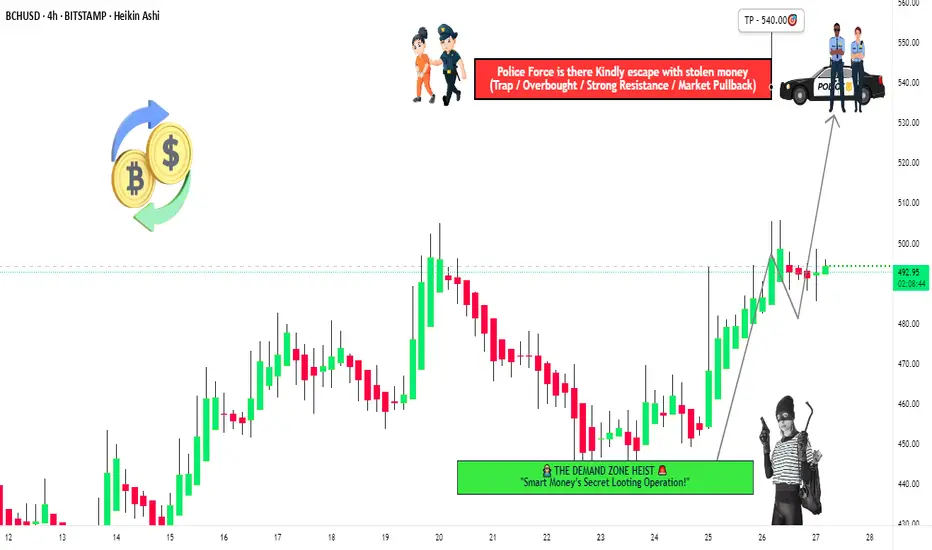
"BCH/USD Heist Mode: Enter Long, Exit Before Bears Strike!🚨 BCH/USD HEIST ALERT: Bullish Loot & Escape Plan! (Thief Trading Style) 🚨
🌟 Greetings, Market Bandits & Profit Pirates! 🌟
(Hola! Oi! Bonjour! Hallo! Marhaba!)
🔥 Mission Briefing:
Based on Thief Trading tactics (TA + FA), we’re plotting a bullish heist on BCH/USD. Time to swipe the loot & escape before the cops (bears) show up!
🔓 ENTRY: "The Vault is Open!"
📈 Buy Zone: Retest of recent low/high (15-30min timeframe).
💡 Pro Tip: Use limit orders for precision—don’t chase!
🛑 STOP LOSS: Live to Steal Another Day
📍 Thief SL: Recent swing low (~440.00 on 4H TF).
⚠️ Adjust based on your risk, lot size, & multi-order strategy.
🎯 TARGET: 540.00 (or Bail Early!)
🏴☠️ Escape before the red zone (overbought, reversal risk, bear traps!).
💰 "Take profit & treat yourself—you earned it!"
📢 WHY THIS HEIST? (Bullish Catalysts)
✅ Fundamentals: Strong macro + sentiment.
✅ Technicals: Pullback entry + bullish structure.
✅ Intermarket trends: Crypto momentum favors bulls.
(For full intel—COT reports, on-chain data, sentiment—check 👉🔗🔗!)
🚨 NEWS ALERT: Avoid the Police (Volatility Traps!)
🔹 Avoid new trades during high-impact news.
🔹 Trailing stops to lock profits & dodge reversals.
💥 BOOST THIS HEIST! (Let’s Get Rich Together!)
👍 Smash that "Like" & "Boost" button to fuel our next robbery!
🚀 Follow for daily heist plans—easy profits await!
See you at the next heist, bandits! 🤑💎
BCH: Bullish Momentum Builds as BBTrend and SMI Flash GreenBCH is showing signs of strengthening bullish momentum. The Bollinger Band Trend (BBTrend) is pointing to increasing volatility in favor of the bulls.
On the daily chart, the BBTrend’s green histogram bars have been growing steadily over the past few sessions, a signal of rising buying pressure.
For context, BBTrend gauges trend strength based on the expansion of the Bollinger Bands. When the bars turn green and expand, it signals a strengthening uptrend.
Right now, buyers appear to be in control, with volatility expanding toward the upside. This increases the odds of BCH extending its rally in the near term.
Adding to the bullish case, the Smart Money Index (SMI) is climbing suggesting that institutional or seasoned traders are positioning on the buy side. The SMI tracks how smart money behaves during key trading hours, and this uptick reinforces the current momentum.
If demand climbs, BCH's price could climb to $546.374.
On the other hand, if buying stalls, the coin's price could fall to $482.93.
Full story here .

BCH | Long-Term Bullish StructureBitcoin Cash presents an attractive long-term bullish structure with multiple technical confluences suggesting higher prices ahead. The patient approach of waiting for the VWAP retest provides optimal entry conditions for this long-term bullish thesis, rather than chasing current elevated prices.
Technical Analysis:
Strong support zone holding at $303.62 with multiple successful tests
365-day VWAP trending upward around $400-420, acting as dynamic support
Descending resistance from previous highs being challenged
Entry Strategy:
Traders should wait for a pullback to the 365-day VWAP ($400-420 zone) before entering long
positions.
This approach offers:
Better risk/reward ratio
Clear stop placement below major support at $300
Entry at a proven dynamic support level
Key Levels:
Entry: $400-420 (VWAP pullback)
Stop: Below $300 support
Target: Above descending trendline toward $600+

Bitcoin Cash Slides as Bearish Signals StrengthenBitcoin Cash fell below last week’s low and now trades around $506.8. Technical indicators show bearish signals, with RSI diverging and the Stochastic trending lower.
BCH/USD may retest support at $487.3; if broken, it could slide to $469.8. The bearish outlook is invalidated if price closes above $528.2.

BCH Faces Pullback RiskFenzoFx—Bitcoin Cash broke above last week’s high at $510.0 and is stabilizing near $525.0. However, the daily Stochastic is overbought, suggesting a pullback toward the 50-SMA at $487.4.
A rebound from there could resume the uptrend, while a close below $487.4 may send BCH toward $437.0.

BCH Faces Resistance at $500.0 Amid Bearish SignalsBitcoin Cash rose to $500.0, a resistance zone backed by the June 19 high. Stochastic reads 85.0, indicating short-term overpricing.
The 4-hour chart shows a possible double top pattern, suggesting consolidation. If BCH stays below $500.8, it could target $494.8 and, if selling continues, drop to $480.9.

Bitcoin Cash BCH: $495 | Breaking out back to FRESH HiGHS a fork or spin off from original Bitcoin
created for scale more txn lower fees and faster
nice consistent volume
supply under the custody of big 3
could be best performing among OG coins
with less fanfare promotion and founder being distant from it
Time fixes everything
and this may just be the True Essence of BITCOIN Satoshi hoped to see
instead of BTC being centralized under Saylor Dorsey and Trump
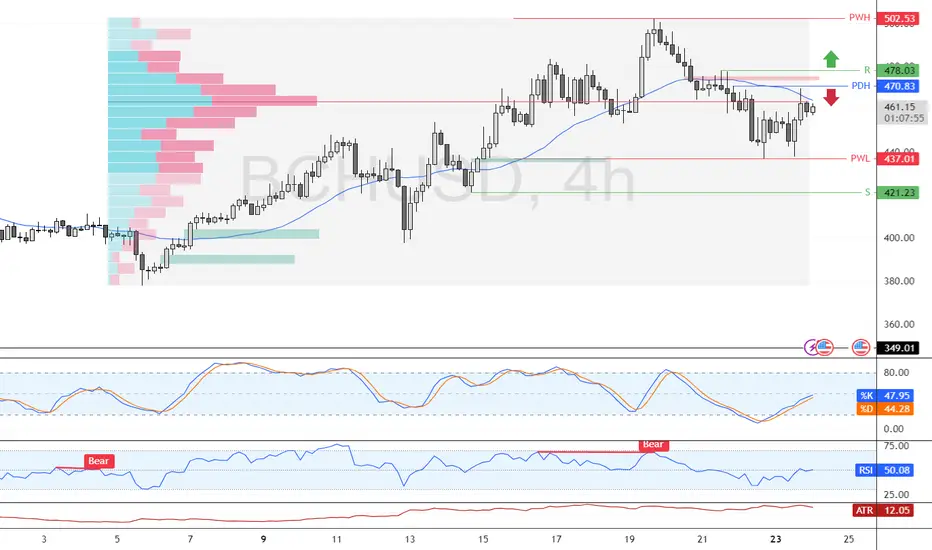
Bitcoin Cash Faces Pressure Below Key Resistance ZoneFenzoFx—Bitcoin Cash rose from $437.0 support, now trading near $461.3 and testing resistance backed by volume profile and the 50-period SMA.
If BCH stays below $470.8, bearish momentum may resume, targeting $437.0 and potentially $421.2. A bullish breakout could follow a close above $470.8, aiming for $478.0.
A visual comparison of Purple Bitcoin (PBTC) and Bitcoin Cash (BA visual comparison of Purple Bitcoin (PBTC) and Bitcoin Cash (BCH) trends, powered by the Purple Bitcoin Compare Bot.

Bitcoin Cash Rebounds from $456 as RSI Shows Bullish DivergenceFenzoFx—Bitcoin Cash swept liquidity below $456.0 during NY midnight and is now rising around $464.0. RSI 14 signals bullish divergence, suggesting growing momentum. If BCH holds above $456.2, it could target $472.0 and potentially $481.2.
The bullish outlook is invalidated if BCH stabilizes below $456.0.

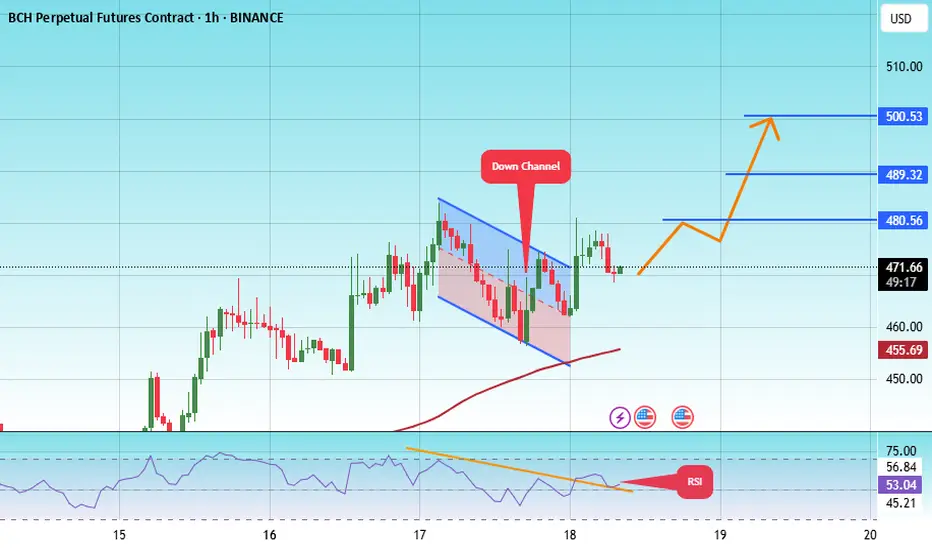
#BCH/USDT#BCH
The price is moving within a descending channel on the 1-hour frame, adhering well to it, and is heading for a strong breakout and retest.
We are experiencing a rebound from the lower boundary of the descending channel. This support is at 456.
We are experiencing a downtrend on the RSI indicator, which is about to break and retest, supporting the upward trend.
We are heading for stability above the 100 moving average.
Entry price: 471
First target: 480
Second target: 489
Third target: 500
BCH PERPETUAL TRADE , Sold From $469BCH PERPETUAL TRADE
BCH SELL SETUP
Currently $469
Sold From $469
(Trading plan IF BCH go up to $490
will add more shorts)
Expecting target $456 OR DOWN
In the event of an early exit,
this analysis will be updated.
Its not a Financial advice

Bitcoin Cash Nears $485—Will BCH Hold Its Gains? FenzoFx—Bitcoin Cash remains bullish, nearing the previous monthly high at $485.0, though overbought conditions signal possible consolidation.
BCH/USD may stabilize around $431.0 before resuming its uptrend toward $485.0. A break above this level could pave the way for $568.0.
The bullish outlook holds as long as BCH stays above $349.0.

Bitcoin Cash Pulls Back After Strong Rally to $446Bitcoin Cash (BCH) pushed aggressively to $446 but faced a harsh rejection, plunging below $430. It is now attempting to consolidate just above $430, but the recent bearish engulfing candle structure suggests uncertainty.

BCH/USD Consolidates Eying $461.9FenzoFx—BCH (Bitcoin Cash) paused its uptrend near $448.1, a low-volume zone, suggesting the rally may resume after consolidation.
Technical indicators show overbought conditions, increasing the likelihood of a short-term dip. BCH/USD may consolidate near $430.0 before aiming for the next target at $461.0.

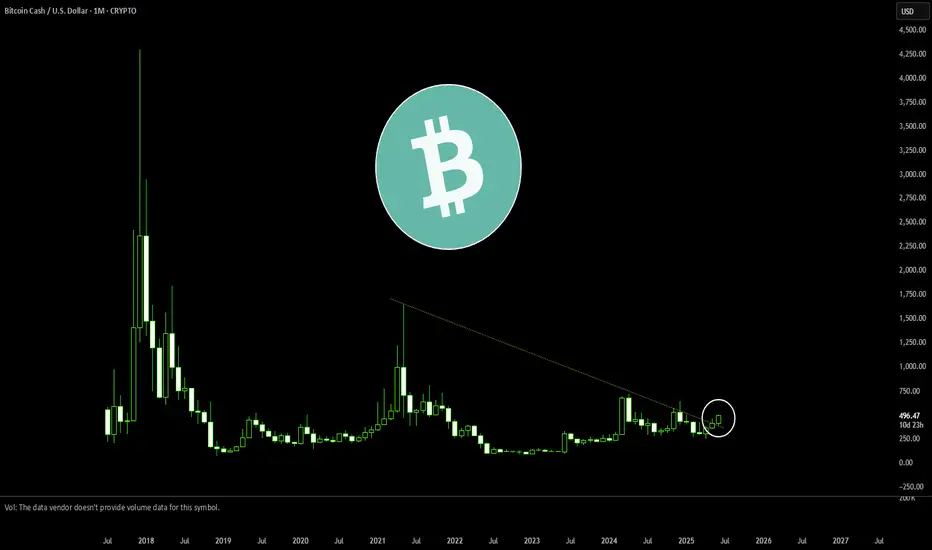
The other Bitcoin's time to shineBitcoin Cash has been dying a slow death, but will soon come back to life.
I love this chart. The Weekly chart shows that an uptrend has started on the linear regression channel, and the Bollinger Band moving average centerline is crossing the 3-year pivot point, which is typically a catalyst for upward movement. The 3-year pivots are stacked tightly, which acts similarly to tight Bollinger bands in that price action is more responsive to any move upward.
Target is the 3-year pivot R1 at $730 and maybe more. I will set a trailing stop at the target to lock in gains and see if we can get some additional upside.

BCH/USD Crypto Profit Raid: Steal Gains with This Blueprint!🔥 Chart Heist Blueprint: Snag Profits in BCH/USD "Bitcoin Cash vs U.S Dollar"! 🚀💰
Crafted for sharp traders ready to raid the BCH/USD "Bitcoin Cash vs U.S Dollar" market, this sleek strategy fuses razor-sharp technicals with savvy fundamentals to maximize your gains. 📊🕵️♂️ Surf the bullish surge, but watch for traps in the Overbought Resistance Zone where bears could strike! 🐻 Lock in your loot before the tide turns. 🌊
- 🎯 **Entry Tactics: Hit the Sweet Spot**
- Long on pullbacks near 440.00 (or) the Silent entry : Institutional Buy Zone at 380.00 (or) above price level. 🏹
- Set alerts for breakouts or pullbacks to strike in real-time. 🔔
- 🛡️ **Stop Loss Hacks: Guard Your Gains**
- Place stops below the nearest 4-hour swing low or candle wick. 🔧
- Tailor stops to your risk and lot size—precision over recklessness! ⚡
- 💸 **Profit Goals: Cash In Big**
- Bullish traders aim for 510.00 or exit early if momentum dips. 📈
- Scalpers focus on long-side quick wins, trailing stops behind big players. 🚀
- 📡 **Market Edge: Why This Plan Wins**
- BCH/USD "Bitcoin Cash vs U.S Dollar" is charging bullish, driven by COT data, macro shifts, sentiment outlook, and intermarket flows. 🔍
- Check the linkss for deeper insights. 🌐
- ⚠️ **News Alert: Dodge the Chaos**
- Skip new trades during major news releases. 📰
- Use trailing stops to secure profits on active trades. 🔒
- 🤝 **Join the Profit Crew**
- Boost this plan, share the vibe, and let’s raid the markets together! 🤑
- Stay sharp for the next big score in the XPD/Palladium heist! 💥
Happy trading, chart bandits! 🎭📉

2x Long BCH will give %25BCH will earn 25 percent if it breaks falling resistance for those who trust it

TA on BCHUSD - 2025.05.14This is a quick technical analysis piece on Bitcoin Cash ( MARKETSCOM:BCHUSD ).
Let's dig in!
CRYPTO:BCHUSD
Let us know what you think in the comments below.
Thank you.
77.3% of retail investor accounts lose money when trading CFDs with this provider. You should consider whether you understand how CFDs work and whether you can afford to take the high risk of losing your money. Past performance is not necessarily indicative of future results. The value of investments may fall as well as rise and the investor may not get back the amount initially invested. This content is not intended for nor applicable to residents of the UK. Cryptocurrency CFDs and spread bets are restricted in the UK for all retail clients.

BCH short range high ideaBCH could be forming structural loss lower time frame that could at least give a small pullback into the demand below offering a scalp short opportunity

BCHUSD getting ready for gainsHello traders,
this is a monthly chart - to keep things really simple.
For the last 2 years BCH price has been "climbing stairs". These "stairs" are based on important levels dating 6 years back (green lines). Price action from Q2 of 2021 up until now has been creating a 'cup and handle' pattern. Handle has beatifully reversed from support level, RSI has found support at 50 level (also important level).
This seems a good entry point to me, with target price for profit taking at 1000-1100 USD. Trade is invalidated, if price dips below 265 USD (one step lower).
It will take some time for this to play out - remember, it is a monthly chart.
This is not a financial advice, trade at your own risk.

The Bitcoin Cash bull runBitcoin Cash began its bull run in June of 2023
Long entry: 370 USD
Take profit: between 200 k / 1.2 million USD
This is my personal opinion and this is not a financial advice! Good trading!
