AMZN Short and Long. High Time Frame. I would consider a short in the top box if we start to breakdown. I will be longing the bottom box when we get there and would hold for all time highs.
Trend is up which is why the short should only be entered if we are breaking down from this zone.
Key facts today
Next report date
—
Report period
—
EPS estimate
—
Revenue estimate
—
5.65 USD
59.25 B USD
637.96 B USD
9.48 B
About Amazon.com
Sector
Industry
CEO
Andrew R. Jassy
Website
Headquarters
Seattle
Founded
1994
FIGI
BBG004BVT6X9
Amazon.com, Inc. engages in the provision of online retail shopping services. It operates through the following business segments: North America, International, and Amazon Web Services (AWS). The North America segment includes retail sales of consumer products and subscriptions through North America-focused websites such as amazon.com and amazon.ca. The International segment offers retail sales of consumer products and subscriptions through internationally-focused websites. The Amazon Web Services segment involves in the global sales of compute, storage, database, and AWS service offerings for start-ups, enterprises, government agencies, and academic institutions. The company was founded by Jeffrey P. Bezos in July 1994 and is headquartered in Seattle, WA.

AMAZON is on its 3rd historic +1000% growth Bull Cycle.Amazon (AMZN) almost has been trading within a multi-year Channel Up pattern since the Housing Bubble bottom in November 2008 and this month almost touched its 1M MA50 (blue trend-line).
With the exception of the 2008 Housing Crisis and the 2022 Inflation Crisis, which bottomed on the 1M MA100 (gre

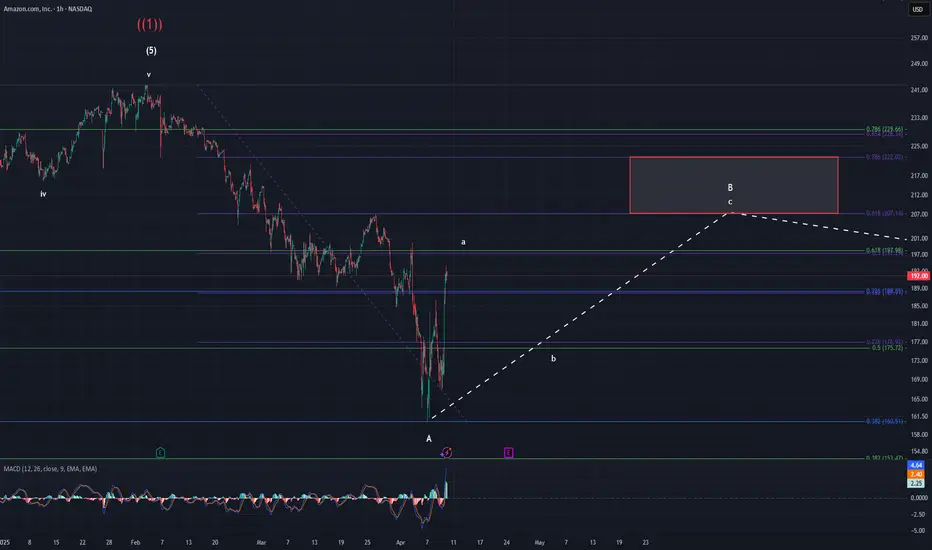
AmazonAs with the rest of the market, it seems that Amazon found its local bottom. If this pattern is to remain standard, it should ideally move slightly higher to finish of the a wave. Afterwards it should spend some time consolidating lower for b before raising up to the target box for c of B. This patt
the long-term investors of $AMZN look at its weekly chartSentiment:
Analysts maintain a bullish long-term outlook, with price targets up to $306 514.
Elliott Wave analysis suggests a corrective phase (Wave 2) targeting $159 before a potential reversal

Amazon I Technical & Tariff Analysis Welcome back! Let me know your thoughts in the comments!
** Amazon Analysis - Listen to video!
We recommend that you keep this pair on your watchlist and enter when the entry criteria of your strategy is met.
Please support this idea with a LIKE and COMMENT if you find it useful and Click "Follow

Amazon (AMZN): Eyeing a Long Opportunity Amid AI Growth Potentia-Key Insights: Amazon demonstrates a dual opportunity for investors. Short-term
technical analysis shows a bounce toward resistance levels at $188-$200, driven
by accumulation trends in broader tech stocks. Long-term catalysts include
undervaluation, a robust cloud computing business, and aggressive

OptionsMastery: This is the "h" DayTrading Pattern.This is the "h" pattern. A highly successful daytrading pattern!
🔉Sound on!🔉
📣Make sure to watch fullscreen!📣
Thank you as always for watching my videos. I hope that you learned something very educational! Please feel free to like, share, and comment on this post. Remember only risk what you are wi

Amazon puts On level 150 What i see on this there more down side to come but tomorrow is big one if china does not accept the agreement. to lower tariffs if we see A huge down side
Disclaimer- This what i think it will go

AMZN LONG/SHORT SET UP(Amazon) If $160.00 holds we can see $200
if we break below$160.00 we could see $140-$120
LONG TRADE
Entry 1 $175.00
Entry 2 $165.00
Stop loss $155.00
Take profit 1- $195.00
(Close 33%)
Take profit 2- $215.00
(Close 66%)
Take profit 3-$230.00

More Downside For AMZN Before CrossroadsMy overall thesis is we are in the very early stages of a multi-year decline ultimately with the S&P 500 below 3500. I am estimating this symbol to be in wave position SuperCycle 2, Cycle A, Primary 1, Intermediate 3 (pink), Minor 3 (yellow), Minute 5(green). I originally had this symbol nearly comp

See all ideas
Summarizing what the indicators are suggesting.
Neutral
SellBuy
Strong sellStrong buy
Strong sellSellNeutralBuyStrong buy
Neutral
SellBuy
Strong sellStrong buy
Strong sellSellNeutralBuyStrong buy
Neutral
SellBuy
Strong sellStrong buy
Strong sellSellNeutralBuyStrong buy
An aggregate view of professional's ratings.
Neutral
SellBuy
Strong sellStrong buy
Strong sellSellNeutralBuyStrong buy
Neutral
SellBuy
Strong sellStrong buy
Strong sellSellNeutralBuyStrong buy
Neutral
SellBuy
Strong sellStrong buy
Strong sellSellNeutralBuyStrong buy
Displays a symbol's price movements over previous years to identify recurring trends.
Curated watchlists where AMZN is featured.


Related stocks
Frequently Asked Questions
The current price of AMZN is 180.73 USD — it hasn't changed in the past 24 hours. Watch AMAZON COM INC stock price performance more closely on the chart.
Depending on the exchange, the stock ticker may vary. For instance, on BCS exchange AMAZON COM INC stocks are traded under the ticker AMZN.
AMZN stock has risen by 5.69% compared to the previous week, the month change is a −3.87% fall, over the last year AMAZON COM INC has showed a −2.40% decrease.
We've gathered analysts' opinions on AMAZON COM INC future price: according to them, AMZN price has a max estimate of 306.00 USD and a min estimate of 200.00 USD. Watch AMZN chart and read a more detailed AMAZON COM INC stock forecast: see what analysts think of AMAZON COM INC and suggest that you do with its stocks.
AMZN reached its all-time high on Mar 31, 2022 with the price of 314.94 USD, and its all-time low was 12.65 USD and was reached on Mar 22, 2013. View more price dynamics on AMZN chart.
See other stocks reaching their highest and lowest prices.
See other stocks reaching their highest and lowest prices.
AMZN stock is 6.25% volatile and has beta coefficient of 1.33. Track AMAZON COM INC stock price on the chart and check out the list of the most volatile stocks — is AMAZON COM INC there?
Today AMAZON COM INC has the market capitalization of 1.93 T, it has decreased by −8.80% over the last week.
Yes, you can track AMAZON COM INC financials in yearly and quarterly reports right on TradingView.
AMAZON COM INC is going to release the next earnings report on Apr 24, 2025. Keep track of upcoming events with our Earnings Calendar.
AMZN earnings for the last quarter are 1.86 USD per share, whereas the estimation was 1.49 USD resulting in a 25.14% surprise. The estimated earnings for the next quarter are 1.37 USD per share. See more details about AMAZON COM INC earnings.
AMAZON COM INC revenue for the last quarter amounts to 187.79 B USD, despite the estimated figure of 187.34 B USD. In the next quarter, revenue is expected to reach 155.02 B USD.
AMZN net income for the last quarter is 20.00 B USD, while the quarter before that showed 15.33 B USD of net income which accounts for 30.51% change. Track more AMAZON COM INC financial stats to get the full picture.
No, AMZN doesn't pay any dividends to its shareholders. But don't worry, we've prepared a list of high-dividend stocks for you.
As of Apr 15, 2025, the company has 1.56 M employees. See our rating of the largest employees — is AMAZON COM INC on this list?
EBITDA measures a company's operating performance, its growth signifies an improvement in the efficiency of a company. AMAZON COM INC EBITDA is 122.15 B USD, and current EBITDA margin is 19.15%. See more stats in AMAZON COM INC financial statements.
Like other stocks, AMZN shares are traded on stock exchanges, e.g. Nasdaq, Nyse, Euronext, and the easiest way to buy them is through an online stock broker. To do this, you need to open an account and follow a broker's procedures, then start trading. You can trade AMAZON COM INC stock right from TradingView charts — choose your broker and connect to your account.
Investing in stocks requires a comprehensive research: you should carefully study all the available data, e.g. company's financials, related news, and its technical analysis. So AMAZON COM INC technincal analysis shows the sell today, and its 1 week rating is sell. Since market conditions are prone to changes, it's worth looking a bit further into the future — according to the 1 month rating AMAZON COM INC stock shows the buy signal. See more of AMAZON COM INC technicals for a more comprehensive analysis.
If you're still not sure, try looking for inspiration in our curated watchlists.
If you're still not sure, try looking for inspiration in our curated watchlists.