$AMZN Cracks Once AgainIt should be no surprise that after massive gains such as we have seen lately, stocks tend to retrace 60-70% or more back to the origin from whence they came.
This is largely due to the Market Maker "Making a Market" for everyone to play in, but mostly so they don't loose any money.
The Tech spa
Key facts today
Next report date
—
Report period
—
EPS estimate
—
Revenue estimate
—
5,970 CLP
59.13 T CLP
636.69 T CLP
9.49 B
About Amazon.com
Sector
Industry
CEO
Andrew R. Jassy
Website
Headquarters
Seattle
Founded
1994
FIGI
BBG00YFSC9Z6
Amazon.com, Inc. is a multinational technology company, which engages in the provision of online retail shopping services. It operates through the following segments: North America, International, and Amazon Web Services (AWS). The North America segment offers retail sale of consumer products, including from sellers, advertising, and subscriptions services through North America-focused online and physical stores. The International segment focuses on retail sale of consumer products, including from sellers, advertising, and subscription services through internationally-focused online stores. The AWS segment is composed of global sales of compute, storage, database, and other services for start-ups, enterprises, government agencies, and academic institutions. The company was founded by Jeffrey P. Bezos in July 1994 and is headquartered in Seattle, WA.

AMAZON eyes $255 on the 3rd such buy signal in 18 months!AMAZON Inc. (AMZN) has been trading within a 18-month Bullish Megaphone pattern whose latest bottom was on the April 07 2025 Low. Since then, the pattern has started its new Bullish Leg, which has been confirmed by the break-out above its 1D MA50 (blue trend-line) and the 1W RSI's above its MA.
The

Heikin Ashi VS Regular candlesticks - EducationalNASDAQ:AMZN
Everything is explained in the video.
I hope you will find it very educational and test it. Those who trade stocks will probably switch to Heikin Ashi :)
Thank you!

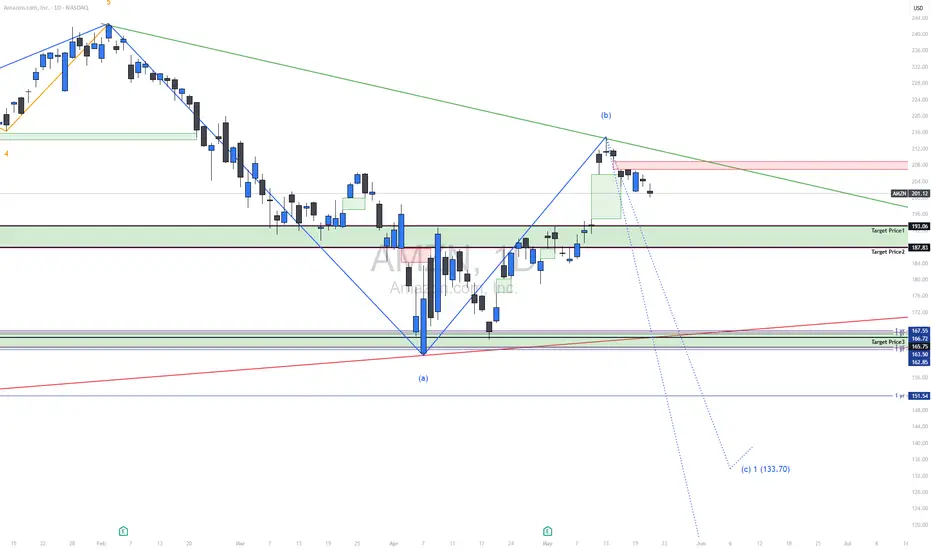
SHORT | AMZN NASDAQ:AMZN
Current Price Action:
Price: $201.12
Recent Drop: -2.95 (-1.45%)
Support and Resistance Levels:
Immediate Resistance: $208–$212 (recent rejection zone)
Immediate Support: $193.06 (Target Price 1)
Further Supports:
Target Price 2: $187.83
Target Price 3: $167.55
Target Pri
Using Advanced Hybrid Leading Indicators for Swing Trading The professional side of the stock market has undergone massive infrastructural changes in the past 5 years. These changes are unknown to most retail traders and that can pose major problems for you success and profitability no matter what trading style you use.
A trading style is a type of trading

Steady Support at $200: Is It a Prime Opportunity to Go Long?
Targets:
- T1 = $209.00
- T2 = $215.00
Stop Levels:
- S1 = $198.00
- S2 = $193.00
**Wisdom of Professional Traders:**
This analysis synthesizes insights from thousands of professional traders and market experts, leveraging collective intelligence to identify high-probability trade setups. The w

Amazon UpdatePrice has re-entered the target box. I mentioned last week that price could still try to target the 1.618 @ $220.01. Judging by the ES, I think it is highly likely that is what is going on. We're still currently trading on hidden bearish divergence which doesn't bode well for a sustained move higher

AMZN - PULLBACK INTO NEXT SWINGGood Morning,
AMZN - Another stock that initiated a pullback. Not to fear, AMZN is trending towards a support. If it does not hold we would experience lower lows. My opinion is that it will hold given the strong bullish momentum. We will see it complete its final wave and then a correction.
ENJO

AMZN | Long | Strong Earnings Momentum | (May 28, 2025)AMZN | Long | Strong Earnings Momentum + Structural Breakout | (May 28, 2025)
1️⃣ Quick Recap: We're in a long trade on Amazon (AMZN), and the setup is unfolding well. TP1 and TP2 have already been hit after flipping key resistance into support. The trend is intact, and we're now aiming for higher

$NVDA $TSLA $META $AMZN – Triangle Squeeze Incoming?📊 Symmetrical triangle formations are building across these tech giants — and volatility is compressing.
🔍 What to watch:
📈 Breakout above upper trendline = bullish momentum
📉 Breakdown below lower trendline = bearish confirmation
📉 RSI on NASDAQ:NVDA is at 73.04 = overbought warning
⚠️ NASD

See all ideas
Summarizing what the indicators are suggesting.
Neutral
SellBuy
Strong sellStrong buy
Strong sellSellNeutralBuyStrong buy
Neutral
SellBuy
Strong sellStrong buy
Strong sellSellNeutralBuyStrong buy
Neutral
SellBuy
Strong sellStrong buy
Strong sellSellNeutralBuyStrong buy
An aggregate view of professional's ratings.
Neutral
SellBuy
Strong sellStrong buy
Strong sellSellNeutralBuyStrong buy
Neutral
SellBuy
Strong sellStrong buy
Strong sellSellNeutralBuyStrong buy
Neutral
SellBuy
Strong sellStrong buy
Strong sellSellNeutralBuyStrong buy
Displays a symbol's price movements over previous years to identify recurring trends.
Curated watchlists where AMZNCL is featured.


Related stocks
Frequently Asked Questions
The current price of AMZNCL is 189,940 CLP — it has increased by 2.24% in the past 24 hours. Watch AMAZON COM INC stock price performance more closely on the chart.
Depending on the exchange, the stock ticker may vary. For instance, on BCS exchange AMAZON COM INC stocks are traded under the ticker AMZNCL.
AMZNCL stock has risen by 0.41% compared to the previous week, the month change is a 11.69% rise, over the last year AMAZON COM INC has showed a 15.07% increase.
We've gathered analysts' opinions on AMAZON COM INC future price: according to them, AMZNCL price has a max estimate of 270,931.33 CLP and a min estimate of 183,443.09 CLP. Watch AMZNCL chart and read a more detailed AMAZON COM INC stock forecast: see what analysts think of AMAZON COM INC and suggest that you do with its stocks.
AMZNCL reached its all-time high on Dec 19, 2024 with the price of 238,000 CLP, and its all-time low was 71,520 CLP and was reached on Jan 5, 2023. View more price dynamics on AMZNCL chart.
See other stocks reaching their highest and lowest prices.
See other stocks reaching their highest and lowest prices.
AMZNCL stock is 2.24% volatile and has beta coefficient of 1.35. Track AMAZON COM INC stock price on the chart and check out the list of the most volatile stocks — is AMAZON COM INC there?
Today AMAZON COM INC has the market capitalization of 2,043.63 T, it has increased by 1.86% over the last week.
Yes, you can track AMAZON COM INC financials in yearly and quarterly reports right on TradingView.
AMAZON COM INC is going to release the next earnings report on Jul 31, 2025. Keep track of upcoming events with our Earnings Calendar.
AMZNCL earnings for the last quarter are 1.52 K CLP per share, whereas the estimation was 1.30 K CLP resulting in a 16.38% surprise. The estimated earnings for the next quarter are 1.24 K CLP per share. See more details about AMAZON COM INC earnings.
AMAZON COM INC revenue for the last quarter amounts to 148.40 T CLP, despite the estimated figure of 147.90 T CLP. In the next quarter, revenue is expected to reach 152.00 T CLP.
AMZNCL net income for the last quarter is 16.33 T CLP, while the quarter before that showed 19.96 T CLP of net income which accounts for −18.22% change. Track more AMAZON COM INC financial stats to get the full picture.
No, AMZNCL doesn't pay any dividends to its shareholders. But don't worry, we've prepared a list of high-dividend stocks for you.
As of May 31, 2025, the company has 1.56 M employees. See our rating of the largest employees — is AMAZON COM INC on this list?
EBITDA measures a company's operating performance, its growth signifies an improvement in the efficiency of a company. AMAZON COM INC EBITDA is 121.93 T CLP, and current EBITDA margin is 19.15%. See more stats in AMAZON COM INC financial statements.
Like other stocks, AMZNCL shares are traded on stock exchanges, e.g. Nasdaq, Nyse, Euronext, and the easiest way to buy them is through an online stock broker. To do this, you need to open an account and follow a broker's procedures, then start trading. You can trade AMAZON COM INC stock right from TradingView charts — choose your broker and connect to your account.
Investing in stocks requires a comprehensive research: you should carefully study all the available data, e.g. company's financials, related news, and its technical analysis. So AMAZON COM INC technincal analysis shows the buy rating today, and its 1 week rating is neutral. Since market conditions are prone to changes, it's worth looking a bit further into the future — according to the 1 month rating AMAZON COM INC stock shows the buy signal. See more of AMAZON COM INC technicals for a more comprehensive analysis.
If you're still not sure, try looking for inspiration in our curated watchlists.
If you're still not sure, try looking for inspiration in our curated watchlists.