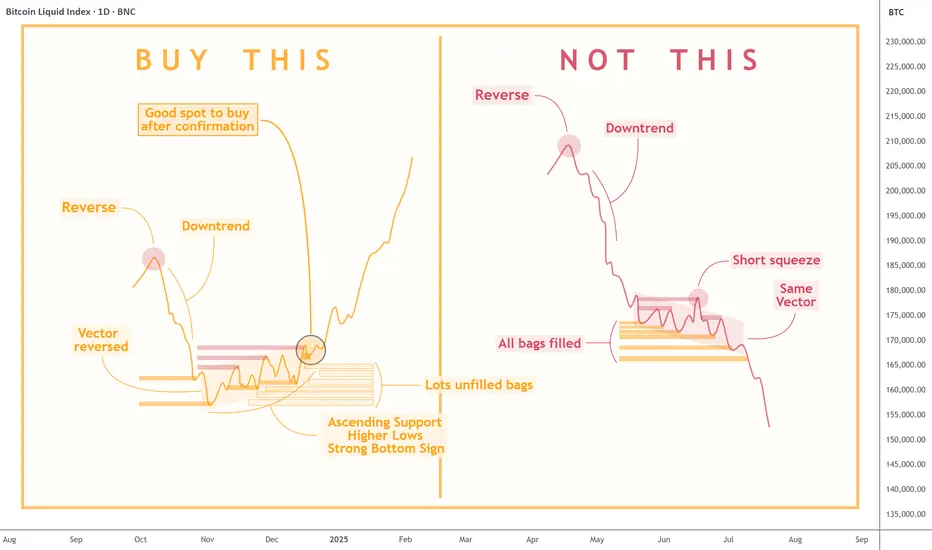
Quick Lesson: How to Identify Trend ReversalKnowing when to enter the market can mean the difference between making a profit and incurring a loss. The chart above clearly compares two similar-looking scenarios with very different outcomes: the one you should aim for and the one you should avoid.
- On the left , we see a textbook example
Key data points
Previous close
—
Open
—
Day's range
—
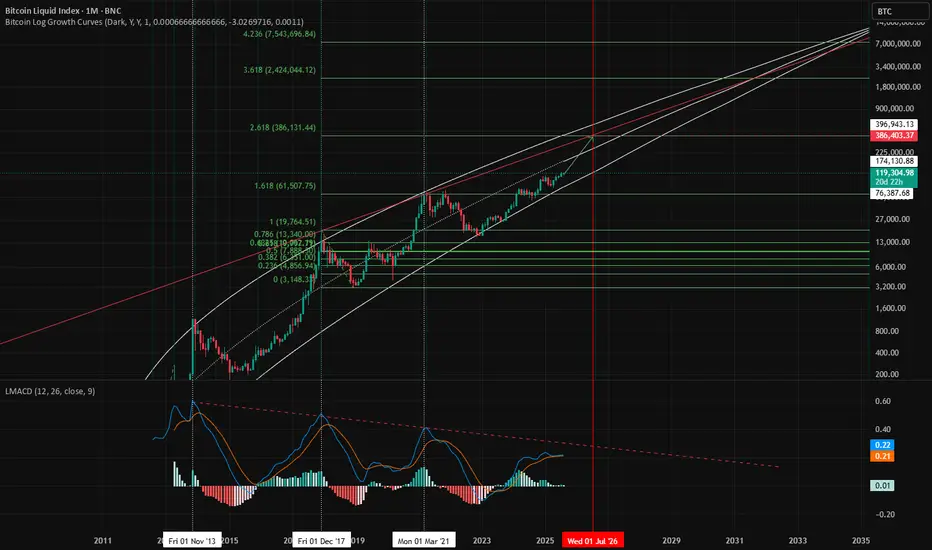
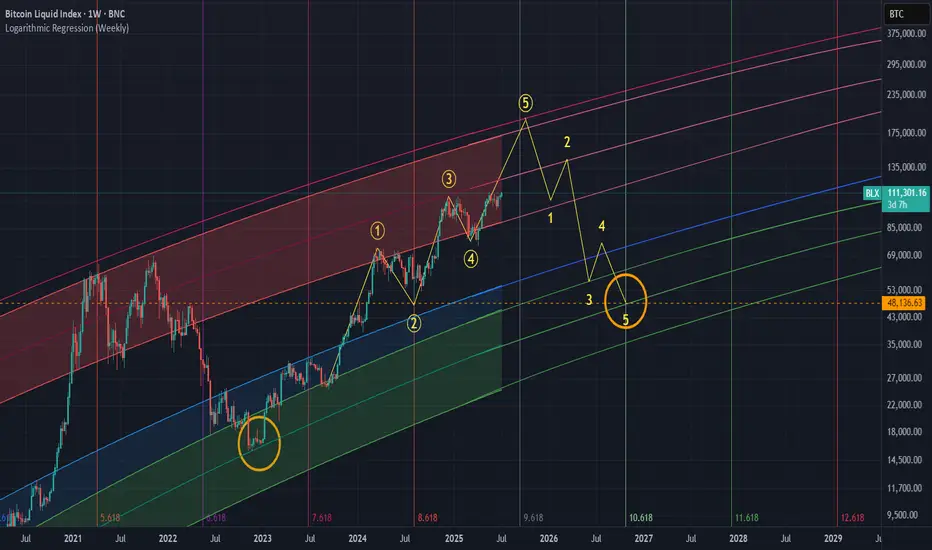
Math is Not Magic - BTCUSD Price Prediction 2026Looks like this pump will be extended. Using fibs on time and price, 380K is my target, timeframe is between March thru June of 2026. Watch for alts afterwards for rotation.
Good luck.
Btc Daily AnalysisBTCUSD just completed a 3 wave (b) correction to the downtrend from what I can see, expect further downward pressure. Watch for a target of around <$100k for the next leg down

Long term Bitcoin view: the path to $100kI think Bitcoin will make a correction in the short run. The next target price can be $42k.
However I predict further gains in price in the mid run. The target of $100k may be achieved then. Though it is a far stretched number, I still expect a price move to that level.
If fail, we can expect a c

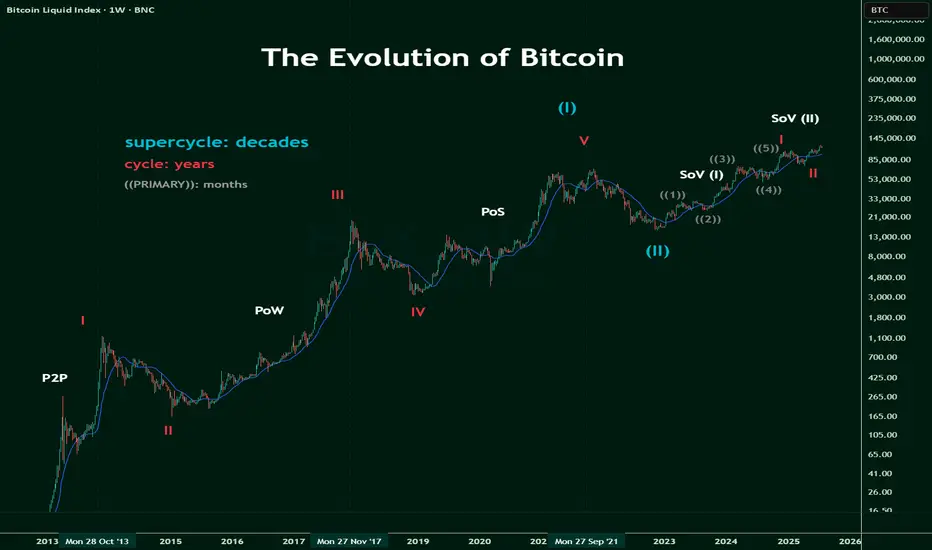
The Evolution of BitcoinNot Financial Advice
Born in 2009, bitcoin was a proof of concept out of an esoteric online forum.
It was intended as a secure, swift, P2P solution to transact on a global stage without global scrutiny nor supervision.
Sure it worked, but would it last?
Then Proof of Work, PoW , showed it's e
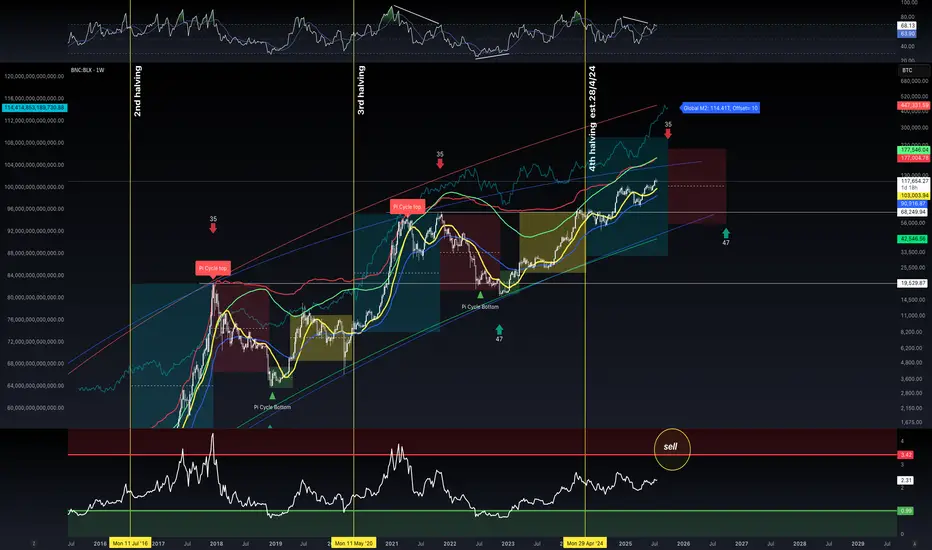
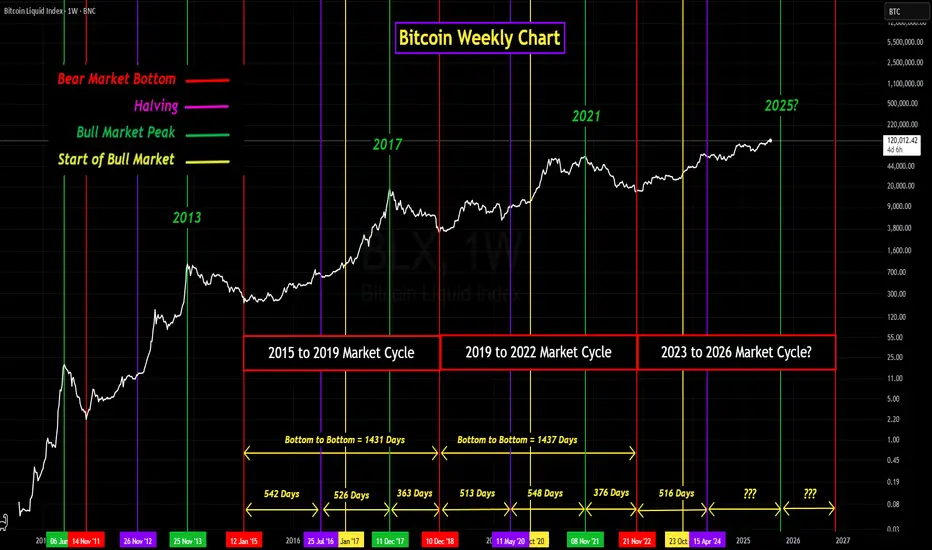
GROK's Analysis of Bitcoin's 4-Year Market CyclesIn the past I have published my own analysis of Bitcoin's 4-year market cycles, (cycles 2 and 3).
My purpose for analyzing the market cycles was to determine how similar in elapsed times the last two market cycles were to each other. Not only in the length of the overall market cycle but also betwee
Livermore’s Speculative Blueprint: Are We Near the Final Act?Livermore’s Speculative Blueprint: Are We Near the Final Act?
Bitcoin’s price action since 2022 eerily mirrors Jesse Livermore’s legendary “Speculative Chart,” a timeless model of market psychology and price behavior. The attached overlay illustrates how BTC has respected nearly every phase—accumul

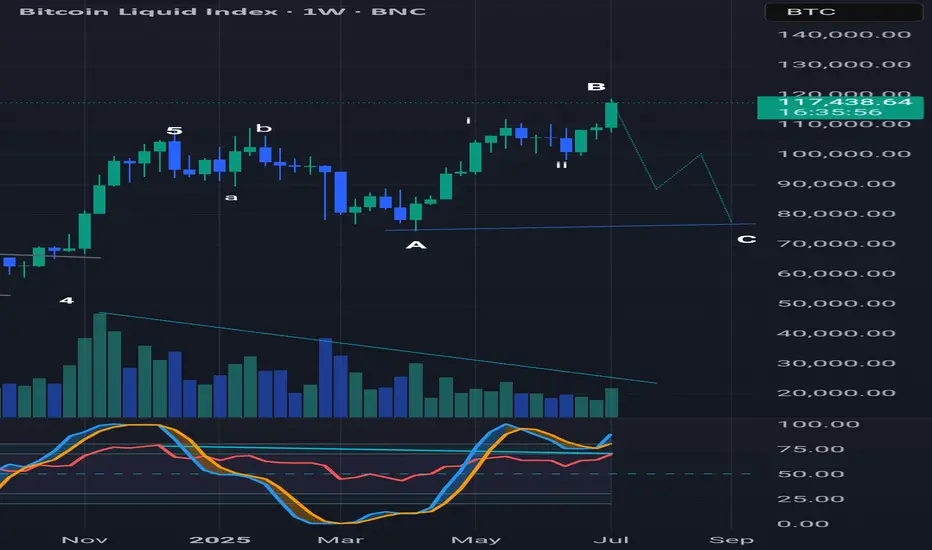
Running flat? Weekly chart wave analysisA running flat is where the B wave exceeds the starting point of wave A and the subsequent drop of wave C does not exceed the wave A low. Also note the declining volume and bearish divergence with the RSI on the weekly (and monthly) chart suggesting this move up is losing momentum.
The Final Parabola: What History Says About Bitcoin’s July MovesIf you’ve been following here for a while, you know we’ve been nearly pinpoint in calling all the moves for Bitcoin. The altcoin market, not so much, but check out previous TAs to catch up on my perspective.
The two wave counts you see on the main chart have been in place for many months, I believe
See all ideas
Displays a symbol's price movements over previous years to identify recurring trends.