7/8/25 - $qs - Pass. No thanks.7/8/25 :: VROCKSTAR :: NYSE:QS
Pass. No thanks.
- Great story bro, company
- Does this thing continue to ape higher a la meme market? idk idc
- I think pre-revenue stuff can be interesting if there's clear visibility toward scaling revenue or the costs are contained, but let's be real... 4 years
−0.002 BRL
−2.58 B BRL
0.00 BRL
About QuantumScape Corporation
Sector
Industry
CEO
Srinivasan Sivaram
Website
Headquarters
San Jose
Founded
2010
ISIN
BRQ2SCBDR001
FIGI
BBG014XK2WN1
QuantumScape Corp. engages in the provision of energy storage solutions. The company was founded by Jagdeep Singh, Tim Holme, and Fritz B. Prinz in May 2010 and is headquartered in San Jose, CA.
Related stocks

QS heading a lot higherFor those that have been following me for a while know I have been a long time holder of QS and have been accumulating even up until yesterday. Its been a long painful hold but I believe we are finally ready to begin the upward trajectory that many expected. I pointed out in the chart where most ret

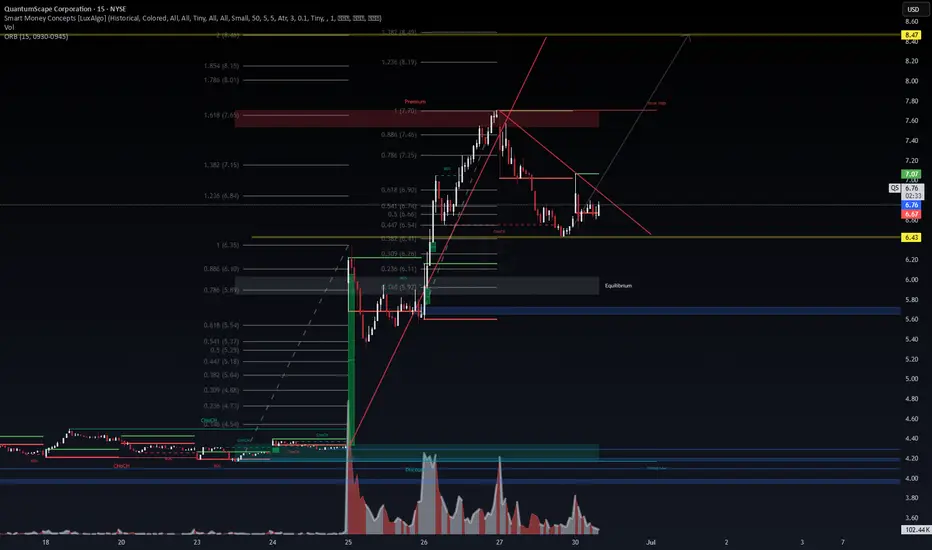
QuantumScape ($QS) – VolanX SMC Activation Zone🔍 Technical Context
QuantumScape is setting up for a potential bullish breakout after consolidating within a descending wedge and maintaining structure above the golden Fibonacci pocket (0.5–0.618 zone). Smart Money Concepts (CHoCH + BOS) have been triggered, indicating the start of institutional po
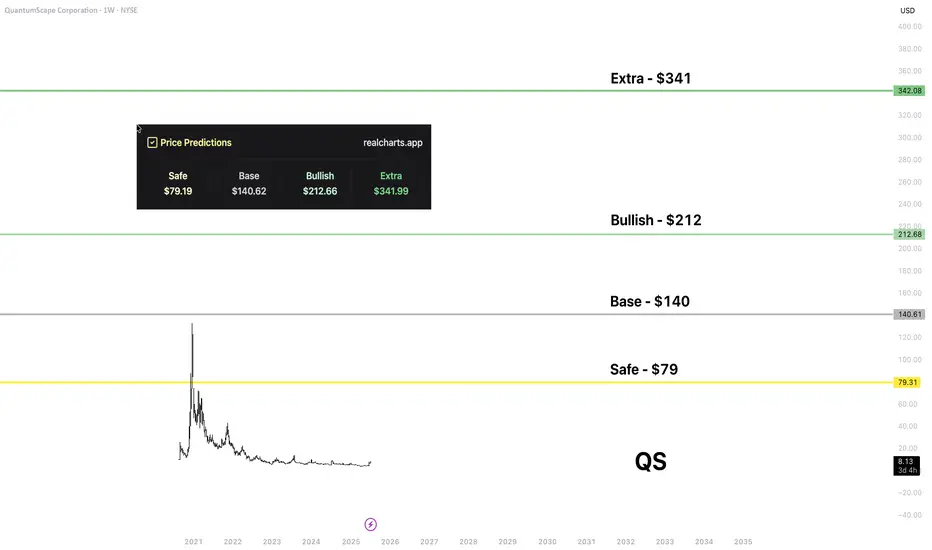
QS | Price PredictionNYSE:QS is one of the most promising assets in my stock portfolio. I expect massive upside and becoming revenue positive from 2026-27.
That level is from my platform. I think the "safe" is the most realistic in the first phase of the upside, and the "base" is quite realistic too. For the next lev
QuantumScape ($QS) | Long-Term Bet on Solid-State Battery RevoluQuantumScape has officially re-entered our radar after today's +32.72% move—driven by their “Cobra” separator scaling breakthrough. Volume surged to 171M+ confirming a major displacement event.
From a Smart Money Concepts (SMC) lens, the market structure shows repeated Change of Character (ChoCH) a

QuantumScape Stock Chart Fibonacci Analysis 061125Trading Idea
1) Find a FIBO slingshot
2) Check FIBO 61.80% level
3) Entry Point > 4.25/61.80%
Chart time frame:B
A) 15 min(1W-3M)
B) 1 hr(3M-6M)
C) 4 hr(6M-1year)
D) 1 day(1-3years)
Stock progress:B
A) Keep rising over 61.80% resistance
B) 61.80% resistance
C) 61.80% support
D) Hit the bottom
E

OK, who’s been dumping QS. Is it time to hop on this ride UPTechnical Analysis for QuantumScape (QS) - Daily Chart
Trend Analysis & Market Structure:
• Current Price: $5.12 (+0.99%)
• Short-Term Trend: Bearish
• Price is trading below short-term moving averages, indicating continued weakness.
• Failed breakout attempts in recent weeks suggest strong resis

QS one to put in the booksYes they are dirt cheap and have been but this company is in position to have explosive results. They are operating right now at a negative balance per year. However They have somewhere around $821 million to use for R&D and just signed a deal with one of The V named Car Companies I want to say V

QS next to go?After seeing over 1000% on RGTI and IONQ
QS is offering a very similar setup with great R:R
Can see $10 in the first semester

QS LongQS has broken out of the downtrend from July/August, retested it, and is continuing higher on increasing volume. The MACD is still bullish. Because of the MACRO breakout it's likely we squeeze higher. I missed the A+ trend retest entry but there's still a good Risk to Reward on this trade. Roughly 5

See all ideas
Summarizing what the indicators are suggesting.
Oscillators
Neutral
SellBuy
Strong sellStrong buy
Strong sellSellNeutralBuyStrong buy
Oscillators
Neutral
SellBuy
Strong sellStrong buy
Strong sellSellNeutralBuyStrong buy
Summary
Neutral
SellBuy
Strong sellStrong buy
Strong sellSellNeutralBuyStrong buy
Summary
Neutral
SellBuy
Strong sellStrong buy
Strong sellSellNeutralBuyStrong buy
Summary
Neutral
SellBuy
Strong sellStrong buy
Strong sellSellNeutralBuyStrong buy
Moving Averages
Neutral
SellBuy
Strong sellStrong buy
Strong sellSellNeutralBuyStrong buy
Moving Averages
Neutral
SellBuy
Strong sellStrong buy
Strong sellSellNeutralBuyStrong buy
Displays a symbol's price movements over previous years to identify recurring trends.