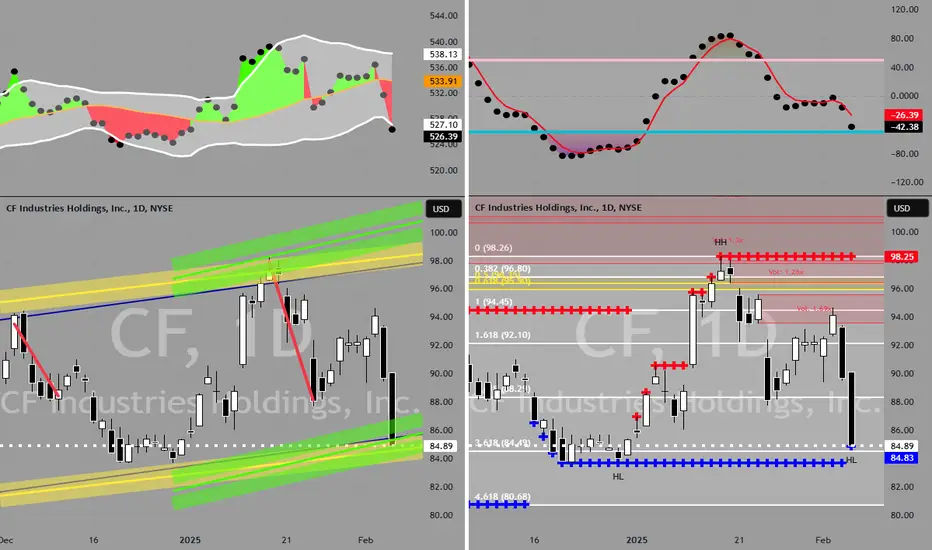
CF to $88My trading plan is very simple.
I buy or sell when:
* Price tags the top or bottom of parallel channels
* Money flow spikes above it's Bollinger Bands
* Price at Fibonacci levels
So...
Here's why I'm picking this symbol to do the thing.
Price in channel zones at bottom of channels (period 100 5
Key facts today
Next report date
—
Report period
—
EPS estimate
—
Revenue estimate
—
155.50 MXN
25.39 B MXN
123.76 B MXN
160.80 M
About CF Industries Holdings, Inc.
Sector
Industry
CEO
W. Anthony Will
Website
Headquarters
Northbrook
Founded
1946
FIGI
BBG0169YYPQ0
CF Industries Holdings, Inc. engages in the manufacture and distribution of nitrogen fertilizer. The firm owns and operates nitrogen plants and serves agricultural and industrial customers through its distribution system. It operates through the following segments: Ammonia, Granular Urea, UAN, AN, and Other. The Ammonia segment produces anhydrous ammonia. The Granular Urea segment offers granular urea. The UAN segment focuses on urea ammonium nitrate solution. The AN segment refers to the production of ammonium nitrate. The Other segment includes diesel exhaust fluid, nitric acid, urea liquor, and aqua ammonia. The company was founded in 1946 and is headquartered in Northbrook, IL.
Related stocks
CF Industries Shows Signs of BottomingCF Industries has moved sideway for almost two years, but some traders may think the fertilizer stock is bottoming.
The first pattern on today’s chart is the rally between September 11 and October 4. That move established a new 52-week high. It was followed by a pullback to the September 20 weekly

NYSE> Industries Holdings! BUYBased on my graphic analysis, I observe a bullish projection of 25% in the price of this corporation, that is; from $84 it will rise to $104. With an emerging sell exit at $72, it is worth remembering that the exact time the rise will take is unpredictable, the market will simply do its job. We can


$CF: Reasonable break of 85CF had a monsterous candle through the 85 handle and I'm looking to see if it'll persistent. MOS may also be looking to push through 40. Best of luck traders


CF by after correction. Good financial parametersIdea:
Stabilization after fall. Possible growth
SL < 81
Buy < 85.31
Con: Stoploss is far away
Technical:
- Con: Less than 50% growth potential
Financial:
- Growth (RoE to Gross margin screen)
- Pro: Growing Gross margin
- Pro: Debt to equity is falling
- Pro: P/E is falling
- Pro: RoE is growing

$CF, Waiting for trend changeCompany with good fundamentals:
1) Management has been aggressively buying back shares
2) Strong earnings should allow management to continue dividend payments
3) Prominent player in the Chemicals industry
4) Stock has fared poorly over the last month, we shall wait at the moment

CF // Double bottom formation Resistance breakdown requiredAlthough there is a double bottom formation on the chart, let's look for closures where I indicated with X.

See all ideas
Summarizing what the indicators are suggesting.
Neutral
SellBuy
Strong sellStrong buy
Strong sellSellNeutralBuyStrong buy
Neutral
SellBuy
Strong sellStrong buy
Strong sellSellNeutralBuyStrong buy
Neutral
SellBuy
Strong sellStrong buy
Strong sellSellNeutralBuyStrong buy
An aggregate view of professional's ratings.
Neutral
SellBuy
Strong sellStrong buy
Strong sellSellNeutralBuyStrong buy
Neutral
SellBuy
Strong sellStrong buy
Strong sellSellNeutralBuyStrong buy
Neutral
SellBuy
Strong sellStrong buy
Strong sellSellNeutralBuyStrong buy
Displays a symbol's price movements over previous years to identify recurring trends.
CF4008574
CF Industries, Inc. 4.95% 01-JUN-2043Yield to maturity
6.39%
Maturity date
Jun 1, 2043
CF4105319
CF Industries, Inc. 5.375% 15-MAR-2044Yield to maturity
6.23%
Maturity date
Mar 15, 2044
CF4105321
CF Industries, Inc. 5.15% 15-MAR-2034Yield to maturity
5.31%
Maturity date
Mar 15, 2034
CF4425806
CF Industries, Inc. 4.5% 01-DEC-2026Yield to maturity
4.53%
Maturity date
Dec 1, 2026
See all CF bonds
Frequently Asked Questions
The current price of CF is 1,597.23 MXN — it has decreased by −5.28% in the past 24 hours. Watch CF INDUSTRIES HOLDINGS INC stock price performance more closely on the chart.
Depending on the exchange, the stock ticker may vary. For instance, on BMV exchange CF INDUSTRIES HOLDINGS INC stocks are traded under the ticker CF.
We've gathered analysts' opinions on CF INDUSTRIES HOLDINGS INC future price: according to them, CF price has a max estimate of 2,087.05 MXN and a min estimate of 1,422.99 MXN. Watch CF chart and read a more detailed CF INDUSTRIES HOLDINGS INC stock forecast: see what analysts think of CF INDUSTRIES HOLDINGS INC and suggest that you do with its stocks.
CF stock is 5.57% volatile and has beta coefficient of 0.42. Track CF INDUSTRIES HOLDINGS INC stock price on the chart and check out the list of the most volatile stocks — is CF INDUSTRIES HOLDINGS INC there?
Today CF INDUSTRIES HOLDINGS INC has the market capitalization of 291.03 B, it has increased by 6.24% over the last week.
Yes, you can track CF INDUSTRIES HOLDINGS INC financials in yearly and quarterly reports right on TradingView.
CF INDUSTRIES HOLDINGS INC is going to release the next earnings report on Aug 6, 2025. Keep track of upcoming events with our Earnings Calendar.
CF earnings for the last quarter are 40.45 MXN per share, whereas the estimation was 30.29 MXN resulting in a 33.53% surprise. The estimated earnings for the next quarter are 43.15 MXN per share. See more details about CF INDUSTRIES HOLDINGS INC earnings.
CF INDUSTRIES HOLDINGS INC revenue for the last quarter amounts to 34.07 B MXN, despite the estimated figure of 31.57 B MXN. In the next quarter, revenue is expected to reach 33.32 B MXN.
CF net income for the last quarter is 6.39 B MXN, while the quarter before that showed 6.84 B MXN of net income which accounts for −6.53% change. Track more CF INDUSTRIES HOLDINGS INC financial stats to get the full picture.
Yes, CF dividends are paid quarterly. The last dividend per share was 9.75 MXN. As of today, Dividend Yield (TTM)% is 2.11%. Tracking CF INDUSTRIES HOLDINGS INC dividends might help you take more informed decisions.
CF INDUSTRIES HOLDINGS INC dividend yield was 2.34% in 2024, and payout ratio reached 29.67%. The year before the numbers were 2.01% and 20.33% correspondingly. See high-dividend stocks and find more opportunities for your portfolio.
As of Jun 26, 2025, the company has 2.8 K employees. See our rating of the largest employees — is CF INDUSTRIES HOLDINGS INC on this list?
EBITDA measures a company's operating performance, its growth signifies an improvement in the efficiency of a company. CF INDUSTRIES HOLDINGS INC EBITDA is 59.60 B MXN, and current EBITDA margin is 44.91%. See more stats in CF INDUSTRIES HOLDINGS INC financial statements.
Like other stocks, CF shares are traded on stock exchanges, e.g. Nasdaq, Nyse, Euronext, and the easiest way to buy them is through an online stock broker. To do this, you need to open an account and follow a broker's procedures, then start trading. You can trade CF INDUSTRIES HOLDINGS INC stock right from TradingView charts — choose your broker and connect to your account.
Investing in stocks requires a comprehensive research: you should carefully study all the available data, e.g. company's financials, related news, and its technical analysis. So CF INDUSTRIES HOLDINGS INC technincal analysis shows the buy rating today, and its 1 week rating is neutral. Since market conditions are prone to changes, it's worth looking a bit further into the future — according to the 1 month rating CF INDUSTRIES HOLDINGS INC stock shows the neutral signal. See more of CF INDUSTRIES HOLDINGS INC technicals for a more comprehensive analysis.
If you're still not sure, try looking for inspiration in our curated watchlists.
If you're still not sure, try looking for inspiration in our curated watchlists.