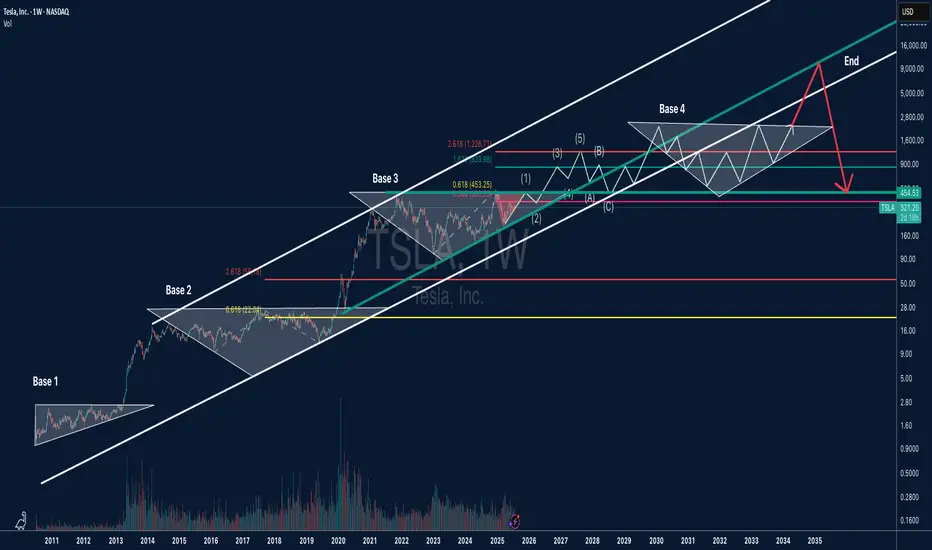
TSLA Long-Term Bold Projection (2025-2035)This is a long-term analysis of Tesla (TSLA) stock on the weekly timeframe, combining Elliott Wave Theory, Fibonacci extensions, and price structure (base formations) within a broad logarithmic trend channel.
Key Highlights:
🔹 Base Formations:
Base 1 (2010–2013): First consolidation before TSLA’s
Key facts today
Next report date
—
Report period
—
EPS estimate
—
Revenue estimate
—
35.43 MXN
148.66 B MXN
2.04 T MXN
2.81 B
About Tesla
Sector
Industry
CEO
Elon Reeve Musk
Website
Headquarters
Austin
Founded
2003
FIGI
BBG0060GVHG1
Tesla, Inc. engages in the design, development, manufacture, and sale of electric vehicles and energy generation and storage systems. It operates through the Automotive and Energy Generation and Storage segments. The Automotive segment includes the design, development, manufacture, sale, and lease of electric vehicles as well as sales of automotive regulatory credits. The Energy Generation and Storage segment is involved in the design, manufacture, installation, sale, and lease of solar energy generation, energy storage products, and related services and sales of solar energy systems incentives. The company was founded by Jeffrey B. Straubel, Elon Reeve Musk, Martin Eberhard, and Marc Tarpenning on July 1, 2003 and is headquartered in Austin, TX.
Related stocks
Inflection point"Tesla is at a binary point on the chart. The stock is wedged tightly between the red, downward-sloping resistance line (upper boundary) and the green, upward-sloping support line (lower boundary)—the classic apex of an asymmetrical triangle.
At this stage:
A breakout above the red resistance woul
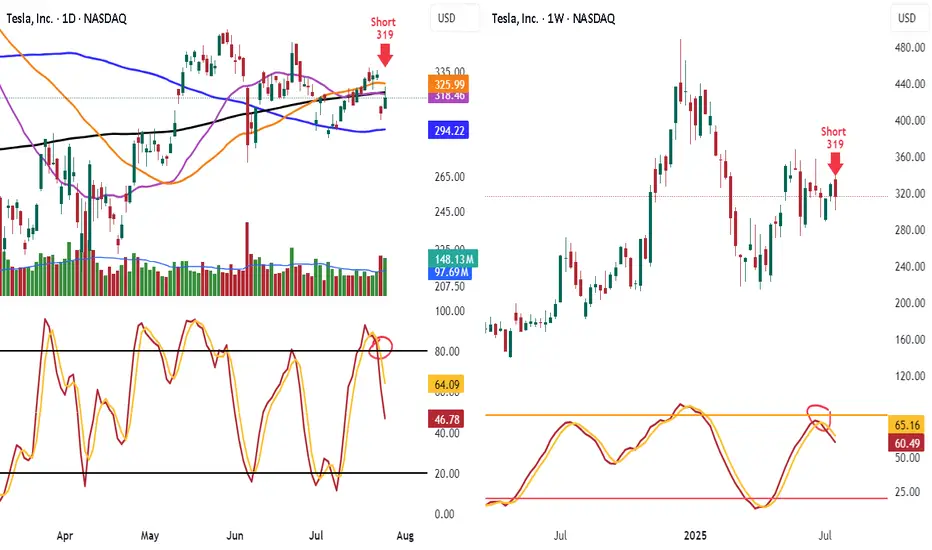
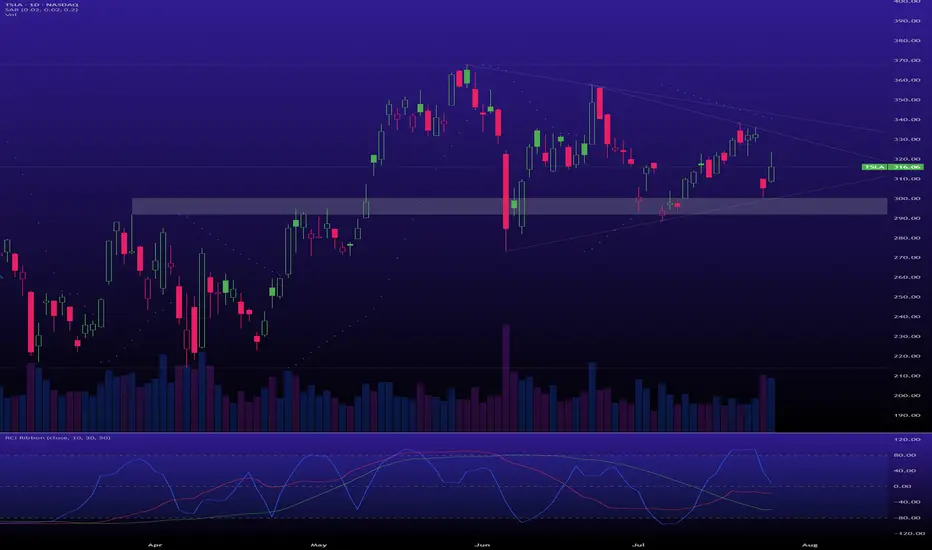
TSLA: Watching for short. I think there might be sell off, looking at the chart. I could be wrong so ll observe for now. I will go in if the momentum towards downward accelerate.
Shorted TSLA 319 Look at TSLA hit 50 day and 200 day MA and failed and know under them
Look at the lower highs and see the stoch heading down
Know lets look weekly stoch heading down and lower highs
Target is 100 day ma 294.22 take some off. When it breaks will add back on
Have trailing stop in place
Tesla Stock in Bearish Trend - Further Downside ExpectedTesla Stock in Bearish Trend - Further Downside Expected
Tesla's (TSLA) stock price continues to display a clear bearish trend structure, characterized by the formation of consistent lower lows and lower highs on the price chart. This technical pattern suggests sustained selling pressure and indica

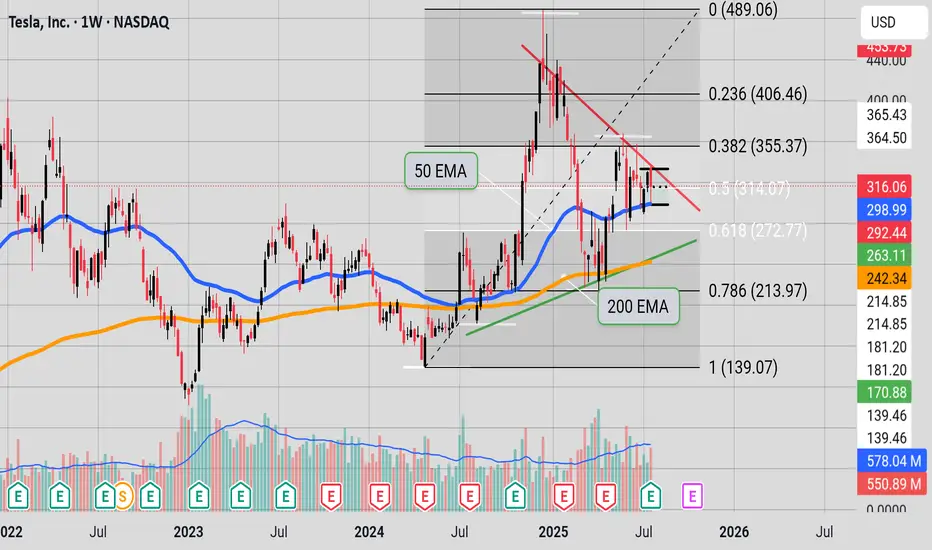
$TSLA is in an accumulation phase.A classic Wyckoff scenario is playing out, offering a prime opportunity if you have the nerve for it.
Support: The key support zone is $300 - $305. As long as this holds, the bullish thesis is intact.
Resistance: The primary target is the top of the multi-month accumulation range, around $370 - $38
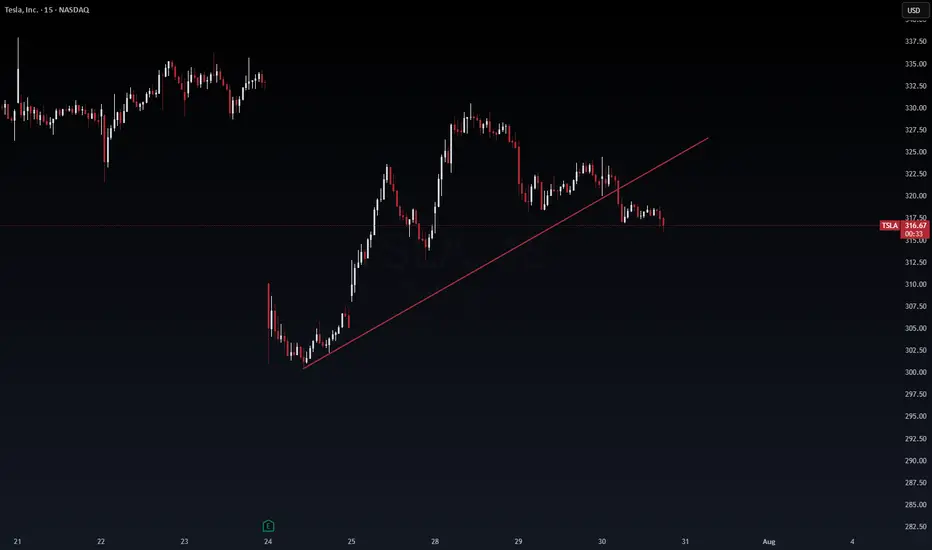
$TSLA: Breakout Wave Dimensions🏛️ Research Notes
Apart from known compression patterns for Tesla, there is another squeeze happening on smaller scale:
That area will be processed to derive the chart-based levels and see how market reacts to them.
Triangle
Breakout Expansion

TESLA POST EARNING 24 JULY 2025This is Post earning analysis for Tesla . I have clearly explained all the levels. Please trade carefully & try to stick to your plan.
NOTE: FOLLOW THE LEVELS

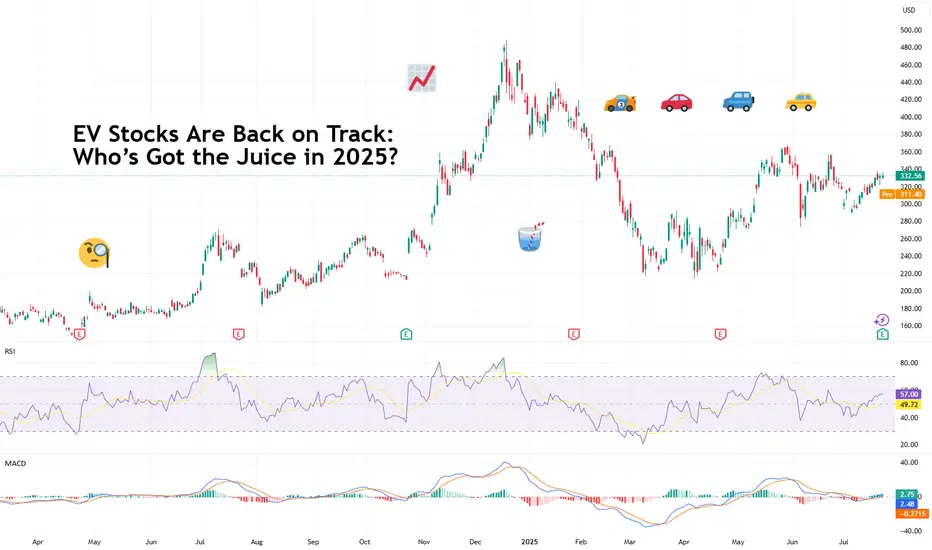
EV Stocks Are Back on Track: Who’s Got the Juice in 2025?This year is big for the EV sector so we figured let’s do a piece on it and bring you up to speed on who’s making moves and getting traction — both in the charts and on the road.
What we’ve got here is a lean, mean lineup of real contenders. Let’s go for a ride.
🚗 Tesla: Still King of the Roa
Two Trades to go Bullish on TSLAHello, I’m The Cafe Trader.
We’ve been tracking the MAG 7, and Tesla is the next focus for our short-term options or swing trade strategy.
I’m looking at two scenarios that are likely to play out with TSLA over the next few weeks.
For fundamental and long-term analysis, check my other article on T

See all ideas
Summarizing what the indicators are suggesting.
Neutral
SellBuy
Strong sellStrong buy
Strong sellSellNeutralBuyStrong buy
Neutral
SellBuy
Strong sellStrong buy
Strong sellSellNeutralBuyStrong buy
Neutral
SellBuy
Strong sellStrong buy
Strong sellSellNeutralBuyStrong buy
An aggregate view of professional's ratings.
Neutral
SellBuy
Strong sellStrong buy
Strong sellSellNeutralBuyStrong buy
Neutral
SellBuy
Strong sellStrong buy
Strong sellSellNeutralBuyStrong buy
Neutral
SellBuy
Strong sellStrong buy
Strong sellSellNeutralBuyStrong buy
Displays a symbol's price movements over previous years to identify recurring trends.
TSLA4317805
Tesla Energy Operations, Inc. 5.45% 17-DEC-2030Yield to maturity
11.26%
Maturity date
Dec 17, 2030
TSLA4296328
Tesla Energy Operations, Inc. 5.45% 16-OCT-2030Yield to maturity
10.51%
Maturity date
Oct 16, 2030
TSLA4290558
Tesla Energy Operations, Inc. 5.45% 01-OCT-2030Yield to maturity
9.82%
Maturity date
Oct 1, 2030
TSLA4247202
Tesla Energy Operations, Inc. 5.45% 21-MAY-2030Yield to maturity
9.30%
Maturity date
May 21, 2030
TSLA4286421
Tesla Energy Operations, Inc. 5.45% 17-SEP-2030Yield to maturity
8.52%
Maturity date
Sep 17, 2030
TSLA4324758
Tesla Energy Operations, Inc. 4.7% 14-JAN-2026Yield to maturity
8.01%
Maturity date
Jan 14, 2026
TSLA4231716
Tesla Energy Operations, Inc. 5.45% 23-APR-2030Yield to maturity
7.89%
Maturity date
Apr 23, 2030
TSLA4250220
Tesla Energy Operations, Inc. 5.45% 29-MAY-2030Yield to maturity
7.67%
Maturity date
May 29, 2030
TSLA4313161
Tesla Energy Operations, Inc. 5.45% 03-DEC-2030Yield to maturity
7.43%
Maturity date
Dec 3, 2030
TSLA4222068
Tesla Energy Operations, Inc. 5.45% 19-MAR-2030Yield to maturity
7.39%
Maturity date
Mar 19, 2030
TSLA4265473
Tesla Energy Operations, Inc. 5.45% 16-JUL-2030Yield to maturity
7.00%
Maturity date
Jul 16, 2030
See all TSLA bonds
Curated watchlists where TSLA is featured.


Frequently Asked Questions
The current price of TSLA is 5,726.24 MXN — it has decreased by −0.47% in the past 24 hours. Watch TESLA INC stock price performance more closely on the chart.
Depending on the exchange, the stock ticker may vary. For instance, on BMV exchange TESLA INC stocks are traded under the ticker TSLA.
TSLA stock has risen by 2.31% compared to the previous week, the month change is a −0.18% fall, over the last year TESLA INC has showed a 35.10% increase.
We've gathered analysts' opinions on TESLA INC future price: according to them, TSLA price has a max estimate of 9,444.65 MXN and a min estimate of 2,172.27 MXN. Watch TSLA chart and read a more detailed TESLA INC stock forecast: see what analysts think of TESLA INC and suggest that you do with its stocks.
TSLA reached its all-time high on Dec 18, 2024 with the price of 9,850.00 MXN, and its all-time low was 153.73 MXN and was reached on May 8, 2014. View more price dynamics on TSLA chart.
See other stocks reaching their highest and lowest prices.
See other stocks reaching their highest and lowest prices.
TSLA stock is 3.38% volatile and has beta coefficient of 1.70. Track TESLA INC stock price on the chart and check out the list of the most volatile stocks — is TESLA INC there?
Today TESLA INC has the market capitalization of 18.78 T, it has increased by 4.21% over the last week.
Yes, you can track TESLA INC financials in yearly and quarterly reports right on TradingView.
TESLA INC is going to release the next earnings report on Oct 15, 2025. Keep track of upcoming events with our Earnings Calendar.
TSLA earnings for the last quarter are 7.50 MXN per share, whereas the estimation was 7.45 MXN resulting in a 0.70% surprise. The estimated earnings for the next quarter are 9.17 MXN per share. See more details about TESLA INC earnings.
TESLA INC revenue for the last quarter amounts to 421.98 B MXN, despite the estimated figure of 417.93 B MXN. In the next quarter, revenue is expected to reach 464.24 B MXN.
TSLA net income for the last quarter is 21.98 B MXN, while the quarter before that showed 8.38 B MXN of net income which accounts for 162.37% change. Track more TESLA INC financial stats to get the full picture.
No, TSLA doesn't pay any dividends to its shareholders. But don't worry, we've prepared a list of high-dividend stocks for you.
As of Aug 1, 2025, the company has 125.67 K employees. See our rating of the largest employees — is TESLA INC on this list?
EBITDA measures a company's operating performance, its growth signifies an improvement in the efficiency of a company. TESLA INC EBITDA is 215.76 B MXN, and current EBITDA margin is 13.44%. See more stats in TESLA INC financial statements.
Like other stocks, TSLA shares are traded on stock exchanges, e.g. Nasdaq, Nyse, Euronext, and the easiest way to buy them is through an online stock broker. To do this, you need to open an account and follow a broker's procedures, then start trading. You can trade TESLA INC stock right from TradingView charts — choose your broker and connect to your account.
Investing in stocks requires a comprehensive research: you should carefully study all the available data, e.g. company's financials, related news, and its technical analysis. So TESLA INC technincal analysis shows the strong sell today, and its 1 week rating is sell. Since market conditions are prone to changes, it's worth looking a bit further into the future — according to the 1 month rating TESLA INC stock shows the buy signal. See more of TESLA INC technicals for a more comprehensive analysis.
If you're still not sure, try looking for inspiration in our curated watchlists.
If you're still not sure, try looking for inspiration in our curated watchlists.