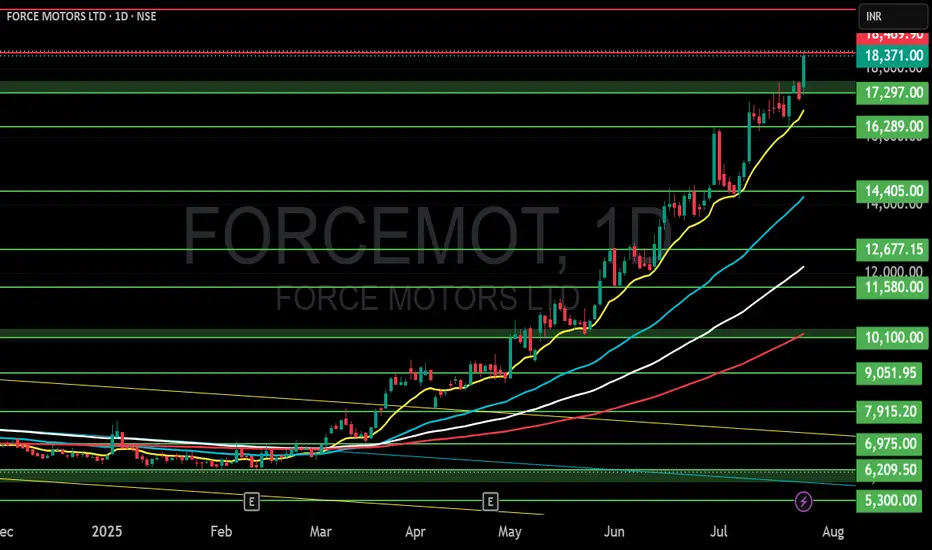
FORCE MOTORS LTD S/RSupport and Resistance Levels:
Support Levels: These are price points (green line/shade) where a downward trend may be halted due to a concentration of buying interest. Imagine them as a safety net where buyers step in, preventing further decline.
Resistance Levels: Conversely, resistance levels (re
653.75 INR
8.01 B INR
80.72 B INR
1.82 M
About FORCE MOTORS LTD
Sector
Industry
CEO
Prasan Abhaykumar Firodia
Website
Headquarters
Pune
Founded
1958
ISIN
INE451A01017
FIGI
BBG000CNXRL6
Force Motors Ltd. is a holding company, which engages in the design, development, and manufacture of automotive components, aggregates, and vehicles. Its products include light commercial vehicles, small commercial vehicles, utility vehicles, agricultural tractors, and diesel engines. The company was founded on 8th September,1958, and is headquartered in Pune, India.
Related stocks
Long above 13960Nonstop move after the breakout of 10,350, stock is moving in a upward channel respecting upper and lower bend as resistance and support, out of 3 past sessions, stock formed 2 weak candles, today's low at 13,620 can act as immediate support (Not marked), below that stock may find next support at 13

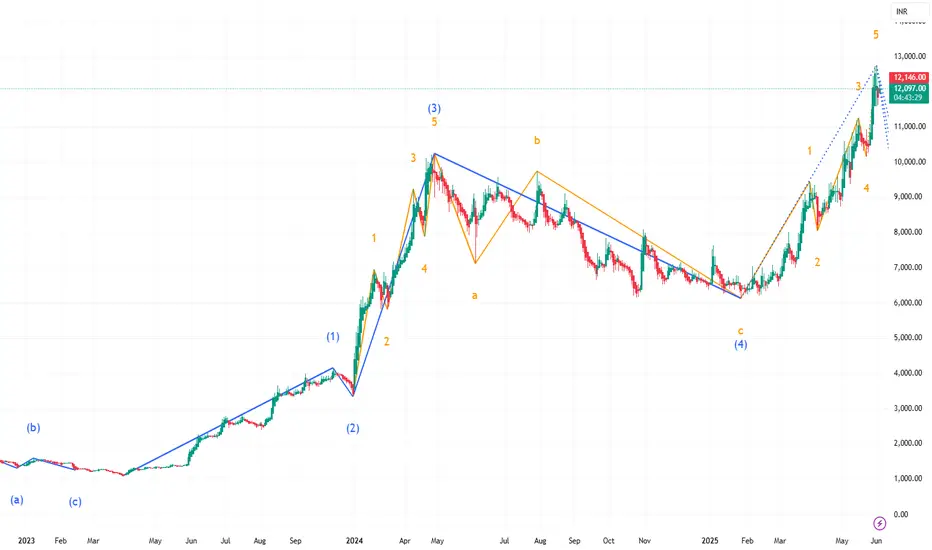
Force motors - deep in wave 5. book profitsForce motors looks like deep into wave 5
Book profits. Once it turns a medium term top should be in
Force motors a strong stockThis is what a strong stock looks like in volatile market. Quick bounce to new high ground after a short pullback.
Due to market pressure stock briefly crossed all time highs but came back in the same day of breakout.
But now as the geopolitical situation improved stock quickly bounced back to all t

Force motors all time high breakoutThis is weekly chart of force motors. The stock is heading towards all time high of 10277.85 with very high relative volume last week. This may increase the probability of breakout of all time high. Time will tell. Must add for a watchlist.

Force Motors Ltd - Long Trade Setup (NSE)📈 Technical Setup (Daily Chart)
Current Price: ₹10,062.50 (+12.88%)
Key Levels:
Support: ₹8,900 (Recent Swing Low)
Resistance: ₹10,200 (Immediate) → ₹11,500 (Next)
All-Time High: ₹13,000 (Long-term Target)
Indicators:
Supertrend (10,3): Bullish (Green) - Confirms uptrend
TEMA (5,9,20): Rising

FORCEMOT | Buy @8100 | SL below 7000Disclaimer:
This is not financial advice. Please do your own research or consult with a financial advisor before making any investment decisions. Investments in stocks can be risky and may result in loss of capital.

Anticipated Price MovementExpect the price to pick up from the current demand zone @ 7,277 and reach for breaking the first supply zone @ 8,123. Following this, the price could face a little hurdle at the second supply zone @ 8,892 where the price will be pushed down. Breaking past this supply zone @ 9,127. The price is to m

FORCE MOTORS LTD S/R Support and Resistance Levels:
Support Levels: These are price points (green line/shade) where a downward trend may be halted due to a concentration of buying interest. Imagine them as a safety net where buyers step in, preventing further decline.
Resistance Levels: Conversely, resistance levels (re

FORCE MOTORS Trend Line BreakoutFORCE MOTORS Trend Line Breakout BUY Target 10277 (40% Upside), SL 8% R:R 1:5

See all ideas
Summarizing what the indicators are suggesting.
Oscillators
Neutral
SellBuy
Strong sellStrong buy
Strong sellSellNeutralBuyStrong buy
Oscillators
Neutral
SellBuy
Strong sellStrong buy
Strong sellSellNeutralBuyStrong buy
Summary
Neutral
SellBuy
Strong sellStrong buy
Strong sellSellNeutralBuyStrong buy
Summary
Neutral
SellBuy
Strong sellStrong buy
Strong sellSellNeutralBuyStrong buy
Summary
Neutral
SellBuy
Strong sellStrong buy
Strong sellSellNeutralBuyStrong buy
Moving Averages
Neutral
SellBuy
Strong sellStrong buy
Strong sellSellNeutralBuyStrong buy
Moving Averages
Neutral
SellBuy
Strong sellStrong buy
Strong sellSellNeutralBuyStrong buy
Displays a symbol's price movements over previous years to identify recurring trends.
Frequently Asked Questions
The current price of FORCEMOT is 17,025.25 INR — it has decreased by −1.38% in the past 24 hours. Watch FORCE MOTORS LTD. stock price performance more closely on the chart.
Depending on the exchange, the stock ticker may vary. For instance, on BSE exchange FORCE MOTORS LTD. stocks are traded under the ticker FORCEMOT.
FORCEMOT stock has fallen by −13.81% compared to the previous week, the month change is a 12.40% rise, over the last year FORCE MOTORS LTD. has showed a 89.15% increase.
We've gathered analysts' opinions on FORCE MOTORS LTD. future price: according to them, FORCEMOT price has a max estimate of 11,525.00 INR and a min estimate of 11,525.00 INR. Watch FORCEMOT chart and read a more detailed FORCE MOTORS LTD. stock forecast: see what analysts think of FORCE MOTORS LTD. and suggest that you do with its stocks.
FORCEMOT reached its all-time high on Jul 24, 2025 with the price of 20,563.00 INR, and its all-time low was 54.50 INR and was reached on Mar 6, 2009. View more price dynamics on FORCEMOT chart.
See other stocks reaching their highest and lowest prices.
See other stocks reaching their highest and lowest prices.
FORCEMOT stock is 3.92% volatile and has beta coefficient of 1.43. Track FORCE MOTORS LTD. stock price on the chart and check out the list of the most volatile stocks — is FORCE MOTORS LTD. there?
Today FORCE MOTORS LTD. has the market capitalization of 220.19 B, it has increased by 1.38% over the last week.
Yes, you can track FORCE MOTORS LTD. financials in yearly and quarterly reports right on TradingView.
FORCEMOT net income for the last quarter is 1.76 B INR, while the quarter before that showed 4.35 B INR of net income which accounts for −59.44% change. Track more FORCE MOTORS LTD. financial stats to get the full picture.
Yes, FORCEMOT dividends are paid annually. The last dividend per share was 20.00 INR. As of today, Dividend Yield (TTM)% is 0.12%. Tracking FORCE MOTORS LTD. dividends might help you take more informed decisions.
EBITDA measures a company's operating performance, its growth signifies an improvement in the efficiency of a company. FORCE MOTORS LTD. EBITDA is 11.76 B INR, and current EBITDA margin is 13.54%. See more stats in FORCE MOTORS LTD. financial statements.
Like other stocks, FORCEMOT shares are traded on stock exchanges, e.g. Nasdaq, Nyse, Euronext, and the easiest way to buy them is through an online stock broker. To do this, you need to open an account and follow a broker's procedures, then start trading. You can trade FORCE MOTORS LTD. stock right from TradingView charts — choose your broker and connect to your account.
Investing in stocks requires a comprehensive research: you should carefully study all the available data, e.g. company's financials, related news, and its technical analysis. So FORCE MOTORS LTD. technincal analysis shows the buy rating today, and its 1 week rating is buy. Since market conditions are prone to changes, it's worth looking a bit further into the future — according to the 1 month rating FORCE MOTORS LTD. stock shows the buy signal. See more of FORCE MOTORS LTD. technicals for a more comprehensive analysis.
If you're still not sure, try looking for inspiration in our curated watchlists.
If you're still not sure, try looking for inspiration in our curated watchlists.