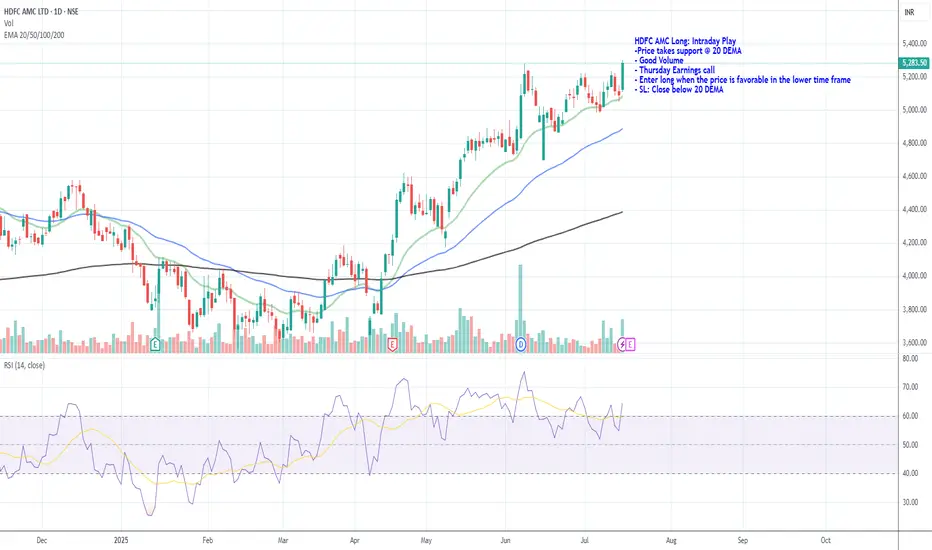
HDFC AMC Long: Intraday PlayHDFC AMC Long: Intraday Play
-Price takes support @ 20 DEMA
- Good Volume
- Thursday Earnings call
- Enter long when the price is favorable in the lower time frame
- SL: Close below 20 DEMA
Next report date
—
Report period
—
EPS estimate
—
Revenue estimate
—
121.85 INR
24.60 B INR
40.60 B INR
98.26 M
About HDFC AMC LTD
Sector
Industry
CEO
Navneet Munot
Website
Headquarters
Mumbai
Founded
1999
ISIN
INE127D01025
FIGI
BBG00JDHF4J1
HDFC Asset Management Co. Ltd. engages in the provision of asset management services. It also offers portfolio management and advisory services to clients. The company was founded on December 10, 1999 and is headquartered in Mumbai, India.
Related stocks
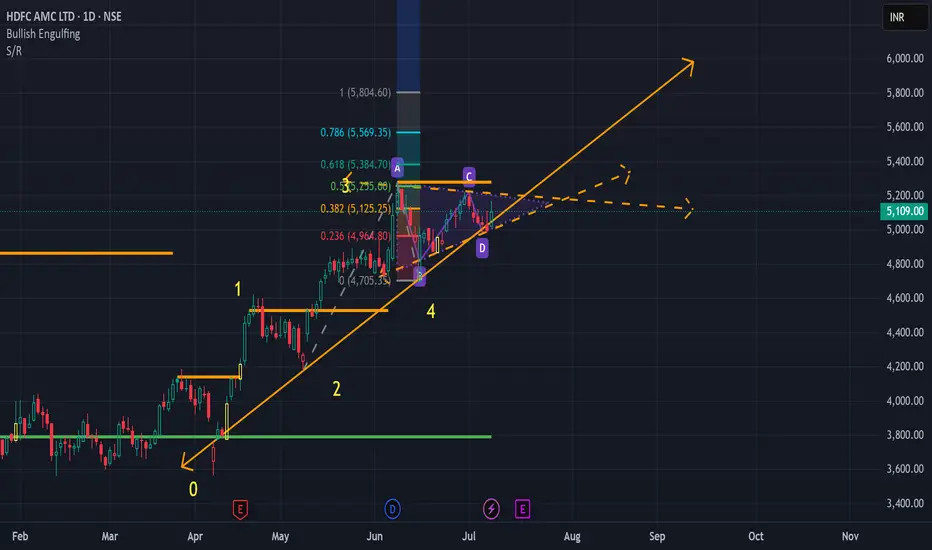
HDFCAMC in Pennant Trend PatternNSE:HDFCAMC shows a breakout of a Pennant Trend Pattern. Please Buy once there is a Bullish breakout. Target would be 5750
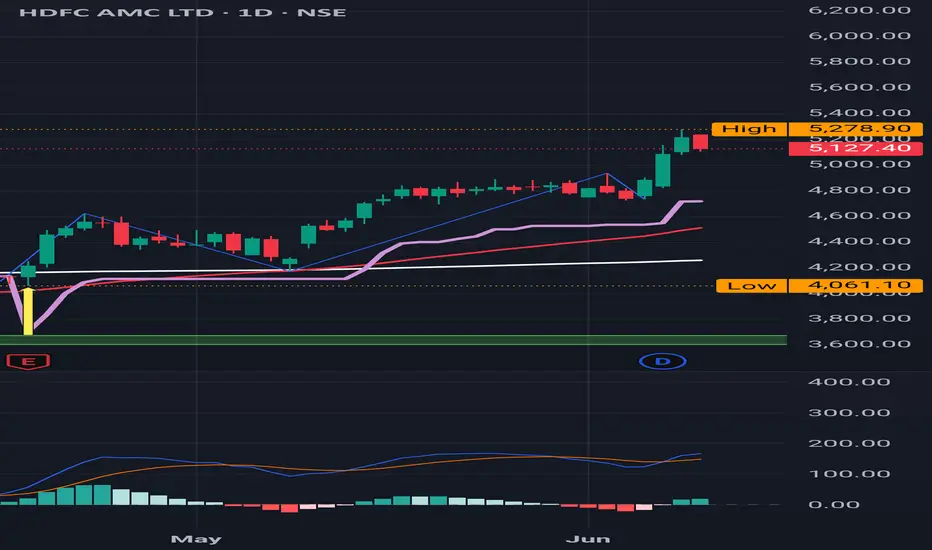
HDFC AMC Long_ Support @ 20 DEMAHDFC AMC Long:
-Price takes support @ 20 DEMA
- Good Volume
- Enter long when the price is favorable in the lower time frame
- SL: Close below 20 DEMA

HDFC Asset Management Buy27-Jun-2025 (Friday)
HDFC Asset Management bounced back from trend line. Also it tested previous ATH as support and reversed upwards. Buy @CMP (5150) with SL of 4860 and target of 5250, 5550-5600 & 6900

HDFC AMC : A fantastic run after a Buy signal
HDFC AMC : A fantastic run after a Buy signal.
Today it's showing a some sign of consolidation or profit booking .
It announced a hefty dividend on Friday June 6th of Rs 90.
( Not a Buy / Sell Recommendation
Do your own due diligence ,Market is subject to risks, This is my own view and for l
HDFC AMC – Bullish Flag Formation on Daily ChartHDFC AMC is currently exhibiting a bullish flag formation, a classic continuation pattern following a strong vertical rally. The recent price action is consolidating within a downward-sloping channel, typically seen as a pause before the next leg up.
Key Technical Levels:
Flag upper boundary (firs

Low Volume Node may act as resistancethe Volume Profile is a charting technique (indicator) that shows the trading activity of a specific financial asset over time. This indicator uses horizontal bars to reflect trading activity at different price points. The bars are stacked vertically, with the highest indicating the areas with the m

Review and plan for 17th January 2025 Nifty future and banknifty future analysis and intraday plan.
Quarterly results.
This video is for information/education purpose only. you are 100% responsible for any actions you take by reading/viewing this post.
please consult your financial advisor before taking any action.
----Vinaykumar

HDFCAMC -INTRADAYHDFCAMC -INTRADAY
As per the candle Physiology next candle or after 2-3 candle it will go down to fill the gap

HDFCAMC Bullish and trending in 15 min, go long after price 4747HDFCAMC did breakout last week and trading in bullish area,
It is also looking trending in 15 Min. timeframe and trading at good level for intraday.
We can go long after price of 4747.
Note : Its just an analysis, wait for the price to confirm.
Disclaimer : Always follow risk to reward, this

See all ideas
Summarizing what the indicators are suggesting.
Neutral
SellBuy
Strong sellStrong buy
Strong sellSellNeutralBuyStrong buy
Neutral
SellBuy
Strong sellStrong buy
Strong sellSellNeutralBuyStrong buy
Neutral
SellBuy
Strong sellStrong buy
Strong sellSellNeutralBuyStrong buy
An aggregate view of professional's ratings.
Neutral
SellBuy
Strong sellStrong buy
Strong sellSellNeutralBuyStrong buy
Neutral
SellBuy
Strong sellStrong buy
Strong sellSellNeutralBuyStrong buy
Neutral
SellBuy
Strong sellStrong buy
Strong sellSellNeutralBuyStrong buy
Displays a symbol's price movements over previous years to identify recurring trends.
Frequently Asked Questions
The current price of HDFCAMC is 5,675.25 INR — it has decreased by −0.26% in the past 24 hours. Watch HDFC ASSET MANAGEMENT COMPANY stock price performance more closely on the chart.
Depending on the exchange, the stock ticker may vary. For instance, on BSE exchange HDFC ASSET MANAGEMENT COMPANY stocks are traded under the ticker HDFCAMC.
HDFCAMC stock has risen by 2.08% compared to the previous week, the month change is a 11.96% rise, over the last year HDFC ASSET MANAGEMENT COMPANY has showed a 40.43% increase.
We've gathered analysts' opinions on HDFC ASSET MANAGEMENT COMPANY future price: according to them, HDFCAMC price has a max estimate of 6,680.00 INR and a min estimate of 4,466.00 INR. Watch HDFCAMC chart and read a more detailed HDFC ASSET MANAGEMENT COMPANY stock forecast: see what analysts think of HDFC ASSET MANAGEMENT COMPANY and suggest that you do with its stocks.
HDFCAMC reached its all-time high on Jul 30, 2025 with the price of 5,694.70 INR, and its all-time low was 1,248.30 INR and was reached on Sep 21, 2018. View more price dynamics on HDFCAMC chart.
See other stocks reaching their highest and lowest prices.
See other stocks reaching their highest and lowest prices.
HDFCAMC stock is 1.44% volatile and has beta coefficient of 1.34. Track HDFC ASSET MANAGEMENT COMPANY stock price on the chart and check out the list of the most volatile stocks — is HDFC ASSET MANAGEMENT COMPANY there?
Today HDFC ASSET MANAGEMENT COMPANY has the market capitalization of 1.22 T, it has increased by 2.88% over the last week.
Yes, you can track HDFC ASSET MANAGEMENT COMPANY financials in yearly and quarterly reports right on TradingView.
HDFC ASSET MANAGEMENT COMPANY is going to release the next earnings report on Oct 23, 2025. Keep track of upcoming events with our Earnings Calendar.
HDFCAMC earnings for the last quarter are 34.90 INR per share, whereas the estimation was 32.05 INR resulting in a 8.88% surprise. The estimated earnings for the next quarter are 27.03 INR per share. See more details about HDFC ASSET MANAGEMENT COMPANY earnings.
HDFC ASSET MANAGEMENT COMPANY revenue for the last quarter amounts to 9.68 B INR, despite the estimated figure of 9.61 B INR. In the next quarter, revenue is expected to reach 9.95 B INR.
HDFCAMC net income for the last quarter is 7.48 B INR, while the quarter before that showed 6.38 B INR of net income which accounts for 17.09% change. Track more HDFC ASSET MANAGEMENT COMPANY financial stats to get the full picture.
Yes, HDFCAMC dividends are paid annually. The last dividend per share was 90.00 INR. As of today, Dividend Yield (TTM)% is 1.58%. Tracking HDFC ASSET MANAGEMENT COMPANY dividends might help you take more informed decisions.
HDFC ASSET MANAGEMENT COMPANY dividend yield was 2.24% in 2024, and payout ratio reached 78.15%. The year before the numbers were 1.87% and 76.92% correspondingly. See high-dividend stocks and find more opportunities for your portfolio.
As of Aug 5, 2025, the company has 2.21 K employees. See our rating of the largest employees — is HDFC ASSET MANAGEMENT COMPANY on this list?
EBITDA measures a company's operating performance, its growth signifies an improvement in the efficiency of a company. HDFC ASSET MANAGEMENT COMPANY EBITDA is 35.82 B INR, and current EBITDA margin is 83.45%. See more stats in HDFC ASSET MANAGEMENT COMPANY financial statements.
Like other stocks, HDFCAMC shares are traded on stock exchanges, e.g. Nasdaq, Nyse, Euronext, and the easiest way to buy them is through an online stock broker. To do this, you need to open an account and follow a broker's procedures, then start trading. You can trade HDFC ASSET MANAGEMENT COMPANY stock right from TradingView charts — choose your broker and connect to your account.
Investing in stocks requires a comprehensive research: you should carefully study all the available data, e.g. company's financials, related news, and its technical analysis. So HDFC ASSET MANAGEMENT COMPANY technincal analysis shows the buy rating today, and its 1 week rating is buy. Since market conditions are prone to changes, it's worth looking a bit further into the future — according to the 1 month rating HDFC ASSET MANAGEMENT COMPANY stock shows the buy signal. See more of HDFC ASSET MANAGEMENT COMPANY technicals for a more comprehensive analysis.
If you're still not sure, try looking for inspiration in our curated watchlists.
If you're still not sure, try looking for inspiration in our curated watchlists.