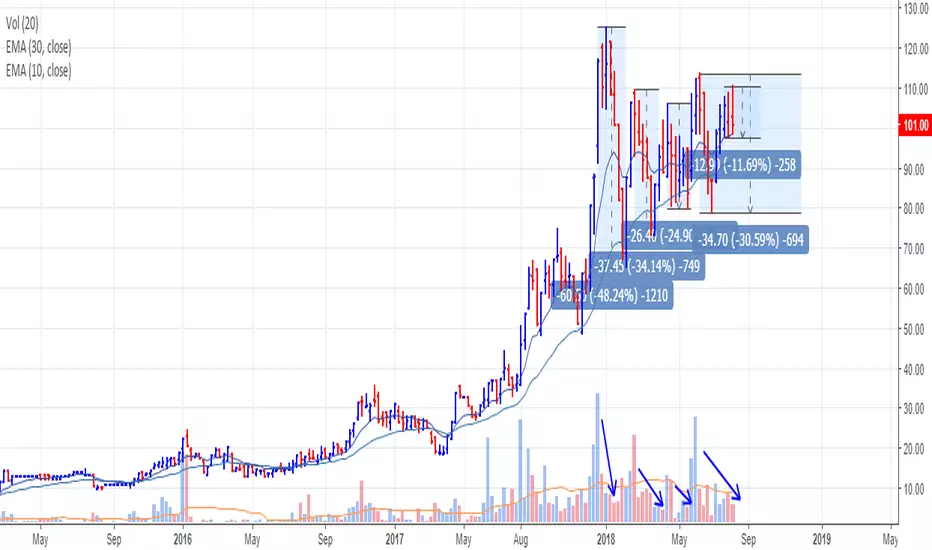
Pull back series PT-1:Permagan*After reaching ATH it gets pull back to its prev.resistance lvl and also volumes are enough to support this pull back which indicates buying is seen from this level.
This strategy have 65-70% of success rate
Follow the FIVE rules below.
1)Book whole profit at TP if you want to free up capital
2)St
18.30 INR
157.50 M INR
2.05 B INR
3.35 M
About PERMANENT MAGNETS LTD.
Sector
Industry
CEO
Sharad Jaiprakash Taparia
Website
Headquarters
Thane
Founded
1960
ISIN
INE418E01018
FIGI
BBG000CXQZ07
Permanent Magnets Ltd. engages in the manufacture of alnico cast magnets, yoke assemblies and parts and accessories of electricity meters. It operates through the following divisions: Magnetic Assemblies, Shunts, Shunt Assemblies and Brass Terminals, Magnetic Cores and Shields, and Magnets and Assemblies for Meters. The company was founded on November 26, 1960 and is headquartered in Thane, India.
Related stocks

PERMAGNBSE:PERMAGN
One Can Enter Now ! Or Wait for Retest of the Trendline (BO).
Note :
1.One Can Go long with a Strict SL below the Trendline or Swing Low of Daily Candle.
2. Close, should be good and Clean.
3. R:R ratio should be 1 :2 minimum
4. Plan as per your RISK appetite
Disclaimer : You are r

Permanent Magnets Ltd - Resistance + Trendline Breakout📊 Script: PERMAGN (PERMANENT MAGNETS LTD.)
📊 Sector: Electrical Equipment
📊 Industry: Engineering
Weekly Time-frame
Key highlights: 💡⚡
📈 Script is trading at upper band of Bollinger Bands (BB) and giving breakout of it.
📈 Already Crossover in MACD .
📈 Already Crossover in Double Moving Ave

Go Long Here:-Stock is in uptrend supported by high volume. The 20 Days moving average ( Volume ) is also increasing. Still you can buy it.


PERMAGN - VCP Pattern in progress - Buy Watchlist#MK
#PERMAGN
#BSE listed stock
Permanent Magnets Limited
CMP 101
Buy ONLY above 115.
Stop 99
Target Open (Trail 10 weeks MA)
#VCP
33W 48/11 5T in progress.
Fundamentals
Positives:
YoY quarterly profit has shown a significant uptrend in the last 4 quarters.
Margins have also been steadily increa
Permanent Magnets LtdBlasted from Accumulation phase
strong buy in range of 95/100
target 300/400
sl below 65
trade not more than (2 to 5 ) % of your investment as risk reward is higher.

See all ideas
Summarizing what the indicators are suggesting.
Oscillators
Neutral
SellBuy
Strong sellStrong buy
Strong sellSellNeutralBuyStrong buy
Oscillators
Neutral
SellBuy
Strong sellStrong buy
Strong sellSellNeutralBuyStrong buy
Summary
Neutral
SellBuy
Strong sellStrong buy
Strong sellSellNeutralBuyStrong buy
Summary
Neutral
SellBuy
Strong sellStrong buy
Strong sellSellNeutralBuyStrong buy
Summary
Neutral
SellBuy
Strong sellStrong buy
Strong sellSellNeutralBuyStrong buy
Moving Averages
Neutral
SellBuy
Strong sellStrong buy
Strong sellSellNeutralBuyStrong buy
Moving Averages
Neutral
SellBuy
Strong sellStrong buy
Strong sellSellNeutralBuyStrong buy
Displays a symbol's price movements over previous years to identify recurring trends.
Frequently Asked Questions
The current price of PERMAGN is 896.00 INR — it has decreased by −0.25% in the past 24 hours. Watch PERMANENT MAGNETS LTD. stock price performance more closely on the chart.
Depending on the exchange, the stock ticker may vary. For instance, on BSE exchange PERMANENT MAGNETS LTD. stocks are traded under the ticker PERMAGN.
PERMAGN stock has fallen by −2.85% compared to the previous week, the month change is a 2.42% rise, over the last year PERMANENT MAGNETS LTD. has showed a −16.74% decrease.
PERMAGN reached its all-time high on Aug 24, 2023 with the price of 1,721.00 INR, and its all-time low was 3.10 INR and was reached on Nov 10, 2003. View more price dynamics on PERMAGN chart.
See other stocks reaching their highest and lowest prices.
See other stocks reaching their highest and lowest prices.
PERMAGN stock is 3.35% volatile and has beta coefficient of 1.15. Track PERMANENT MAGNETS LTD. stock price on the chart and check out the list of the most volatile stocks — is PERMANENT MAGNETS LTD. there?
Today PERMANENT MAGNETS LTD. has the market capitalization of 7.68 B, it has increased by 0.32% over the last week.
Yes, you can track PERMANENT MAGNETS LTD. financials in yearly and quarterly reports right on TradingView.
PERMAGN net income for the last quarter is 15.80 M INR, while the quarter before that showed 20.40 M INR of net income which accounts for −22.55% change. Track more PERMANENT MAGNETS LTD. financial stats to get the full picture.
Yes, PERMAGN dividends are paid annually. The last dividend per share was 1.80 INR. As of today, Dividend Yield (TTM)% is 0.20%. Tracking PERMANENT MAGNETS LTD. dividends might help you take more informed decisions.
EBITDA measures a company's operating performance, its growth signifies an improvement in the efficiency of a company. PERMANENT MAGNETS LTD. EBITDA is 304.30 M INR, and current EBITDA margin is 14.85%. See more stats in PERMANENT MAGNETS LTD. financial statements.
Like other stocks, PERMAGN shares are traded on stock exchanges, e.g. Nasdaq, Nyse, Euronext, and the easiest way to buy them is through an online stock broker. To do this, you need to open an account and follow a broker's procedures, then start trading. You can trade PERMANENT MAGNETS LTD. stock right from TradingView charts — choose your broker and connect to your account.
Investing in stocks requires a comprehensive research: you should carefully study all the available data, e.g. company's financials, related news, and its technical analysis. So PERMANENT MAGNETS LTD. technincal analysis shows the buy rating today, and its 1 week rating is buy. Since market conditions are prone to changes, it's worth looking a bit further into the future — according to the 1 month rating PERMANENT MAGNETS LTD. stock shows the neutral signal. See more of PERMANENT MAGNETS LTD. technicals for a more comprehensive analysis.
If you're still not sure, try looking for inspiration in our curated watchlists.
If you're still not sure, try looking for inspiration in our curated watchlists.