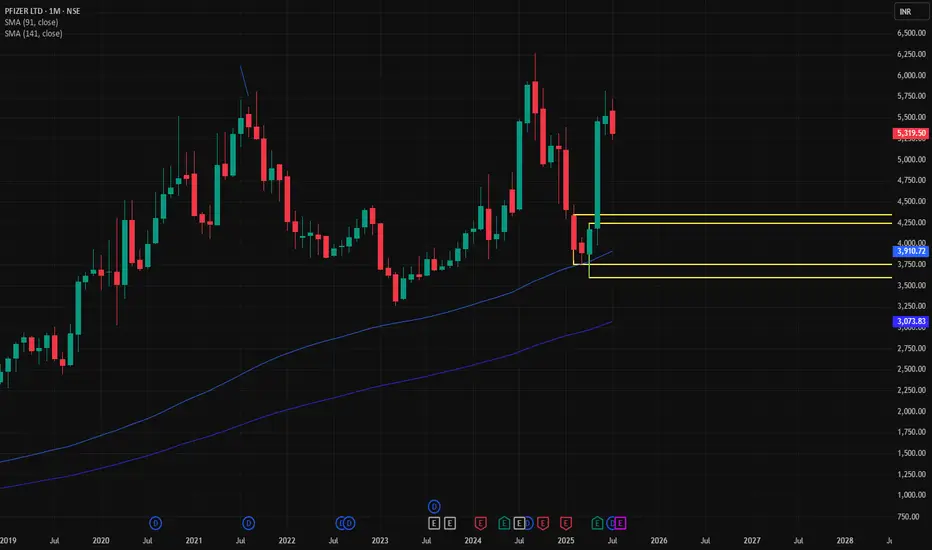
PFIZER🛒 Trade Plan: BUY
Parameter Value
Entry 4344
Stop Loss (SL) 3596
Risk 748 pts
Reward 4598 pts
Target 8942
Risk-Reward (RR) 6.1
🧠 Market Context
Metric Value
Last High 6269
Last Low 3596
Point Var 2673
✅ Technical Strengths
Strong confluence zone around 358–371 with multiple MTF & ITF demand overla
Next report date
—
Report period
—
EPS estimate
—
Revenue estimate
—
167.80 INR
7.68 B INR
22.81 B INR
15.12 M
About PFIZER LTD
Sector
Industry
CEO
Meenakshi Nevatia
Website
Headquarters
Mumbai
Founded
1950
ISIN
INE182A01018
FIGI
BBG000CXR218
Pfizer Ltd. engages in the business of manufacturing, marketing, trading, import and export of pharmaceutical products. Its product offerings include treatment for depression, erectile dysfunction, high cholesterol, human immunodeficiency virus infection, hypertension, bacterial infections and systemic fungal infections, and other chronic therapeutic which includes pain, respiratory, vitamins or minerals, hospital anti-infectives, neurosciences, and cardiovascular. The firm's products include Prevenar 13, Ativan, Zosyn, Minipress XL, Meronem, Enbrel, Dolonex, Magnex, Trulimax, Neksium, Becosules, Gelusil, Mucaine, Folvite, Autrin, Citralka, and Corex Range. It operates through the India and Outside of India geographical segments. The company was founded on November 21, 1950 and is headquartered in Mumbai, India.
Related stocks
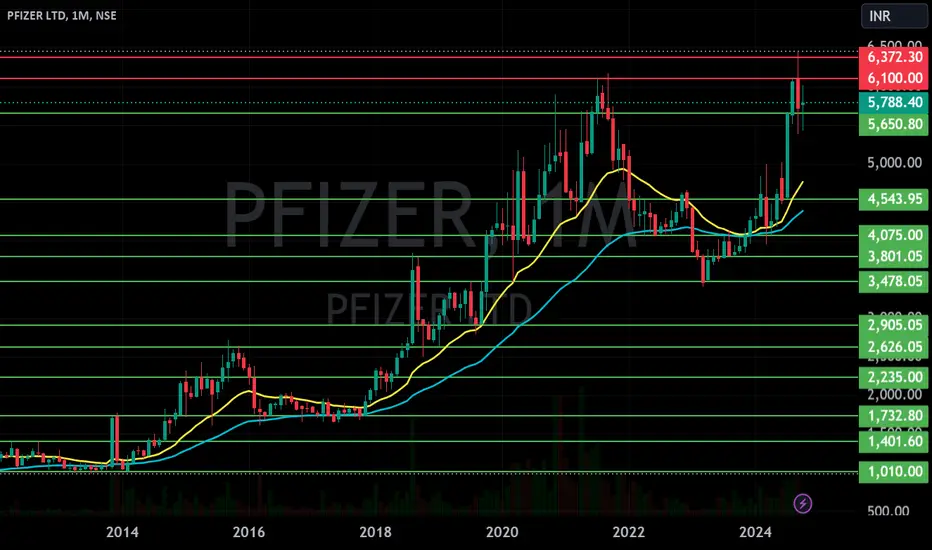
PFIZER | 2x returns | Breakout of 3 year resistance| PFIZER |
Monthly time frame
Stock has been moving along the upward blue dotted parallel channel since listing in 1994
Stock has bounced from a recent “higher low” made in Mar 2023
Stock riding above 20-, 50- & 200-month moving averages
RSI > 70, indicating solid bullish momentum
MACD crossover ex

Pfizer It is trading near 200 ( ema + dma) and horizontal support in a weekly timeframe so, we can expect a reversal towards upwards.

Review and plan for 10th December 2024 Nifty future and banknifty future analysis and intraday plan.
Interesting stock charts.
This video is for information/education purpose only. you are 100% responsible for any actions you take by reading/viewing this post.
please consult your financial advisor before taking any action.
----Vin

Pfizer Ltd. - Short Position AnalysisChart Overview:
The chart indicates that the stock is in a clear downtrend, following a descending channel pattern. The price is nearing a key horizontal support level (marked in black), and a breakdown below this level may present a shorting opportunity.
Trade Setup for Short Position:
1.Entry

PFIZER LTD S/R Support and Resistance Levels:
Support Levels: These are price points (green line/shade) where a downward trend may be halted due to a concentration of buying interest. Imagine them as a safety net where buyers step in, preventing further decline.
Resistance Levels: Conversely, resistance levels (re
SWING IDEA - PFIZERPrice Action and MACD have shown Convergence Divergence.
Also a new Higher High and Higher Low Pattern seems to be in play currently.
Another new MACD Crossover as well is happening now.
Could this cross take the Stock to a Swing High again?
While Weekly charts look good, even the MACD Cross on Mon

Pfizer (PFE) – Post-Covid Growth Prospects Post-Covid Growth Prospects
Supporting Arguments
• Pipeline and portfolio advancement ensures better long-term growth prospects for Pfizer’s pharmaceutical business
• Favorable fundamental and technical analysis
Investment Thesis
Pfizer is an American multinational pharmaceutical and biote

Bullish Continuation Setup in Pfizer LtdThis daily chart of Pfizer Ltd. shows a bullish continuation pattern with Fibonacci extension levels highlighting potential upside targets. The Fibonacci retracement is drawn from the recent swing low at ₹5,754.70 to the swing high at ₹6,338.25, with the price currently above the key retracement zon

PFIZERGud support from 20 & 200 MA on weekly time frame also above its recent resistance and volumes are significant on last two weekly candle it shows heavy buying from big fish
has gud potential for upside . Follow strict SL & Proper RISK REWARD RATIO. This is the only holy grail in the market..
SL

See all ideas
Summarizing what the indicators are suggesting.
Neutral
SellBuy
Strong sellStrong buy
Strong sellSellNeutralBuyStrong buy
Neutral
SellBuy
Strong sellStrong buy
Strong sellSellNeutralBuyStrong buy
Neutral
SellBuy
Strong sellStrong buy
Strong sellSellNeutralBuyStrong buy
An aggregate view of professional's ratings.
Neutral
SellBuy
Strong sellStrong buy
Strong sellSellNeutralBuyStrong buy
Neutral
SellBuy
Strong sellStrong buy
Strong sellSellNeutralBuyStrong buy
Neutral
SellBuy
Strong sellStrong buy
Strong sellSellNeutralBuyStrong buy
Displays a symbol's price movements over previous years to identify recurring trends.
Frequently Asked Questions
The current price of PFIZER is 5,354.75 INR — it has increased by 1.23% in the past 24 hours. Watch PFIZER LTD. stock price performance more closely on the chart.
Depending on the exchange, the stock ticker may vary. For instance, on BSE exchange PFIZER LTD. stocks are traded under the ticker PFIZER.
PFIZER stock has fallen by −0.57% compared to the previous week, the month change is a −4.65% fall, over the last year PFIZER LTD. has showed a 1.26% increase.
We've gathered analysts' opinions on PFIZER LTD. future price: according to them, PFIZER price has a max estimate of 6,900.00 INR and a min estimate of 5,220.00 INR. Watch PFIZER chart and read a more detailed PFIZER LTD. stock forecast: see what analysts think of PFIZER LTD. and suggest that you do with its stocks.
PFIZER reached its all-time high on Sep 2, 2024 with the price of 6,452.85 INR, and its all-time low was 362.00 INR and was reached on May 17, 2004. View more price dynamics on PFIZER chart.
See other stocks reaching their highest and lowest prices.
See other stocks reaching their highest and lowest prices.
PFIZER stock is 3.11% volatile and has beta coefficient of 0.48. Track PFIZER LTD. stock price on the chart and check out the list of the most volatile stocks — is PFIZER LTD. there?
Today PFIZER LTD. has the market capitalization of 244.97 B, it has decreased by −2.33% over the last week.
Yes, you can track PFIZER LTD. financials in yearly and quarterly reports right on TradingView.
PFIZER LTD. is going to release the next earnings report on Aug 4, 2025. Keep track of upcoming events with our Earnings Calendar.
PFIZER earnings for the last quarter are 42.00 INR per share, whereas the estimation was 35.85 INR resulting in a 17.15% surprise. The estimated earnings for the next quarter are 34.70 INR per share. See more details about PFIZER LTD. earnings.
PFIZER LTD. revenue for the last quarter amounts to 5.92 B INR, despite the estimated figure of 5.83 B INR. In the next quarter, revenue is expected to reach 5.93 B INR.
PFIZER net income for the last quarter is 3.31 B INR, while the quarter before that showed 1.28 B INR of net income which accounts for 159.36% change. Track more PFIZER LTD. financial stats to get the full picture.
PFIZER LTD. dividend yield was 0.87% in 2024, and payout ratio reached 20.86%. The year before the numbers were 0.83% and 29.04% correspondingly. See high-dividend stocks and find more opportunities for your portfolio.
As of Jul 27, 2025, the company has 1.77 K employees. See our rating of the largest employees — is PFIZER LTD. on this list?
EBITDA measures a company's operating performance, its growth signifies an improvement in the efficiency of a company. PFIZER LTD. EBITDA is 7.40 B INR, and current EBITDA margin is 33.21%. See more stats in PFIZER LTD. financial statements.
Like other stocks, PFIZER shares are traded on stock exchanges, e.g. Nasdaq, Nyse, Euronext, and the easiest way to buy them is through an online stock broker. To do this, you need to open an account and follow a broker's procedures, then start trading. You can trade PFIZER LTD. stock right from TradingView charts — choose your broker and connect to your account.
Investing in stocks requires a comprehensive research: you should carefully study all the available data, e.g. company's financials, related news, and its technical analysis. So PFIZER LTD. technincal analysis shows the neutral today, and its 1 week rating is buy. Since market conditions are prone to changes, it's worth looking a bit further into the future — according to the 1 month rating PFIZER LTD. stock shows the strong buy signal. See more of PFIZER LTD. technicals for a more comprehensive analysis.
If you're still not sure, try looking for inspiration in our curated watchlists.
If you're still not sure, try looking for inspiration in our curated watchlists.