Btc have big long chanceI want to get an optimistic scenario from Bitcoin, which can increase up to five times as far as the history of Hawings.
🇮🇷Long Live Iran🇮🇷
Key facts today
Key stats
About Bitcoin
Bitcoin is the world’s most traded cryptocurrency, and represents the largest piece of the crypto market pie. It was the first digital coin and as such, remains the most famous and widely-adopted cryptocurrency in the world. It's the original gangster in whose footsteps all other coins follow. The birth of Bitcoin was the genesis of an entirely new asset class, and a huge step away from traditional, centrally controlled money. Today, many advocates believe Bitcoin will facilitate the next stage for the global financial system, although this — of course — remains to be seen.
Related pairs
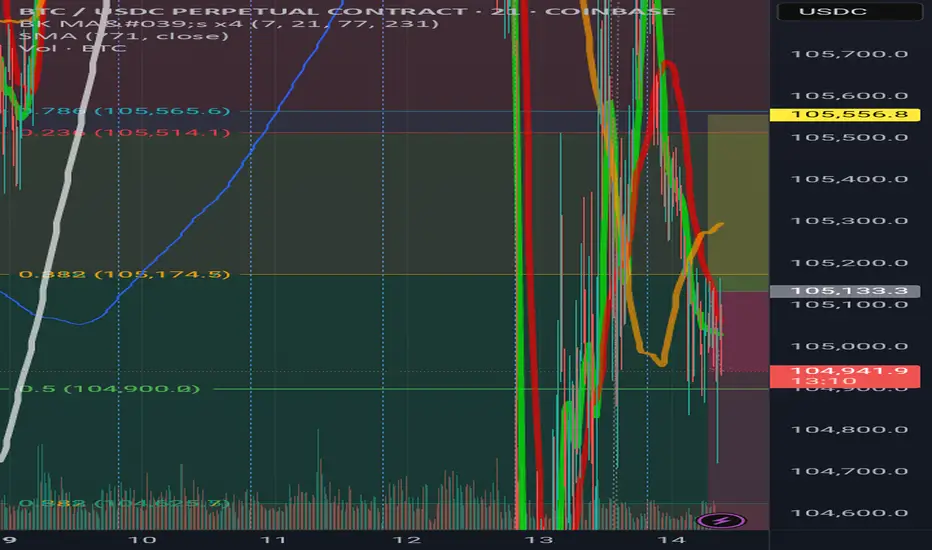
Bitcoin - Levels of the Range On the hourly time frame it is clear that BTC is within a rangebound environment. Using key levels such as the weekly highs and lows with Mondays highs and lows to to paint a picture of where support and resistance may be.
In the "weekly outlook" post for this week I suggested a retest of the $108,

Swing D1 Double TopHigherHigh > HigherLow structure is broken.
LowerHigh > LowerLow has formed, so the main trend is Short at present.
Trendline break until it occurs, until then the Long direction is lost.
MovingAverage retest may give strength to another Long trend...

Non Uclidean Fib BTC down after denial of Dual ZoneBTC keeps denying Zone the future of BTC spells a fall down a cliff
Bitcoin New ATH - Where now?After Bitcoin makes new all time highs, the next steps are very important. Where price goes now can be tricky to predict as there is the rare factor of price.
One of the only ways to predict where BTC may find resistance during price discovery is to use Fibonacci levels, using Fib extensions the fi

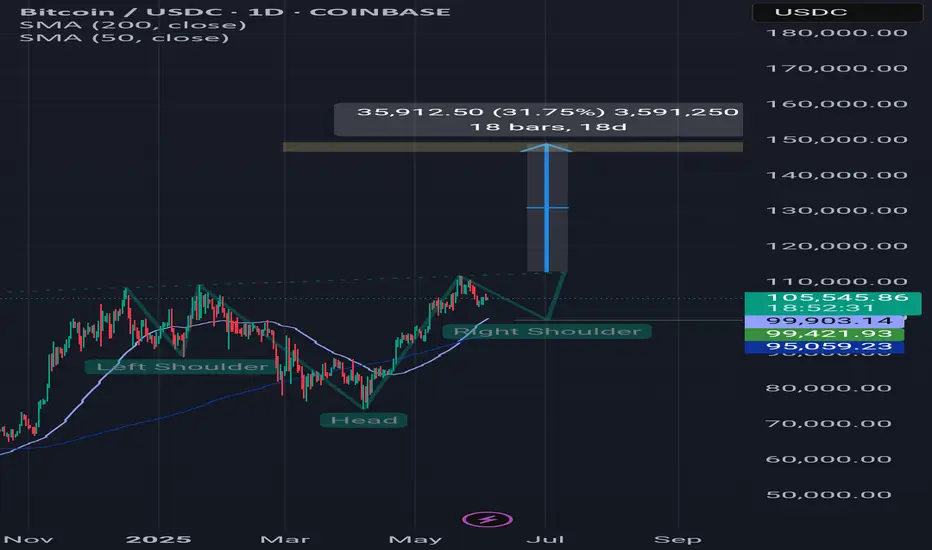
Btcusdt updateAnother scenario that can be imagined for Bitcoin is this. A head and shoulders pattern and a reversal from the $99,400 range and a rise to the $140,000 range, which could be the end of Bitcoin's celebration. In addition, we have a lot of news in these two weeks that may cause this 40% scenario to h
BTC will drop from here to around 100k **Bitcoin Analysis Update**
Bitcoin has printed a **bearish divergence**, suggesting a potential reversal from the current level. Based on the setup, a drop toward the **\$100,000–\$101,000** range is likely.
This presents a **low-risk, high-reward trade opportunity**, with a **risk-to-reward rati

BTC short to 101!
**"Bitcoin is likely to retrace to at least the 101 level before resuming its upward trend. This area represents the next significant demand zone. Additionally, the next Fibonacci support 0.382 fib lies around the 98 level. Despite this expected pullback, the overall market sentiment remains very b

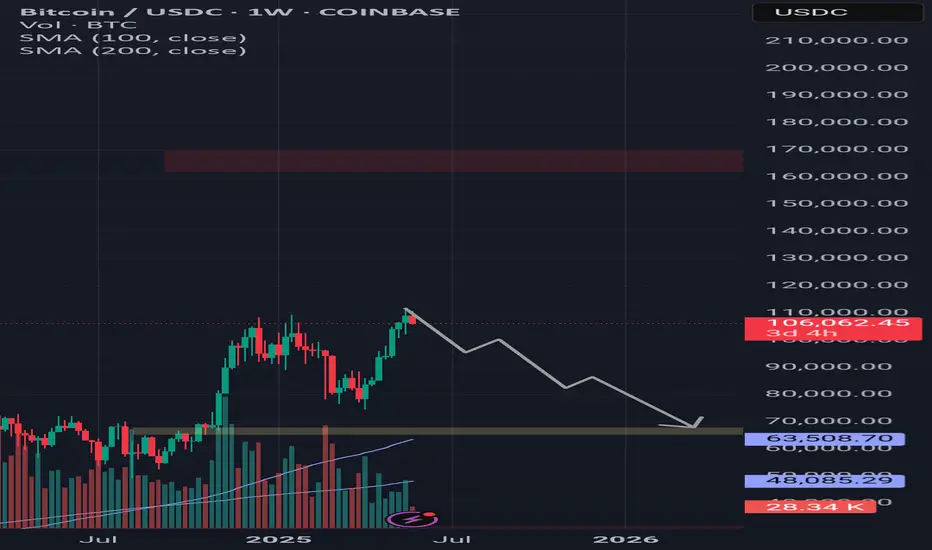
BtcusdtHello dears, I did a simple analysis of Bitcoin for you. If the next weekly candle is also bearish, it may happen with a probability of sixty percent. If you want to buy, buy at the specified price, which is about sixty-five thousand dollars. Good luck (⚠️A lot of data was reviewed for analysis, suc
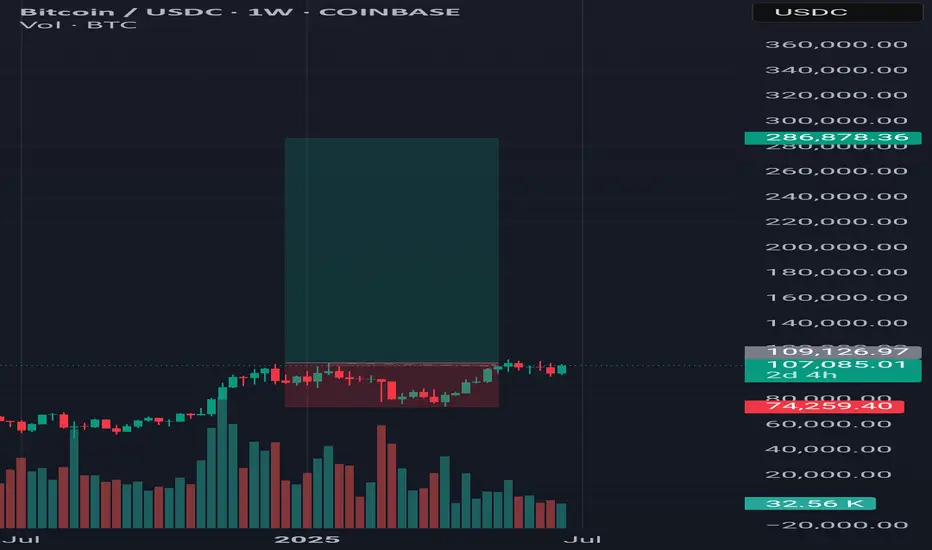
Bitcoin Levels in 2025Prediction levels on Bitcoin in 2025.
*first step - 143000 $ - 144000 $
* quick shot and back - 210000 $
* almost imposible in 2025 - 280000 $
We waiting for Fed decissions in this week.
- FOMC protocol 28 may 2025 - 19:00 (GMT +1)
- PKB USA 29 may 2025 - 2:30 PM (GMT +1)
- Core PCE 30 may 20

See all ideas
Summarizing what the indicators are suggesting.
Oscillators
Neutral
SellBuy
Strong sellStrong buy
Strong sellSellNeutralBuyStrong buy
Oscillators
Neutral
SellBuy
Strong sellStrong buy
Strong sellSellNeutralBuyStrong buy
Summary
Neutral
SellBuy
Strong sellStrong buy
Strong sellSellNeutralBuyStrong buy
Summary
Neutral
SellBuy
Strong sellStrong buy
Strong sellSellNeutralBuyStrong buy
Summary
Neutral
SellBuy
Strong sellStrong buy
Strong sellSellNeutralBuyStrong buy
Moving Averages
Neutral
SellBuy
Strong sellStrong buy
Strong sellSellNeutralBuyStrong buy
Moving Averages
Neutral
SellBuy
Strong sellStrong buy
Strong sellSellNeutralBuyStrong buy
Displays a symbol's price movements over previous years to identify recurring trends.
Frequently Asked Questions
The current price of Bitcoin (BTC) is 107,281 USDC — it has fallen −0.03% in the past 24 hours. Try placing this info into the context by checking out what coins are also gaining and losing at the moment and seeing BTC price chart.
Bitcoin price has risen by 3.74% over the last week, its month performance shows a −0.39% decrease, and as for the last year, Bitcoin has increased by 74.35%. See more dynamics on BTC price chart.
Keep track of coins' changes with our Crypto Coins Heatmap.
Keep track of coins' changes with our Crypto Coins Heatmap.
Bitcoin (BTC) reached its highest price on May 22, 2025 — it amounted to 111,988 USDC. Find more insights on the BTC price chart.
See the list of crypto gainers and choose what best fits your strategy.
See the list of crypto gainers and choose what best fits your strategy.
Bitcoin (BTC) reached the lowest price of 3,609 USDC on May 11, 2020. View more Bitcoin dynamics on the price chart.
See the list of crypto losers to find unexpected opportunities.
See the list of crypto losers to find unexpected opportunities.
The safest choice when buying BTC is to go to a well-known crypto exchange. Some of the popular names are Binance, Coinbase, Kraken. But you'll have to find a reliable broker and create an account first. You can trade BTC right from TradingView charts — just choose a broker and connect to your account.
Crypto markets are famous for their volatility, so one should study all the available stats before adding crypto assets to their portfolio. Very often it's technical analysis that comes in handy. We prepared technical ratings for Bitcoin (BTC): today its technical analysis shows the buy signal, and according to the 1 week rating BTC shows the strong buy signal. And you'd better dig deeper and study 1 month rating too — it's strong buy. Find inspiration in Bitcoin trading ideas and keep track of what's moving crypto markets with our crypto news feed.
Bitcoin (BTC) is just as reliable as any other crypto asset — this corner of the world market is highly volatile. Today, for instance, Bitcoin is estimated as 0.45% volatile. The only thing it means is that you must prepare and examine all available information before making a decision. And if you're not sure about Bitcoin, you can find more inspiration in our curated watchlists.
You can discuss Bitcoin (BTC) with other users in our public chats, Minds or in the comments to Ideas.