CRYPTO - Big Smackdown Then AltSeason ?The Crypto Cycle Gurus are telling us that AltSeason is just around the corner since the expected 4 year cycle completion is just a few months away...
But are they correct or is there a twist in the tale ?
Here's a 10 minute video to show a potential twist.
There might just be a DEEP dip buy opportunity coming down the road...
Not advice
BTCUSD trade ideas

Bitcoin Trajectory for Q2 and Q3 2025Bitcoin clearly have lack of buying pressure at this stage. Currently price creating a Rounded Top structure, which we've seen in the past. Projected target zone for this pattern is swing to $107,000 and swing down to $91,000.

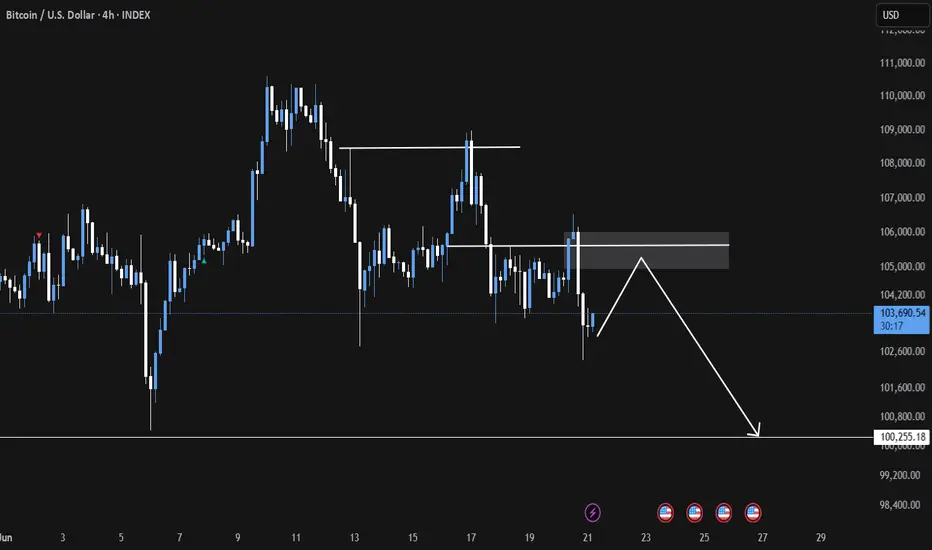
Bitcoin (BTC/USD) Range Breakdown in Focus Key Support at $93353"Bitcoin (BTC/USD) on the 4H timeframe is currently trading within a well-defined consolidation range, as highlighted on the chart. Price action has repeatedly tested the lower boundary of the range without a confirmed breakdown yet.
The chart illustrates a potential bearish scenario where a decisive break below the range support could trigger a move towards the next major support zone at 93,353.55 USD. A failure to hold this level may open further downside potential.
The Ichimoku Cloud shows a neutral-to-bearish bias, which adds weight to the possibility of a breakdown.
Key Levels to Watch:
Range Resistance: Around 108,000 USD
Range Support: Around 103,800 USD
Major Support: 93,353.55 USD
Current Bias: Bearish (unless price reclaims the upper range resistance)
Traders are advised to wait for a confirmed breakout before considering new positions."

Is every fall an opportunity?Is every fall an opportunity?
Of course not! Because sometimes, the lower you get, the lower you get. You need to know 2 things here:
1- Why did we buy?
2- How long is our maturity?
➡️ Example:
I believe that Bitcoin CRYPTOCAP:BTC will continuously increase in value in the long run. Because I know why I bought it. It's simple math (fixed in my article profile). But is there no risk?
Of course, there is risk.
❌ For example, if the US bans it?
This is unlikely today, but of course it can happen. As a matter of fact, the US banned gold investment between 1933-1974. Such a thing would not end Bitcoin, but it would make the road very long.
✅ So?
1- If you believe that what you are buying will appreciate in the long run and you have a long maturity, declines are opportunities.
2- But if you've only heard about your investment from someone, then you're more likely to get scared and sell at every drop.
Thanks for reading 🙏
BTC/USD (4-hour interval)📈 BTC/USD
🕒 Interval: 4H
1. General trend
We are observing a medium-term downtrend.
Since June 10 (middle vertical line), the price has been systematically creating lower highs and lower lows.
Current price: approx. USD 102.625.
2. Formation and Price Action
🔻 Left side of the chart (May 20 - June 10):
Volatility, no clear direction, but local highs are formed in the area of USD 111,000 - 112,500.
Consolidation from May 27 to June 2.
🔻 Right side of the chart (after June 10):
A clear breakout from the consolidation downwards.
A potential correction or continuation of the downward movement is currently forming.
The last candles suggest a strong downward impulse, and the current candle has a long lower shadow – a possible demand reaction.
3. Technical levels
📉 Resistance:
$112,400 – local peak from June 10.
$109,000 – $109,500 – area of previous consolidations.
$107,000 – lower limit of previous support.
📈 Support:
$102,000 – currently tested level.
$100,000 – psychological support level.
$97,000 – potential range of further declines.
4. Stochastic RSI (oscillator at the bottom of the chart)
The indicator currently shows the intersection of the %K and %D lines in the oversold zone.
This may suggest a short-term upward rebound – but in the context of a downtrend, this may just be a correction.
5. Candles and price action
The last candle has a long lower shadow and a close close to the maximum – this may indicate buyer pressure in this zone.
No confirmation of a reversal – only the closing of a bullish candle and a breakout above USD 103,500–104,000 may give a signal of a larger rebound.
6. Scenarios
✅ Bullish scenario (short-term):
Rebound from the USD 102,000 zone.
Test of USD 103,500–104,000 (local resistance).
If broken – a move towards USD 107,000 is possible.
❌ Bearish scenario (continuation):
Breakout of support at USD 102,000.
Movement towards the psychological level of 100,000 USD.
Possible escalation of declines on increased volume.
7. Signals to watch
Price behavior in the area of 102k USD - a key place to react.
Volume indicators (not visible here) could confirm the direction of the movement.
Will stochastic RSI give a full buy signal? (%K line above %D, both coming out of the oversold zone).

BTC/USD 1h Chart Analysis: BTFDBitcoin is showing a bullish structure on the 1h timeframe with a potential move towards $109,000.
On smaller timeframes, it exhibits a clear "buy the dip" profile.
Key Levels:
$109,000: Potential upside target.
$107,000: Resistance/Support zone to watch for rejection.
$105,000: Low Volume Node (LVN*) a possible good long entry zone.
$102,000 - $100,000: Support levels to monitor if $105,000 fails.
Currently it have bullish trend with a potential dip near $105,000 showing good entry point.

ES1! & BTCUSD Daily Trade SetupsIn this update we review the recent price action in the E-mini S&P500 futures and Bitcoin identifying the next high-probability trading setups and price objectives to target. To review today's video analysis, click here!

BtcusdIn my opinion, Bitcoin has begun to correct to the specified range and this correction could happen very quickly.

CRYPTO - 4 Year Cycle May Fail But AltSeason May Yet Arrive Late50 minutes depth TA covering many aspects of crypto + considerations of the dominant influence of stock indexes.
If you appreciate the effort given for FREE then do hit the BOOST - it encourages me to continue to operate on this website 👍
Not advice.

Will Bitcoin Try New All Time High?Bitcoin's Volume Profile Support at 103,900 is holding.
Hold here (again) and likely another test for new ATH.
Breaking it means retrace down to the 94k-93k 50% Retracement + Volume Profile region.
Then, time comes into play with the tried and tested Bitcoin Daily Ichimoku Cloud Strategy. If Chikou (used as momentum) does not clear the cloud at the same time as price the bull trend is neutral but still intact.
If the move happens quickly the Support region is likely to hold and retest the highs once more in weeks to come...
2 situations reverse the trend to bearish:
1. Price moves quickly to sub-90k
2. Price moves more slowly to the 50%-VP region.
Both situations get Chikou out at the same time as price. Timing and price come together to flip the trend to bearish.
Trade Wisely

BITCOIN ROAD TO $44k - UPDATEI am updating the leading diagonal formation development, together with other insights that, if synergized properly, can give us the early warning of a potential crash towards $44k!!!!

C Leg NOT in.BTC didnt retrace to the 0.382fib and its probably an A leg in a sideways market.
The C Leg need to back test the 0.382fib and could possibly go down to the 0.854fib.

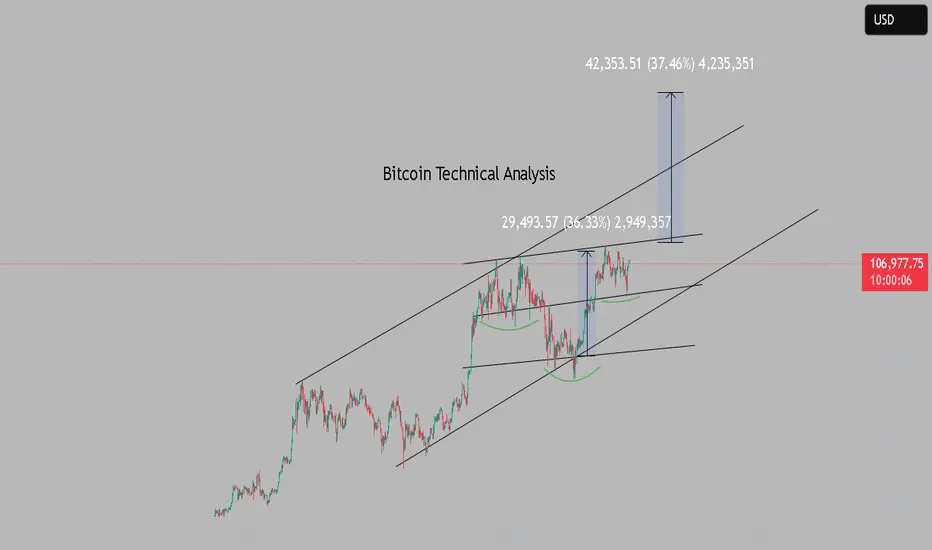
Bitcoin Technical AnalysisAnyone who has some knowledge of the chart can already see what is what.
A "reverse OBO" (head-shoulders) formation is forming within the ascending channel.
However, the right shoulder does not seem to have formed yet. This rise may be a "fake out".
In the coming days, we may see a sharp sell-off in CRYPTOCAP:BTC and a pullback to the 94-95K band.
These levels have both tested the lower support of the ascending channel and are important for the formation of the right shoulder.
If there is a period of accumulation in this support area, "Altcoins and #ethereum may experience a serious rise."
After this accumulation process, #Bitcoin may rise again in the last quarter of the year and move towards the upper resistance of the channel.
Where is this resistance zone?
Exactly the 150-160K range.
In other words, both the target of the technical formation and the resistance of the ascending channel since 2023 point to the same place.
Moreover, 2 strong Fibonacci levels intersect in this area.
In short:
If the right shoulder is read correctly, a short-term decline and accumulation can be expected.
However, a Bitcoin performance of over 150K in the last quarter of the year is not far away.
"This chart can work."
P.S.: If #BTC opens above 110K, the right shoulder formation will be completed at $98,500, and the rise process can be considered to have started.
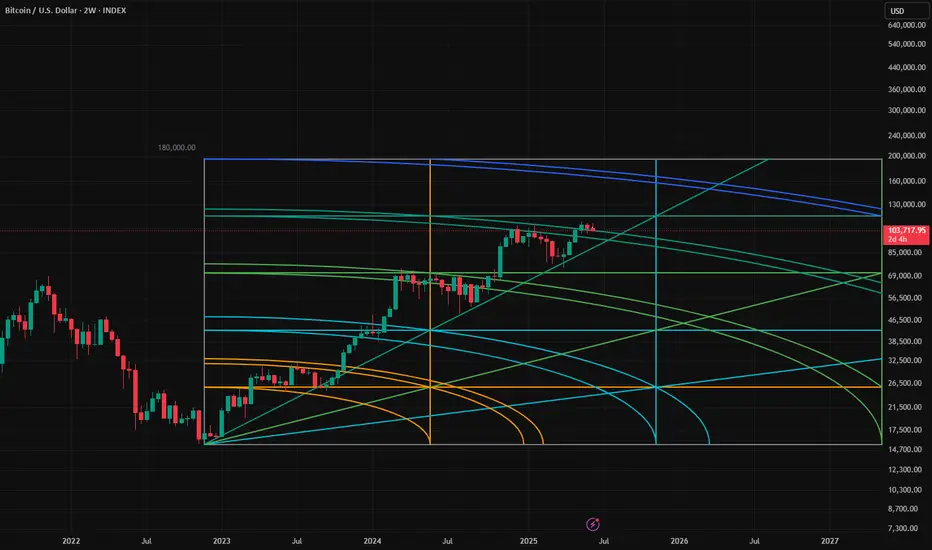
BTC Fixed Rings and TangentsReally quite nice to look at but I bet these trends and rings will hold great data moving forward as well.
You can also add your own vertical and horizontal lines to the circle tangents for price levels and SOME (possible) pivot data.

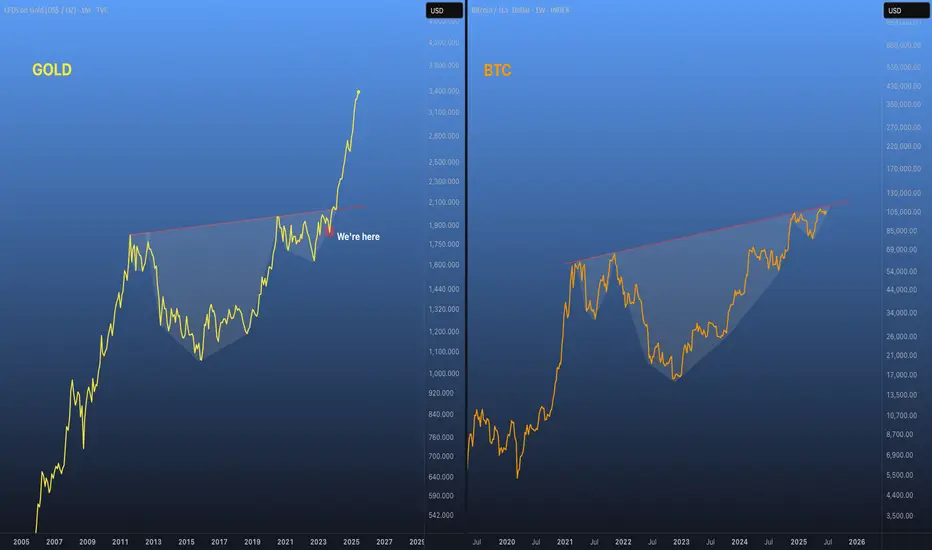
XAU vs. BTC👀 So far, none of the #Bitcoin - #Gold fractals I’ve shared earlier have failed. 👌
Here’s another high-timeframe comparison that I genuinely believe in. 🐋
Yes, #XAU is gaining momentum as global tensions rise — but that #BTC scenario works just fine for me. 📈
After all, the ~$150K range has been my target for this cycle for the past few years.
Bitcoin Market Analysis | Bitcoin Order Flow Turns Bearish Bitcoin Order Flow Turns Bearish
Bitcoin's order flow has shifted decisively to the bearish side. Price is consistently treating each down-closed candle as resistance, leading to a series of downward pushes.
The daily order block (OB) has effectively rejected price, aligning with the overall bearish tone and triggering a continuation toward lower levels.
Currently, price action appears to be targeting the sell-side liquidity near the $100,000 mark.
Upward Momentum, Caution Near 106,500–110,000 Resistance__________________________________________________________________________________
Technical Overview – Summary Points
Momentum: Strong bullish bias on mid/long-term (1D-4H), short-term "Down" divergences (1H/2H). Overall alignment, no capitulation/euphoria signals.
Key supports / resistances: Supports at 103,300/102,600 (D Pivot Low, 720 Pivot). Major resistances: 106,480–109,952. Price compression under daily/weekly resistance, technical rejection risk.
Volumes: Normal to moderately high, 1H abnormal volumes signal possible squeeze.
Multi-TF: Bullish confluence 1D–6H, short-term Down divergences, caution required for late long entries under resistance.
Risk On / Risk Off Indicator: "Strong Buy" signal consolidated across all timeframes except 15min (neutral ST), sector bullish.
ISPD DIV: Neutral on all TFs – no behavioral overheating or exhaustion.
__________________________________________________________________________________
Strategic Summary
Overall bias: Bullish HTF setup (1D–4H), buy opportunities on dips towards 103,300/102,600, stop <102,000.
Risk zones: 106,480–109,950 = resistance cluster, active management required. Technical invalidation below 102,000.
Macro catalysts: Window of increased volatility 15:00–16:00 UTC (CB Consumer Confidence & Powell speech). Middle East geopolitics = “wildcard”, caution on any escalation.
Action plan: Buy on pullback, manage actively >106,000, mandatory protection during news hours, reassess post-macro-volatility.
__________________________________________________________________________________
Multi-Timeframe Analysis
1D & 12H: Upward momentum confirmed, solid supports, no exhaustion signals, Risk On / Risk Off Indicator "Strong Buy".
6H–4H: Technical and behavioral confirmation, constructive volumes, caution near immediate resistances.
2H–1H: Short-term downside divergence, 1H very high volumes = potential squeeze or shakeout, active caution required under resistance.
30min–15min: Consolidation/digestion; Risk On / Risk Off Indicator neutral at 15min, no impulsive entry point yet.
Summary: Robust up-structure on HTF, buy-side strategies on dips favoured, active management imperative near resistance and macro volatility events.
__________________________________________________________________________________
Fundamental, On-Chain & Macro Risks Analysis
Macro news: No immediate catalysts except USD news (CB Consumer Confidence, Powell) at 15:00-16H00 UTC, source of temporary volatility – no prevailing trend in question at this stage.
On-chain / Market: High volumes, institutional leadership, no “retail” panic, no flush/fomo, healthy structure.
Leverage: OI >$95B, stablecoin dominance, risk contained except on external triggers (macro, geopolitical).
Geopolitics: Middle East context = spike risk, active management mandatory on escalation.
__________________________________________________________________________________
Summary:
• Dominant bias Up (buy on dips >102,600), active management below major resistances (106,500–110,000).
• Key stop <102,000 (invalidation).
• Increased risk window: 15:00–16:00 UTC (USD news).
• Monitor leverage, adjust exposure ahead of key catalysts.

Quick BITCOIN update 98K incomingWe talked about this possibility on Friday and now it seems to be happening
We have support and we will hopefully Hold on that Fib extensiona nd risong line pf support.
The madness in the world right now , however, may decide to try and crash markets
If you decide to sell out, AVOID THE $
Me , I will remain Holding for a while longer

btcusd two weeks trump time scale bearishTrump TACO time scale two weeks looks reasonable time scale
2W candle of #Bitcoin closing this weekend.
If CRYPTOCAP:BTC will not hold the 104000 - game over we visit margin call level of Saylor's Strategy 60 000 and most possibly lower 30 000

BTC Experiencing Retracement: Bound for Mid to Lower 90k Range?Bitcoin appears to have officially commenced its retracement.
The yellow-box support zone around 96k-92k may serve as a key level to watch, though a dip as low as 90k wouldn’t be out of the question.
As shown by the provisional Elliott Wave count labeled corrective wave ABC, I interpret this as a short- to mid-term correction. While Wave C can take various forms, this scenario anticipates a typical diagonal triangle structure.

SaylorCycle - The Next 100XWe are in the first year of the SaylorCycle.
The next decade we will see a complete change in the structure of the Bitcoin market as there is a 10 year boom in bitcoin accumulation on a global level.
Bitcoin will be seen as a corporate treasury, and there will be thousands of public companies hoovering up Bitcoin for their Corporate Treasuries.
Bitcoin will also been seen as a Strategic Reserve and countries will compete with each other to accumulate as much as possible.
Individuals will also be given plenty of options to earn bitcoin as companies like Square and other major payments companies adopt Bitcoin for merchants.
Retail will have plenty of options to get bitcoin exposure and new technologies like chaumain ecash mints will scale Bitcoin to billions enabling small retail savers to accumulate sats.
The last decade was the story of Bitcoin transitioning from an illegitimate asset to a legitimate asset, and now Bitcoin is transitioning from a legitimate asset to a must own asset.
Over the next decade Bitcoin will become a global reserve asset up there with US treasuries and Gold.
We should no longer see 80-90% drawdowns and the Bitcoin market structure should move like the rest of the global markets as there is a strong bid for bitcoin from institutional & sovereign buyers.
In this 10 year SaylorCycle, we should expect to see "bear market" declines as low as 50% and "bull market" rises as high as 200% year over year.
I believe the days of parabolic bitcoin advances and brutal 90% drops are done, and Bitcoin will advance to levels as high as $10 million per coin over the next decade or 2, giving parabolic-like returns.
I believe there is one last 100X in Bitcoin, but it will happen over 10-20 years instead of 1-2.
I am going to position myself conservatively to be ready for the worst case scenario where this is wrong and we do see a -90% drop. Don't over-leverage yourself. You should always be able to survive -90% without being a forced seller or being liquidated on loans.

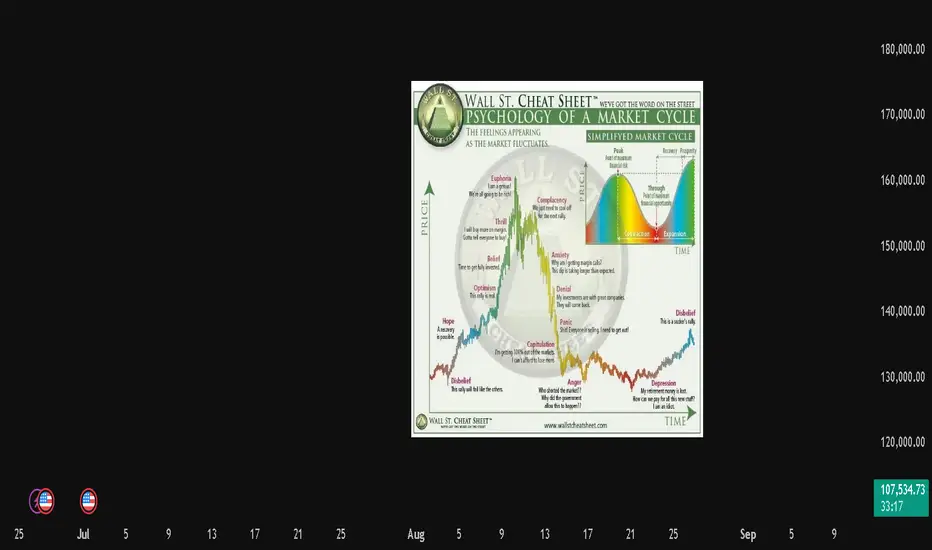
Euphoria in the air! But, will it get us there?
-liquidity pools at white lines
-triangle formation atop fast move up
-gan fan from recent move and one dating back to Nov '22 coincide
-lost support of 50ma on 12h tf
conclusion: before any significant move upward,
i think that bitcoin will first reclaim liquidity around
the 97,700-99,988k zone. if support lost there, next zone below would be ~90,225k. this could either be a deswelling of momentum into a further drop, or a compression event, indicative of a rapid, significant move, possibly beyond current ATH ranging up to 181,678 thousand dollars or there abouts.
Im building a position broken up into many parts to wait out this long grind we have ahead of us.

Bitcoin will go to it's next arc for sure around 170K!Btc will gravitate to the next arc After this consolidation!