Is Bitcoin Ready for Its Next Leg Up? Here’s What We Know So FarBitcoin BITSTAMP:BTCUSD is so back — not just back like “we recovered the dip,” but back like “new all-time highs, let’s go shopping for Lambos on moons” back.
If you’ve been following our Top Stories coverage, you’ll know that the OG token vaulted past $109,500 last week, then kissed $111,900 in “Tom Cruise falling off a building” style. Only that there wasn’t a fall to the ground. Instead, Bitcoin prices got stuck near $110,000 and are now waiting for the next catalyst.
Where are we in the cycle? The memes are pumping. Maxis are chest-thumping (this one’s for you, Saylor ). And the market? Well, it’s trying to figure out if this rocket still has fuel, or if we’re hovering at apogee before gravity reminds us it’s still a thing.
Let’s break down what’s really going on — with numbers, context, and just enough forecast to keep it spicy.
🚀 Bitcoin Goes Bionic
Call it what you want — a breakout, a blowoff, or a moonshot — Bitcoin just rewrote the record books. The OG coin is up 48% since its April lows, a run that’s as explosive as it is poetic.
Remember the bearish chants echoing when BTC dipped near $74,000 in early spring? And all those Bitcoin permabears saying it’s all going to zero? Yeah, those are suddenly hard to hear over the rocket engines.
This is the moment Bitcoin believers have been waiting for. Institutional interest continues to show inflows are strong. Adoption is real and making solid progress. And price action is loud — loud enough to drown out the skeptics still quoting tulip bubbles from 1637.
💥 Why the Breakout? A Perfect Storm
Looking at the fundamentals and the technicals — this wasn’t a fluke. It was a perfect cocktail of macro tailwinds, regulatory green lights, and unrelenting digital gold fever.
ETF flows? Exchange-traded funds are collecting record levels of fresh capital — all eleven of them .
Institutional demand? Climbing faster than Saylor can tweet.
Macro backdrop? Soft dollar, muted inflation, and a shiny 90-day trade truce between the US and China paired with one between the US and the EU .
Regulatory mood? A lot less hostile than the Biden administration, with a stablecoin bill clearing the Senate’s procedural vote and Texas passing a law to hold Bitcoin in its reserve fund.
Bitcoin didn’t ride the wave — it was the wave. And with volatility finally working for traders, not against them, the rally gained real traction.
📉 Not All Risk is Behind Us
Now before we start naming stars after Satoshi, let’s pump the brakes (just a little). The flagship crypto might be chilling around $110,000, but this asset class has the emotional range (and discipline) of a toddler. We’ve seen rallies like this before. We’ve also seen how quickly they unravel.
Upcoming economic data could throw a wrench in the gears. Here’s what to watch for this week:
Wednesday: Fed minutes
Thursday: GDP figures
Friday: Core PCE inflation
Any surprises here — especially hotter-than-expected inflation or hawkish Fed sentiment — could rattle the risk-on party. Bitcoin loves liquidity. If the Fed hints at tightening, the rocket might need to refuel mid-air.
🧭 Key Levels to Watch
Technically, the $111,900 print is your short-term ceiling. It’s the new line in the sand — the price everyone’s watching, waiting for a clean break or a hard rejection.
On the downside, $105,000–$106,000 is developing as support. Break that, and $100,000 becomes the psychological safety net. Below that? Well, let’s not talk about it unless we have to.
Until then, price is consolidating. Think of it like a pit stop — a chance for bulls to breathe, for bears to panic quietly, and for traders to argue about Fibonacci levels.
🛰️ Is $120K Next? Or Is This the Top?
But let’s dig into it a little bit. The real question is whether this rally still has legs. Some traders are calling $120,000 a “magnet level.” Others are treating current prices like the top and selling into strength.
The answer? Probably both.
Momentum is still there — just cooled off a bit. Volume’s down slightly. Social buzz is still high up there. The market’s in a classic “wait-and-see” phase, prepping for a bigger move in either direction.
What could break the stalemate?
A blockbuster inflation report (bullish if soft).
Another policy win from Washington.
Or the most powerful force of all: a dovish stance from the man who moves markets with a simple “Good afternoon” (bonus points if you guess who that is!)
📢 Final Word: Celebrate, But Stay Sharp
If you’ve been long since the dip, this is your moment. Pop some virtual (or real?) champagne. Screenshot that green PnL. Post a gif of Elon and Trump dancing.
But if you’re entering now, zoom out. Yes, momentum is bullish. Yes, fundamentals are stronger than ever. But Bitcoin doesn’t do straight lines for long. And your stop-loss isn’t going to set itself.
Whether $120K is next or we pull back to reset, the next few sessions will be crucial.
Your move : Are you buying this breakout? Waiting for confirmation? Or just enjoying the view from orbit? Let us know how you’re playing this Bitcoin beast — because one thing’s certain: it’s never boring up here.
BTCUSD trade ideas

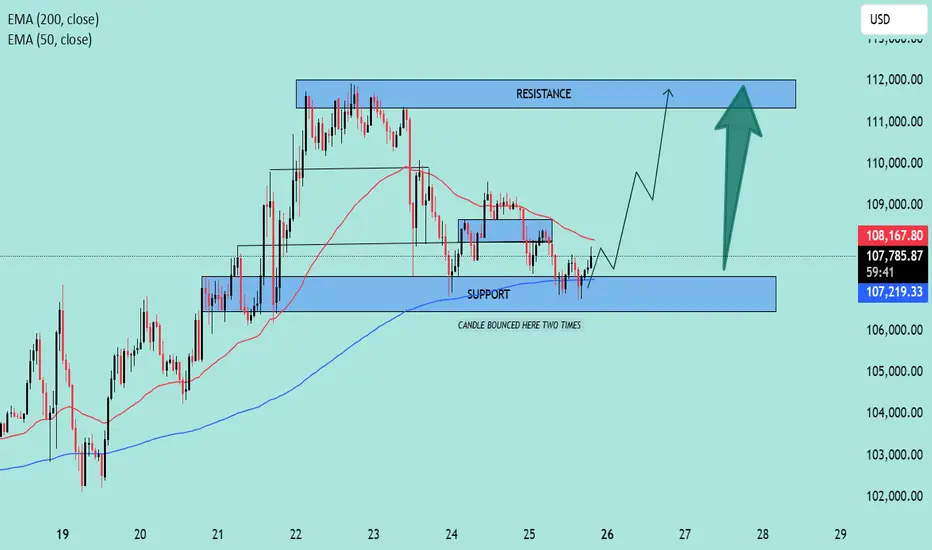
BTC/USD Rebound in Play! | Key Support Holding, Eyes on $112K📊 BTC/USD Technical Analysis
🗓️ Chart Date: May 25, 2025
🔍 Key Levels:
🔵 Support Zone: $106,800 – $107,300
Notably, price bounced twice in this region, indicating strong buying interest.
This area aligns closely with the 200 EMA (currently at $107,213.51), adding further confluence as dynamic support.
🔴 Resistance Zone: $111,800 – $112,300
Previous highs and consolidation make this a significant area where sellers may re-enter the market.
📈 Indicators:
🔵 EMA 200 (Blue): $107,213.51
Acts as a strong dynamic support; price bounced off it recently.
🔴 EMA 50 (Red): $108,182.91
Price is currently below the 50 EMA, suggesting short-term bearish pressure remains until this level is reclaimed.
🧠 Market Structure & Price Action:
After a sharp drop from the resistance zone, price found solid footing at the support zone.
Recent candles show rejection wicks from the downside, hinting at potential bullish reversal.
A breakout above minor consolidation and 50 EMA could trigger a bullish continuation toward the resistance.
📌 Forecast:
✅ If the price holds above the support zone and breaks above $108,200, we can expect a bullish move toward $112,000.
⚠️ However, a failure to break above the 50 EMA could lead to a retest of the support zone.
🧭 Trade Idea (Not Financial Advice):
📥 Long Bias:
Entry: On confirmed breakout above $108,200
SL: Below $107,000
TP: $111,800 – $112,300
📌 Conclusion:
The chart setup suggests a potential bullish reversal 📈 from a key support zone, supported by EMA 200. Watch for a break above the 50 EMA for momentum confirmation.
🧠 Always confirm with volume and wait for confirmation before entering a position.
BTCUSD NEXT MOVE (EXPECTING MILD BEARISH)(28-05-2025)Go through the analysis carefully, and do trade accordingly.
(TODAY ANALYSIS IS LOW ACURACY ANALYSIS)
Anup 'BIAS for BTCUSD (28-05-2025) (SHORT TERM)
Current price- 109000
"if Price stay below 1,10,000 then next target is 1,08,000, 1,07,000 and 1,06,000 above that 1,11,000.
-POSSIBILITY-1
Wait (as geopolitical situation are worsening )
-POSSIBILITY-2
Wait (as geopolitical situation are worsening)
Best of luck
Never risk 2% of principal to follow any position.
Support us by liking and sharing the post.

BTCUSD Analysis Today: Technical and On-Chain !In this video, I will share my BTCUSD analysis by providing my complete technical and on-chain insights, so you can watch it to improve your crypto trading skillset. The video is structured in 4 parts, first I will be performing my complete technical analysis, then I will be moving to the on-chain data analysis, then I will be moving to the liquidation maps analysis and lastly, I will be putting together these 3 different types of analysis.

BITCOIN No different than all the Bullish Legs since 2023!Bitcoin (BTCUSD) has just completed a Golden Cross on the 1D time-frame, the 4th such pattern since February 05 2023. All those Golden Crosses have been formed marginally after the Channel Up bottoms and start of their respective Bullish Legs.
The current pattern is no different than any other of those Bullish Legs. On top of that, the 1W MACD has also formed its usual Bullish Cross that has technically always preceded the 1D Golden Cross.
Given that, when this happens, BTC tends to be at least near the 0.5 Fibonacci level from the eventual top, we can estimate that the next peak might be around $165000. This is another indicator that makes our $150k Target for this Cycle more than realistic.
But what do you think? Are you also expecting the market to explode past $150k? Feel free to let us know in the comments section below!
-------------------------------------------------------------------------------
** Please LIKE 👍, FOLLOW ✅, SHARE 🙌 and COMMENT ✍ if you enjoy this idea! Also share your ideas and charts in the comments section below! This is best way to keep it relevant, support us, keep the content here free and allow the idea to reach as many people as possible. **
-------------------------------------------------------------------------------
💸💸💸💸💸💸
👇 👇 👇 👇 👇 👇

BITCOIN Desperately needs that weekly closing!Bitcoin (BTCUSD) broke last week above its January Resistance, effectively making a new All Time High (ATH). Technically, within BTC's dominant 2.5-year Channel Up, that is not enough to generate a bullish extension on its own and the reason is that a 1W candle closing above the Resistance level is needed and not just a break.
At least that's what happened during the last two Bullish Legs, where it required a convincing 1W candle close considerably above the Resistance, to confirm the Bullish Extension. In fact the break-out candles on both previous Bullish Legs is fairly identical.
The minimum % rise on the pattern's three Bullish Legs has been +96.75% with the others not falling way off that range (+98.74% and +106.94%). As a result, the bare minimum Target we can be expecting, in the event of a 1W candle closing above the $109500 Resistance, is $147000.
Do you think that' within the market's immediate reach? Feel free to let us know in the comments section below!
-------------------------------------------------------------------------------
** Please LIKE 👍, FOLLOW ✅, SHARE 🙌 and COMMENT ✍ if you enjoy this idea! Also share your ideas and charts in the comments section below! This is best way to keep it relevant, support us, keep the content here free and allow the idea to reach as many people as possible. **
-------------------------------------------------------------------------------
💸💸💸💸💸💸
👇 👇 👇 👇 👇 👇

BTC/USD..4H CHART PATTERN.technical breakdown of your BTC/USD 4H trade setup based on the data I'm provided:
---
BTC/USD 4H Chart Pattern Analysis
Current Action:
SELL @ 106,000
---
Key Technical Levels:
Entry Point (Sell): 106,000
(Indicates rejection at or near resistance or possible trendline breakdown)
Target 1: 102,000
(Short-term support or previous demand zone)
Target 2: 93,500
(Major support zone — likely a high confluence area from past structure)
---
Pattern & Price Action Analysis:
Bearish Reversal Signal Likely at 106K:
Potential rejection wick, double top, or bearish engulfing at this level.
Descending Triangle or Rising Wedge Breakdown:
If price broke support of a wedge or triangle pattern, this would justify bearish continuation.
Volume Analysis (if applicable):
Decreasing volume on the push up followed by a heavy sell-off = confirmation of a trap and reversal.
---
Trade Setup:
Sell Entry: 106,000 (activated)
Stop Loss (suggested): 107,500–108,000 (above key resistance or invalidation zone)
Take Profit 1: 102,000 (watch for bounce)
Take Profit 2: 93,500 (major target if trend continues)
---
Risk-Reward Outlook:
Risk-Reward Ratio to 102,000: ~2:1
Risk-Reward Ratio to 93,500: ~4–5:1 (strong swing trade potential)
---
Summary:
This is a bearish swing trade setup based on a potential rejection or pattern breakdown at the 106,000 level, with high-probability targets at 102,000 and 93,500. Risk management is critical due to BTC's high volatility.
---

Bitcoin: Too Early To Buy The Retrace.Bitcoin may be entering a brief corrective formation within the broader bullish trend. The large red candle that rejected the 113K resistance (see my previous article), could be the beginning of a retrace that can take price as low as the 102,500 to 100K area IF bearish momentum persists. The mistake to avoid is buying this pullback too early, especially since there is no bullish confirmation on this time frame.
The red candle off the 113K area is what I like to refer to as the "mother bar". As you will notice, the following candle is a bearish pin bar which failed to break back above the 50% point of the mother bar (see blue arrow). This is a "mini" lower high and is typically a bearish sign for those operating on smaller time frames. A break below 106,500 would confirm a sell signal on this time frame as well as smaller time frames like 4H and 1H. This can be attractive for aggressive shorts, BUT it is very important to keep the broader trend in perspective.
This bearish development does NOT constitute a change in the broader trend. This means support levels are still more likely to hold, and resistances more likely to break. The higher probability scenarios in my opinion are bullish reversal patterns between the 102,500 - 100K area. Double bottoms, failed lows etc. on 1H, 4H or this time frame would be ideal for swing trade longs (see illustration). IF the bullish trend is going to stay intact, then a higher high is within reason which can see price test 113K or higher (120K is my next resistance).
Another VERY important consideration is the overall location of price. Currently in a Wave 5 (v) configuration which signifies limited potential in the near future. In other words, RISK is elevated and only continues to increase as price climbs higher. As "optimistic" as everyone may seem to be, this is a time to be more defensive, NOT aggressive. This can be accomplished by reducing expectations, operating on smaller time frames, and taking smaller positions. My Trade Scanner Pro helps to quantify risk which is especially helpful in rising risk environments such as this one.
In contrast, the location to be aggressively bullish was the 76K area low. Sure I can say this after the fact, BUT if you read my analysis and watch my streams from that time, I was pointing out the potential and the bullish signs as they were developing in real time.
Market situations like the one Bitcoin is in right now can be very confusing at times. Navigating this environment successfully depends on how you interpret price structures, trends and levels across multiple time frames and letting the MARKET validate ideas or not the other way around. Always consider arguments on both sides of the market and weigh those arguments against the style or strategy that you intend to deploy. And if confusion ensues, then the easiest thing to do is walk away. When potential is limited, there is nothing to fear in terms of missing out.
Thank you for considering my analysis and perspective.

BITCOIN repeating every Cycle's final rally!Bitcoin (BTCUSD) has been on a strong rally since the April 2025 bottom on the 1W MA50 (blue trend-line) and that's perfectly aligned with the 1W MA50 rebound it had on the previous two Cycles in June 2021 and June 2017.
As you can see, those (blue circles) where the All Time High (ATH) Pivot trend-line test before the final (parabolic) rally of the Cycle started, which was its most aggressive part.
In 2017 it was much stronger and the price rallied much higher, which is natural as the market was much less mature (institutionally) than today, but it is not improbable to get a rally similar to July - November 2021.
Can that be enough to push BTC to $150k and beyond? Feel free to let us know in the comments section below!
-------------------------------------------------------------------------------
** Please LIKE 👍, FOLLOW ✅, SHARE 🙌 and COMMENT ✍ if you enjoy this idea! Also share your ideas and charts in the comments section below! This is best way to keep it relevant, support us, keep the content here free and allow the idea to reach as many people as possible. **
-------------------------------------------------------------------------------
💸💸💸💸💸💸
👇 👇 👇 👇 👇 👇

Trading Signals for BTC/USD Sell below106,036 or buy above 106,3Scenario #1: My plan to buy Bitcoin today at the entry point $105,370, aiming for a rise to $107,600. Around $107,600, my plan to exit the buys and immediately sell on a pullback. Before buying on a breakout, ENSURE THE 50-day moving average is below the current price and the Awesome Oscillator is in the positive zone.
Scenario #2: Bitcoin can also be bought from the lower boundary at $105,300 if three is no market reaction to its breakout, aiming for $106,300.
Sell Scenario
Scenario #1: my to sell Bitcoin today at the entry point around $105.400, my plan to exit the sales and immediately buy on a pullback. Before selling on a breakout, ensure that the 50-day moving average is above the current price and the Awesome Oscillator is in the negative zone
Scenario #2: Bitcoin can also be sold from the upper boundary at $106,300 if there is no market reaction to its breakout, aiming for $105,400 and $104,400.

Bitcoin Daily: It Will Go Lower, I Will Explain WhyIt is hard to make these predictions because there are so many different points of view, so many opinions. There is so much data available that one can easily become confused. We can write an entire book about Bitcoin's next move and still not know what will happen next. I will keep it simple and straight forward and you will be able to understand and appreciate how easy it is when we focus on the chart only. Bitcoin is breaking below 100K.
Bitcoin is already trading at support. The mid-May consolidation range. From this range Bitcoin produced an advance and hit a new all-time high. The all-time high is a triple-top when we take the highs from January 2025 and December 2024. The fact that the action happens below this level now is bearish and this range has been confirmed as resistance.
The market will look for strength and this simply means lower.
Since resistance has been confirmed after a 50% rise, it is normal to see a retrace, can be medium-sized to balance out the strong-long bullish wave. Bullish action was present between 7-April until 22-May, 45 days.
The current retrace can take only a few weeks, think about 15-21 June as a rough estimate but nothing more (can end much sooner).
If you are unprepared and don't have map of the bigger picture, this can become terrifying and even lead to poor decisions at some point. If you know that this is only a retrace and the market will continue growing after a test above 90K, you can rest easy or even take advantage of this situation.
Now, what Bitcoin does is not the entire market. In a bull market, when Bitcoin moves down, money flows to the Altcoins. When Bitcoin goes sideways, the Altcoins grow. So dynamics will be much, much different now compared to what you saw in 2024, 2023 and 2022. The way the market will behave it is basically new for most participants.
The conclusion is that all is good and the chart is pointing lower short-term. After a short-term retrace, we get additional growth. Simple isn't it? It is...
Thank you for reading.
Namaste.

BTCUSD NEXT MOVE (EXPECTING MILD BEARISH)(02-06-2025)Go through the analysis carefully, and do trade accordingly.
Anup 'BIAS for BTCUSD (02-06-2025) (SHORT TERM)
Current price- 104500
"if Price stay below 1,07,000 then next target is 1,03500, 1,02500 and 1,00000 above that 1,11,000.
-POSSIBILITY-1
Wait (as geopolitical situation are worsening )
-POSSIBILITY-2
Wait (as geopolitical situation are worsening)
Best of luck
Never risk 2% of principal to follow any position.
Support us by liking and sharing the post.

BTC Trap & Reverse: The Power of SFPs in ActionBTC continues to chop in a tight range near its previous all-time high. While price action may appear messy at first glance, traders using a combination of structure, Fibonacci levels, and order flow tools are spotting clean opportunities — especially through Swing Failure Patterns (SFPs).
🔍 What Just Happened?
Bitcoin recently rejected from the 0.786 Fibonacci retracement level — a classic reaction zone. What made this move powerful was the SFP that formed at that level. Price swept above a prior high, triggering breakout buys, only to reverse. This type of move traps late longs and offers an ideal short entry.
🧠 Educational Insight: Why SFPs Are One of the Best Setups
SFPs (Swing Failure Patterns) are some of the highest-probability trades you can take for a few key reasons:
1️⃣ Liquidity-driven: They form where stop losses cluster — above highs or below lows — creating a magnet for price.
2️⃣ Clean invalidation: The wick high/low gives a natural stop-loss level, keeping risk tight.
3️⃣ Fast reaction: Once trapped traders are forced to exit, price often reverses sharply — giving you strong follow-through.
4️⃣ Confirmable with order flow: Using tools like Exocharts, you can see aggressive longs/shorts piling in just before the reversal. This adds conviction to the setup.
📏 Current Confluence:
Rejection from the 0.786 Fib retracement
SFP confirmed on high volume
1:1 trend-based Fib extension sits at ~$105,410
That level also lines up with the 0.666 Fib retracement
Anchored VWAP around $105K
Liquidity pool right at that zone too — a likely magnet
🎯 Trade Idea:
Short triggered at the SFP wick, stop just above it. First target: the 1:1 extension near $105.4K. Risk-reward is excellent with high probability if price continues to unwind late longs.
✅ Key Takeaway:
In ranges like this, you don’t need to guess direction — you need to react to structure. SFPs give you that edge. When paired with real-time tools like Exocharts and anchored VWAPs, these trades become sniper entries rather than coin flips.
Let the market show its hand — and trade the reaction, not the prediction.
📌 Summary:
This is how you avoid overtrading in chop: wait for key levels, watch how price reacts, and let trapped traders create the move. If BTC revisits the $105K region, it’s a major area to watch for reaction — or to take partials if you’re in a short.
The best trades come from patience + precision.
_________________________________
If you found this helpful, leave a like and comment below! Got requests for the next technical analysis? Let me know.

BTCUSD Analysis Today: Technical and On-Chain !In this video, I will share my BTCUSD analysis by providing my complete technical and on-chain insights, so you can watch it to improve your crypto trading skillset. The video is structured in 4 parts, first I will be performing my complete technical analysis, then I will be moving to the on-chain data analysis, then I will be moving to the liquidation maps analysis and lastly, I will be putting together these 3 different types of analysis.

BITCOIN - BEARISH MOVE !Hello Traders !
The Bitcoin failed to create a new higher high!
The price formed a descending triangle pattern.
Currently, the support level (106632 - 107332) is broken.
So, I expect a bearish move📉
________________
TARGET: 103170🎯

Bitcoin: Bear Flag Formation Implies Weakness.Bitcoin has retraced as anticipated in my previous article (see Wave 5). So much for all the nonsense hype at the Bitcoin conference. Bitcoin has tested the 103K area and found some support but is developing a mini bear flag (see arrow). IF the 103,500K level is broken, that confirms the corrective structure is still in play and a test of 102 to 100K can still be the dominant scenario for the coming week (NFP this week). This means for swing traders on this time frame, it is likely too early for longs.
The 102 to 100K area is still the major support that I anticipate. A long signal here can look like a pin bar on this time frame, or a double bottom formation on a 4h or 1h chart. It often pays to wait for these scenarios but there is always a risk of missing the move if price confirms a reversal pattern sooner.
IF the current candle closes much higher (above 106K) then it will invalidate the bear flag. This means the bullish continuation would be in play. In my opinion this is a lower probability, but you have to be open to it. In the bullish scenario a test of 110 to 112 servers as a profit objective. While a breakout beyond 112 can happen, the more you expect, the more RISK you must be exposed to. A test of high is more probable than a new high. Along with that, I suspect current price action is more likely to consolidate rather than continue high over the short term because 5 waves are clearly in place. That usually means a corrective structure is likely to follow, and that is what we are currently in.
The bullish candles are too early to buy into. If the bear flag plays out, there will be more attractive prices to wait for reversal formations. Otherwise, work smaller time frames, look for small bites going either way and keep the size small. This is not an easy environment.

BITCOIN $119k coming shortlyBitcoin (BTCUSD) has been trading within a 6-week Channel Up and Friday's tariff threats led pull-back was its latest Bearish Leg. That pull-back hit the 4H MA50 (blue trend-line) yesterday and rebounded. As long as the 4H MA100 (green trend-line) which is directly below the Channel Up holds, the current rebound is technically the pattern's new Bullish Leg.
All 4 previous Bullish Legs have ended on fairly similar % rises but the weakest has been +11.41%. With the 4H MACD just now completing a Bullish Cross (which has always been a strong buy signal), a repeat of the +11.41% minimum, gives us an immediate $119000 Target.
Do you think that's coming shortly before the beginning of June? Feel free to let us know in the comments section below!
-------------------------------------------------------------------------------
** Please LIKE 👍, FOLLOW ✅, SHARE 🙌 and COMMENT ✍ if you enjoy this idea! Also share your ideas and charts in the comments section below! This is best way to keep it relevant, support us, keep the content here free and allow the idea to reach as many people as possible. **
-------------------------------------------------------------------------------
💸💸💸💸💸💸
👇 👇 👇 👇 👇 👇

Bitcoin (BTC/USD) 1H Chart Analysis – Double Top Signals BearishPattern Formed: DOUBLE TOP
⚠️ Bearish Reversal Pattern Spotted!
📍 Formed near 111,794.8
⬆️ Price tested the top twice and failed – strong resistance confirmed!
Key Zones:
🔶 SUPPLY ZONE (Resistance):
🟧 111,794.8 - 111,829.8
🔼 Expect selling pressure here!
🔷 SUPPORT Zone (Broken!):
🔻 Price fell below this level, confirming a bearish breakout
🟩 TARGET ZONE:
🎯 102,500.0
✅ This is the likely drop target based on the pattern
🧊 Other minor supports:
* 102,820.6
* 102,750.8
* 102,227.0.
Indicators:
📈 Trend Line
* Supported the price during the uptrend
* ❌ Now broken — indicates momentum shift
📉 EMA 70 (Red Line)
* Current Price (108,238.6) is below EMA 70 = 109,245.0
* Indicates bearish pressure.
Trade Setup:
🔽 Short Entry Idea: After support break
🛑 Stop Loss: 111,829.8
🎯 Take Profit: 102,500.0
⚖️ Risk-Reward looks attractive!
Summary:
📉 Bearish bias confirmed by:
* Double Top pattern
* Supply zone rejection
* Support break
* EMA crossover
🚨 Traders Watch Out: Bears are in control — next major stop likely at 102,500.0!

Using Previous Day’s High and Low to Decide Intraday TrendIntroduction and Disclaimer
This article explains how to use the daily chart to understand and plan for short-term or intraday market direction.
To fully understand this, you should already know what directional bias means. If you’re not familiar with it, I highly recommend reading my previous article on the topic before continuing here.
Disclaimer
I'm not a financial advisor.
This article does not offer financial, investment, legal, or any kind of regulated advice.
It's made for educational and entertainment purposes only.
Trading involves risk. You can lose all your money—or even more—if you’re not careful.
You're reading the thoughts of a 22-year-old.
The goal of this article is to show you how to use the previous day’s high and low on a daily chart to:
Get a clear intraday bias (bullish or bearish).
Find entry signals for your trades.
Set clear invalidation points, meaning when a trade idea becomes invalid.
This is part of what’s called multi-timeframe analysis—looking at higher time frames to understand what might happen on lower ones.
Even if you trade short-term (like on 5 or 15-minute charts), it's still helpful to know what the bigger picture (like the daily chart) looks like. Why? Because it shows the main trend, important levels, and key zones that may not appear on lower time frames.
In my opinion, smart trading involves breaking down the price chart from top to bottom—starting with the big picture—then making decisions based on your trading strategy.
The ideas in this article work well for:
Intraday traders who want to capture moves during the day, and
Swing traders who want to catch bigger moves by entering early.
This concept can also be applied to higher time frames, such as the previous week’s high and low.

BTCUSD Up trend breakdown ahead selling strong🚨BTC/USD Breakdown Alert 🚨
BTC has officially broken down from the previous uptrend, confirmed by a strong bearish engulfing candle — signaling a clear shift in momentum. This is a prime opportunity to look for short setups.
📉 Sell Entry: 107,400
🎯 Technical Targets & Demand Zones:
🔹 1st Target: 103,700 – Minor demand zone
🔹 2nd Target: 96,400 – Stronger structural support
🔹 3rd Target: 85,100 – Deep liquidity zone
🔹 4th Target: 77,000 – Bullish Order Block
💡 Breakdown confirmed. Trend shift validated. Selling pressure likely to continue.
Trade smart. Manage risk.
— Livia 💼📊

Healthy BTC Retrace in Trend Next Breakout Target 112K Then 122KBitcoin continues to respect the bullish market highlighted in our previous analysis, where the AB=CD structure pointed toward significant upside potential. The market has since retraced into a well defined re-accumulation zone, aligning precisely with prior expectations.
Price has held firmly above the round figure support ($100k), with the current structure confirming a healthy correction within trend.
As long as the re-accumulation zone between 104k–107k holds, momentum remains skewed to the upside. The projected 2.618 extension sits near the 122k mark, where the current setup aims to complete.
The broader structure still respects higher timeframe demand and ascending channel boundaries, keeping bullish continuation valid unless 100k decisively breaks. Watch for confirmation breakout above 112k to activate the next leg of the move.
If you found this analysis insightful, drop a like to support the work and leave a comment with your perspective whether you agree, disagree, or have an alternate scenario in mind. Let's grow together through collective insights.

BITCOIN targets 165k based on VIX's 10-year SupportBitcoin (BTCUSD) has started a new (and possibly last for this Cycle) Bullish Leg following April's bottom and has already made a new All Time High (ATH).
The BTC/VIX ratio on that very same day (April 07 2025) hit and rebounded on its 10-year Higher Lows trend-line, a Support level that has been holding since the August 24 2015 market bottom.
Every rebound on this Higher Lows trend-line, has produced a strong medium-term rally, the 'weakest' of which has been the most recent (August - December 2024), which rose by +121.44%. If BTC repeats this 'minimum', we are looking at a $165000 High, which aligns perfectly with the majority of projections for this Cycle's Top.
Do you think we will see that price by October? Feel free to let us know in the comments section below!
-------------------------------------------------------------------------------
** Please LIKE 👍, FOLLOW ✅, SHARE 🙌 and COMMENT ✍ if you enjoy this idea! Also share your ideas and charts in the comments section below! This is best way to keep it relevant, support us, keep the content here free and allow the idea to reach as many people as possible. **
-------------------------------------------------------------------------------
💸💸💸💸💸💸
👇 👇 👇 👇 👇 👇

BTC/USD LongWaiting for the Breakout with a confirmation on the 5min timeframe for a bullish move getting some Liquidity and maybe move on to 200EMA and M3
