Intel (INTC) Shares Drop Over 6% in a DayIntel (INTC) Shares Drop Over 6% in a Day
As shown on the Intel (INTC) chart, after Tuesday’s candle closed above $21, the price dropped sharply on Wednesday. INTC was the worst-performing stock of the day among the components of the S&P 500 index (US SPX 500 mini on FXOpen).
Why Did INTC Shares
Key facts today
Next report date
—
Report period
—
EPS estimate
—
Revenue estimate
—
−4.47 USD
−18.76 B USD
53.10 B USD
4.35 B
About Intel Corporation
Sector
Industry
CEO
Lip-Bu Tan
Website
Headquarters
Santa Clara
Founded
1968
FIGI
BBG00YB9J0Y5
Intel Corporation engages in the design, manufacture, and sale of computer products and technologies. It delivers computer, networking, data storage, and communications platforms. The firm operates through the following segments: Client Computing Group (CCG), Data Center Group (DCG), Internet of Things Group (IOTG), Non-Volatile Memory Solutions Group (NSG), Programmable Solutions (PSG), and All Other. The CCG segment consists of platforms designed for notebooks, 2-in-1 systems, desktops, tablets, phones, wireless and wired connectivity products, and mobile communication components. The DCG segment includes workload-optimized platforms and related products designed for enterprise, cloud, and communication infrastructure market. The IOTG segment offers compute solutions for targeted verticals and embedded applications for the retail, manufacturing, health care, energy, automotive, and government market segments. The NSG segment constitutes of NAND flash memory products primarily used in solid-state drives. The PSG segment contains programmable semiconductors and related products for a broad range of markets, including communications, data center, industrial, military, and automotive. The All Other segment consists of results from other non-reportable segment and corporate-related charges. The company was founded by Robert Norton Noyce and Gordon Earle Moore on July 18, 1968 and is headquartered in Santa Clara, CA.

Intel - This might be the bottom!Intel - NASDAQ:INTC - might create a bottom:
(click chart above to see the in depth analysis👆🏻)
For almost an entire year, Intel has been consolidating at a major horizontal support. Considering the previous significant bloodbath, Intel might soon find its bottom, which is inevitably followed

Important Support and Resistance Zones: 23.03-28.93
Hello, traders.
If you "Follow", you can always get the latest information quickly.
Have a nice day today.
-------------------------------------
(INTC 1D chart)
It shows an upward trend above the 18.69-21.33 zone, which is a medium- to long-term buy zone.
However, you need to be relaxed becaus

WHAT'S THE FAITH OF INTEL CORPORATION STOCK? From the perspective of technical analysis, INTC is approaching a key psychological level at $19. In addition, it's in a downtrend. If the key level should hold by pushing price higher, leading to a break out of the downtrend line and closing with a strong bullish candle above the down trend line an

Intel poised for a breakoutIntel NASDAQ:INTC is quite possibly poised for a breakout, as we look at a triangle formation here on the 3W chart, roughly ten months in the making, beside consolidating momentum. Longer term timeframes are good for determining the main trend in a stock's price.
On the short term 4H timeframe, b

WHAT'S THE FATE OF INTEL CORPORATION STOCK?From the perspective of technical analysis, INTC is approaching a key psychological level at $19. In addition, it's in a downtrend. If the key level should hold by pushing price higher, leading to a break out of the downtrend line and closing with a strong bullish candle above the down trend line an

Long Intel as it's on the verge of starting super-cycle wave IIII expect Intel to break out of the ending diagonal (wave C of Y) and the beginning of wave III should start with huge volumes compared to what we've seen last months.
It is very much like with RRGB (you can find this idea in my profile) but on a larger scale in terms of waves degree. Today we've go

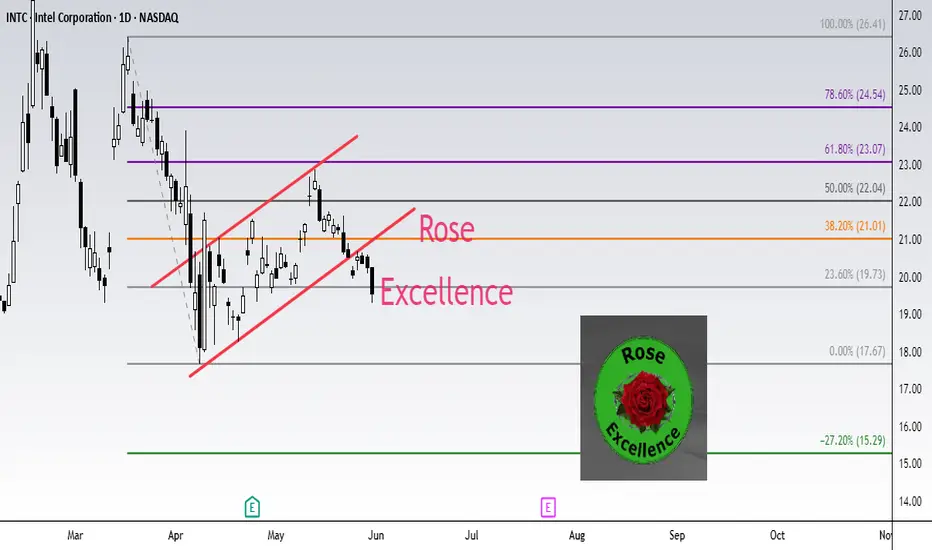
INTEL INTC Short setup target 15.29Fibonacci technical analysis : Intel Corporation NASDAQ:INTC has already found resistance at the Fib level 61.8% (23.07) of my Down Fib. The May 30th Daily candle has closed below retracement Fib level 23.6% (19.73), confirming a sell signal. A Bear Flag pattern has also formed. My Down Fib guides
INTC: Legacy Laggard or Coiled Spring? June 2026 $25 Calls in PlINTC: Legacy Laggard or Coiled Spring? June 2026 $25 Calls in Play
INTC is a strange bird.
A legacy tech giant that’s been trading since before I was born in 1968, it's spent the last few years struggling to keep up in a fast-moving semiconductor world. But here’s what stands out:
📉 The Stock: Br

Safe Entry Zone INTCPrice Movement Ranging.
Price Targeting 1h & 4h Green Zone.
Green Zones Are Buying Zones & Red Zones Are Selling Zones In Case Buying Zone broken down stock movement will be down and Vice Versa.
P.High(Previous High) & P.Low(Previous) Acts As significant Support and Resistance Levels.
Note: 1- P

See all ideas
Summarizing what the indicators are suggesting.
Neutral
SellBuy
Strong sellStrong buy
Strong sellSellNeutralBuyStrong buy
Neutral
SellBuy
Strong sellStrong buy
Strong sellSellNeutralBuyStrong buy
Neutral
SellBuy
Strong sellStrong buy
Strong sellSellNeutralBuyStrong buy
An aggregate view of professional's ratings.
Neutral
SellBuy
Strong sellStrong buy
Strong sellSellNeutralBuyStrong buy
Neutral
SellBuy
Strong sellStrong buy
Strong sellSellNeutralBuyStrong buy
Neutral
SellBuy
Strong sellStrong buy
Strong sellSellNeutralBuyStrong buy
Displays a symbol's price movements over previous years to identify recurring trends.
US458140BK5
INTEL 20/60Yield to maturity
8.17%
Maturity date
Feb 15, 2060
US458140BX7
INTEL 21/61Yield to maturity
8.07%
Maturity date
Aug 12, 2061
US458140BW9
INTEL 21/51Yield to maturity
8.00%
Maturity date
Aug 12, 2051
INTC4914060
Intel Corporation 3.25% 15-NOV-2049Yield to maturity
7.72%
Maturity date
Nov 15, 2049
US458140BV1
INTEL 21/41Yield to maturity
7.51%
Maturity date
Aug 12, 2041
INTC4633368
Intel Corporation 3.734% 08-DEC-2047Yield to maturity
7.36%
Maturity date
Dec 8, 2047
US458140AV2
INTEL CORP. 16/46Yield to maturity
7.25%
Maturity date
May 19, 2046
US458140AY6
INTEL CORP. 17/47Yield to maturity
7.23%
Maturity date
May 11, 2047
US458140BM1
INTEL 20/50Yield to maturity
7.02%
Maturity date
Mar 25, 2050
INTC5456467
Intel Corporation 5.05% 05-AUG-2062Yield to maturity
6.99%
Maturity date
Aug 5, 2062
US458140AP5
INTEL CORP. 12/42Yield to maturity
6.98%
Maturity date
Dec 15, 2042
See all INTC bonds
Curated watchlists where INTC is featured.


Related stocks
Frequently Asked Questions
The current price of INTC is 20.49 USD — it has decreased by −7.29% in the past 24 hours. Watch INTEL CORP stock price performance more closely on the chart.
Depending on the exchange, the stock ticker may vary. For instance, on BVL exchange INTEL CORP stocks are traded under the ticker INTC.
INTC stock has risen by 3.85% compared to the previous week, the month change is a −6.31% fall, over the last year INTEL CORP has showed a −33.45% decrease.
We've gathered analysts' opinions on INTEL CORP future price: according to them, INTC price has a max estimate of 28.30 USD and a min estimate of 14.00 USD. Watch INTC chart and read a more detailed INTEL CORP stock forecast: see what analysts think of INTEL CORP and suggest that you do with its stocks.
INTC reached its all-time high on Apr 7, 2021 with the price of 65.80 USD, and its all-time low was 18.50 USD and was reached on Apr 21, 2025. View more price dynamics on INTC chart.
See other stocks reaching their highest and lowest prices.
See other stocks reaching their highest and lowest prices.
INTC stock is 7.86% volatile and has beta coefficient of 1.67. Track INTEL CORP stock price on the chart and check out the list of the most volatile stocks — is INTEL CORP there?
Today INTEL CORP has the market capitalization of 90.21 B, it has increased by 1.00% over the last week.
Yes, you can track INTEL CORP financials in yearly and quarterly reports right on TradingView.
INTEL CORP is going to release the next earnings report on Jul 24, 2025. Keep track of upcoming events with our Earnings Calendar.
INTC earnings for the last quarter are 0.13 USD per share, whereas the estimation was 0.01 USD resulting in a 1.81 K% surprise. The estimated earnings for the next quarter are 0.02 USD per share. See more details about INTEL CORP earnings.
INTEL CORP revenue for the last quarter amounts to 12.67 B USD, despite the estimated figure of 12.30 B USD. In the next quarter, revenue is expected to reach 12.02 B USD.
INTC net income for the last quarter is −821.00 M USD, while the quarter before that showed −126.00 M USD of net income which accounts for −551.59% change. Track more INTEL CORP financial stats to get the full picture.
Yes, INTC dividends are paid quarterly. The last dividend per share was 0.13 USD. As of today, Dividend Yield (TTM)% is 2.42%. Tracking INTEL CORP dividends might help you take more informed decisions.
As of Jun 12, 2025, the company has 108.9 K employees. See our rating of the largest employees — is INTEL CORP on this list?
EBITDA measures a company's operating performance, its growth signifies an improvement in the efficiency of a company. INTEL CORP EBITDA is 7.37 B USD, and current EBITDA margin is 12.56%. See more stats in INTEL CORP financial statements.
Like other stocks, INTC shares are traded on stock exchanges, e.g. Nasdaq, Nyse, Euronext, and the easiest way to buy them is through an online stock broker. To do this, you need to open an account and follow a broker's procedures, then start trading. You can trade INTEL CORP stock right from TradingView charts — choose your broker and connect to your account.
Investing in stocks requires a comprehensive research: you should carefully study all the available data, e.g. company's financials, related news, and its technical analysis. So INTEL CORP technincal analysis shows the sell today, and its 1 week rating is sell. Since market conditions are prone to changes, it's worth looking a bit further into the future — according to the 1 month rating INTEL CORP stock shows the sell signal. See more of INTEL CORP technicals for a more comprehensive analysis.
If you're still not sure, try looking for inspiration in our curated watchlists.
If you're still not sure, try looking for inspiration in our curated watchlists.