BTCUSDU2025 trade ideas

Btc1! Btc futuresBINANCE:BTCUSDT Dominance on support level.Lets remember the targets first 80k then Btc.d hit 58 then re acc. Maybe in may or June we can hit 100k

BTC1!#BTC1! 1W
It is very possible for #Bitcoin to correct the GETTEX:39K levels to close the price gap before #Halving on the #BTC1 chart, and this level represents the cross area on the #Weekly_Interval from which it started with an upward acceleration and may return to it with a downward acceleration.
#BTC1!
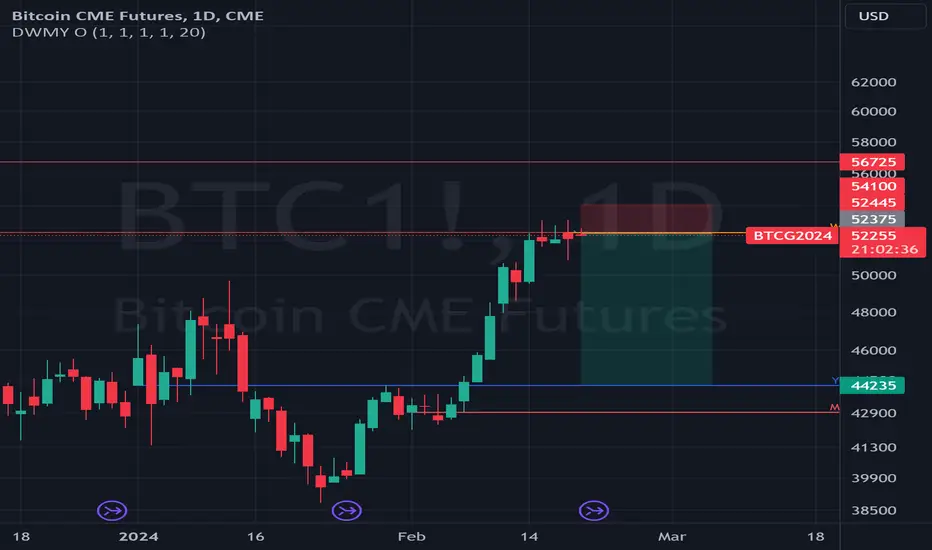
These are #BTC futures contracts on the (CMTE) Chicago Financial Derivatives Exchange.

🅱️ Bitcoin Hits New All-Time High (Timing)This would be a perfect time to start building a short position. One can start slowly and grow as confirmation comes in.
How you ease into it is completely up to you.
Timing might be good now.
This is an early call. Patience is needed.
Only hit the gas once confirmation comes in.
Wishing you good luck, success, wealth and profits.
Namaste.

Bitcoin Futures Test Major Overhead Resistance! Following the approval of the spot Bitcoin ETFs on Jan 10th, BTC futures have rallied by more than 30%. Capital inflows have remained consistent in these ETFs, supporting higher Spot and Futures prices.
The Decoupling:
The new demand brought by the approval of the Spot ETFs have given both retail, and institutional investors the opportunity to add exposure to BTC in diversified investment portfolios. Prices have managed to go higher, despite higher treasury yields and real interest rates. Interest rate cut expectations have also been reduced, yet BTF futures have rallied.
We are witnessing a decoupling of macroeconomic influences on BTC futures. Despite the fact that financial conditions are tighter, this speculative risk asset continues to rally. This is very supportive of prices in the near term, and a sign that demand for exposure to “digital gold” is real.
Technicals:
From a technical perspective, BTC futures gapped higher on 2/28. This will serve as major support in the near term, and prices could correct if we were to break and close below the gap. To break all time highs, we will need to break and close above the major overhead resistance level of $68,300-$69,500.
Check out CME Group real-time data plans available on TradingView here: www.tradingview.com
Disclaimers:
CME Real-time Market Data help identify trading set-ups and express my market views. If you have futures in your trading portfolio, you can check out on CME Group data plans available that suit your trading needs www.tradingview.com
*Trade ideas cited above are for illustration only, as an integral part of a case study to demonstrate the fundamental concepts in risk management under the market scenarios being discussed. They shall not be construed as investment recommendations or advice. Nor are they used to promote any specific products, or services.
Futures trading involves substantial risk of loss and may not be suitable for all investors. Trading advice is based on information taken from trade and statistical services and other sources Blue Line Futures, LLC believes are reliable. We do not guarantee that such information is accurate or complete and it should not be relied upon as such. Trading advice reflects our good faith judgment at a specific time and is subject to change without notice. There is no guarantee that the advice we give will result in profitable trades. All trading decisions will be made by the account holder. Past performance is not necessarily indicative of future results.


Bitcoin to the MoonLook with open eyes
Everything is repeated once more
Just hold and enjoy
GoodLuck

After Bitcoin’s Stunning Rally. What Next?Bitcoin is surging through expectations defying rally. Bitcoin (“BTC”) stands 22% higher over the last seven days. At its highest on 28 Feb 2024, BTC at USD 64k was 7% shy of its all-time-high.
Recent bitcoin (“BTC”) performance harkens back to the euphoric bull runs. Market metrics signal more steam in store.
This note discusses BTC’s recent rally and the road ahead. Anticipating short-term consolidation, this paper posits a short position in BTC/ETH ratio.
BITCOIN RALLY HAS MORE IN STORE
BTC is soaring fuelled by a range of tailwinds including strong demand from newly listed spot BTC ETFs, expected BTC halving, and a broader crypto market rally.
1. On-chain metrics do not signal significant profit taking (yet). Long-term holders have shown resilience despite significant gains in their holdings. Unrealized gains can be inferred by the market-value-to-realised-value (“MVRV”) indicator . MVRV assesses the market capitalization of BTC relative to its realized capitalization. It is determined by the price at which coins were last traded.
Current MVRV of 2.5x indicates that the current BTC prices are >2.5x the price at which coins last moved. Despite this, BTC supply that has remained unmoved in the past one year has remained surprisingly resilient. Supply not moved in more than a year is down 3.75% over the past three months while prices have rallied 53% and MVRV has remained >2x.
During previous cycles, particularly, when price peaked, MVRV was closer to three times, profit taking rates were high causing physical BTC to change hands rapidly. Current conditions do not match previous drawdowns suggesting potential for consolidation limiting further gains. Past performance does not necessarily imply future trends.
Current exchange inflows are near record highs. A substantial portion of these is from short-term holders rather than long-term holders.
Source: Glassnode
2. Continued spot buying as well as strong ETF demand. ETF demand shows no signs of slowing. Since putting our last paper on 26th Feb , an additional USD 2.3B of inflows have surged into spot ETFs. The pace of daily net flows to ETFs reached its highest level to date on 29th Feb.
Demand remains so solid that NASDAQ:IBIT became the fastest ETF to reach USD 10 billion in AUM, just 51 days after launch. Fidelity’s AMEX:FBTC is not far behind at USD 6.2 billion in AUM. GBTC outflows have continued but the pace of inflows has not reached those seen at the beginning.
In addition to fund flows, traded volumes have also remained elevated. BTC ETF volumes reached USD 11 billion on 28th Feb when prices soared above USD 60k for the first time. Volume on ETFs was particularly high when price rallied to its peak of USD 64k.
3. Funding rates and options smile . Funding rates on BTC perpetual futures signal elevated levels of speculative bullish demand. Funding rates are at levels observed during past bull runs.
Options markets are also pricing in further upside after last week. BTC options volatility curve of BTCH24 (March 2024) has shown a far higher forward skew compared to prior week. This is indicative of higher price for calls (bullishness) compared to puts (bearishness).
Source: QuikStrike
Call/Put skew over the past month shows that skew for calls have started to expand once more following sharp rally above USD 60k on 28th Feb.
Source: QuikStrike
BITCOIN NOW FACES RESISTANCE
Source: Coinglass
BTC market suffered large liquidations following sharp rally on 28th Feb. Liquidations were spread across both longs and shorts, but overall short liquidations were higher.
Across two more periods when price failed to surpass USD 63k definitively, long positions were liquidated once more. Still, since then liquidations have been much smaller than the peak.
Price remains rangebound after crossing USD 60k. It faced resistance crossing past USD 65k and maintained support above USD 60k.
BTC-ETH SPREAD LIKELY TO RALLY
BTC rallies typically precede ETH rallies as described before . Since that paper was published, the spread is merely 4% lower. The spread remains elevated relative to historical levels.
ETH has its unique tailwinds pushing it higher independent of BTC and the broader crypto market. Higher ETH burn due to greater on-chain activity is reducing ETH supply.
Moreover, decisions on spot ETH ETFs are expected by May 2024. While the final decision remains uncertain, the approaching deadline is likely to fuel bullish sentiments.
HYPOTHETICAL TRADE SETUP
BTC price is sharply higher and close to its previous all-time-high. Tailwinds for BTC remain intact. It faces near-term price consolidation following the sharp rally.
BTC price consolidation will favour ETH in BTC/ETH spread. ETH outperformed BTC during periods of consolidation in the past.
A spread position comprising of long Micro ETH futures and short Micro BTC futures allows investors to gain exposure to this trend with a 50% margin offset.
Micro ETH futures offer exposure to 0.1ETH and Micro BTC futures provide exposure to 0.1BTC. Thus, eighteen contracts of METH2024 are required to match notional for one contract of MBTH2024.
The below hypothetical trade setup offers a reward-to-risk ratio of 1.8x:
• Entry: 18.35
• Target: 16.87
• Stop Loss: 19.50
• Profit at Target: USD 5,255 (+8.1%)
• Loss at Stop: USD 4,025 (-6.2%)
• Reward to Risk: 1.3x
MARKET DATA
CME Real-time Market Data helps identify trading set-ups and express market views better. If you have futures in your trading portfolio, you can check out on CME Group data plans available that suit your trading needs www.tradingview.com
DISCLAIMER
This case study is for educational purposes only and does not constitute investment recommendations or advice. Nor are they used to promote any specific products, or services.
Trading or investment ideas cited here are for illustration only, as an integral part of a case study to demonstrate the fundamental concepts in risk management or trading under the market scenarios being discussed. Please read the FULL DISCLAIMER the link to which is provided in our profile description.


Why all economists were wrong ? - Storytelling In the fading light of November 2022, a gloomy shadow loomed over the realm of economics. Pessimism blanketed the landscape like a heavy fog, stifling optimism and strangling hope. The majority of economists, revered for their astuteness and foresight, found themselves perplexed and uncertain. In a world where certainty had once reigned supreme, doubt had now taken its throne.
Economists were not feeling optimistic. People who liked cryptocurrency waited for prices to drop to $10k before buying. Some bought when prices were low but sold cautiously when they reached 25K . Others decided to sell half of what they had to avoid losing too much money and keep cash for lower prices. On social media and TV shows, some economists were saying scary things like there might be a war or prices might go up too much , scaring people even more.
Meanwhile, accumulation quietly began as the market lacked steam.
Towards the end of 2023, prices suddenly went up a lot. Even then, some people thought it was just a small correction and that the fall was near. But as prices kept going up, more and more people started feeling hopeful about cryptocurrency.
And so, the cycle repeated itself, a timeless dance between fear and greed, uncertainty and hope. For in the ever-shifting sands of the economic landscape, one thing remained certain: the only constant was change itself. And in the end, it was not the economists who were proven wrong, but rather the limitations of human perception and understanding.

🅱️ Bitcoin CME Futures 1h: Bear Volume ($29,845 Next)When Bitcoin produced the highest volume in months on 9-Jan. 2024, on the 1h timeframe, it signaled the start of a strong retrace.
The highest volume in months came in 9-Jan. but the highest this year came in 11-Jan. 2024.
➖ Bitcoin moved from a high of 47,460 to a low of 38,540, a 22% drop.
On the 28th of February 2024 at 13:00 Bitcoin produced the highest bearish volume bar on the 1h timeframe since 8-November 2022. Making this session the most bearish in years.
There is another high bear volume session only a few hours later that is only matched by 3-4 sessions in a period of almost two years.
As soon as this strong bear pressure came in, price action patterns changed completely and the more than one month long rising trend behaviour changed.
This signal is telling me that Bitcoin's strong rise is coming to an end.
👉 The correction low should end between the 25,640 to 34,050 price range.
Thank you for reading.
Namaste.


Silicon Valley's Lab RatCrypto is an experiment. A new way for illegal payments to be more accessible to the masses.
Decentralization is a fancy way of saying that Bitcoin is digital black money. Black is the color banks are allergic to.
Is Bitcoin strong enough to battle against Banks?
To follow its paradigm, 23 thousand more coins have been opportunistically created. Each one of them attempts to get a piece of the black market pie.
There is no law that forces Bitcoin to be an ever-growing commodity. There is no law that forces it to go to waste. The only law behind it is supply and demand. And if you have been paying attention, we haven't had much supply up here...
If you want this coin to grow further, you must see where the majority of buyers are at. In this case, the buyers are quite lower. Now we are in a zone where the excitement of a Bitcoin ETF is clouding your judgement. If you clear your mind, you will realize that we are in the same story over and over again. An eternal attempt to trap buyers and sellers in the wrong place.
The main chart calculates an extremely simple quantity: How much more expensive is the next contract than the current one? This is one of the ways to calculate bullishness/bearishness in market. Now it is in an all-time high. In similar levels to March of 2021. And boy this is bad news.
Notice a similarity???
Let me explain further...
No words need be spoken. A classic redistribution pattern appears in both cases. And the pattern is eerily similar.
In the end, it is déjà vu.
Further analysis:
Human psychology is independent of instrument or timeframe.
Déjà vu, over and over and over again...
Bitcoin may be Silicon Valley's Lab Rat. Don't be Bitcoin's Lab Rat.
A serious trader must be neither excited nor fearful.
Tread lightly, for this is hallowed ground.
-Father Grigori

BTC Bullish FlagOn the 4H chart we can see that the BTC is moving in a bullish flag pattern, so soon we can see the break-out, but be careful because we also can see that the volumes are descending, so this can be a manipulative movement and very fast!
IMPORTANT! Always follow the RM strategy while trading!


BITCOIN BEFORE THE HALVING
My logarithmic to daily 4hr charts is here! we might see 57-58k as I predicted my previous post, this valid once price keep pushing upto 55000 level zone.
If this is a distributions we might not see 55000 level, see the arrow .
But for my view price might test that 57-58000 level before incoming month of march.
Im expecting a month of upside before the halving and I will be updating this idea once this complete.
The second arrow is Small distribution after those upthrust moves of price at 53000 level.
The other arrow is for the higher context of distributing its price on higher supply at 57-58000 level. this moves might goes a higher EUphoria level same on the 64-69000 last time.
so becareful alway buy low and stack harder!
Follow for more!

BTC LONG Speculation, no major corrections until 75k-80k?Since the ETF, it seems to have been a sell the news, followed by buying the dip event at the 100D MA.
Dips since the start of the bull run, even before the launch of the BTC ETF, have averaged ~20% followed by a continued massive bull run. Some, including myself, speculated a break of this trend of 20% dips (breaking 38k) followed by a continued sell-off into 34k or even 30k. The ETF launch was a perfect event to sell along with outflows from the GBTC takeover until recently.
Assuming this pattern of 100% returns after a 20% dip, technically BTC can reach ~80k. Considering the shortened duration to reach such returns, we may reach 80k sooner than expected in this cycle.
Note that we have recently (in the past few weeks) broken a multi-cycle trendline that acted as resistance roughly two months before the FTX collapse. So it could validate prices rising on top of ETF inflows increasing. Note that upon reaching 74k-80k, it is likely a significant pullback within 30k-40k will occur, given the lack of test of structure that BTC normally does pre-halving.
This idea is invalidated with a daily close under 49.5k. Closing over 59k will likely have the rally continue toward 74k, with any price beyond it being risky to hold without selling, likely maxing out at 80k roughly the end of March. Closing under 44k would be bearish enough to consider going to 30k.
Overall, this idea is very speculative and assumes a trend continuation that breaks BTC's normal patterns/expectations of price movement. Upward price movement is 34%-44% toward 74k and 80k, with a downward price movement of 42+% toward 31k, so entering now is dabbling more in the middle, slightly favoring bears in the long run. This is likely all that's left for BTC to continue the rally past ATHs assuming it can hold 50k before a significant correction. You could even argue of strong resistance ~57k-59k, but inflows are too strong, as is the narrative of RWA and the Tokenization of Financial Assets .
Be weary that there are still other risks (cyber pandemic, bank runs, civil unrest, real estate, labor market participation/retraining, shipping routes in the Middle East, control of rare earth minerals/semiconductors) that have been deferred thanks to speculation/attention of tech around AI, and may conveniently come back. I'm not sure when, but I'd speculate starting the second half of 2025 to 2026.
Trades:
Long 55k
SL 49.5k
TP 74k (close or by the end of March)
Short 77k
SL 85k
TP 60k, 45k, 35k (close)

Cme chart predicting btc future?The btc futures chart is revealing a lot of what’s to come for btc? Lots of traders had bearish charts and are probably not aware of the price action going on behind the scenes.

Bitcoin to continue outshining Gold In 2024Bitcoin (“BTC”) – the millennial gold - continues to outshine traditional gold. BTC prices have climbed higher after the listing of spot ETFs. A wider bull rally in the cryptocurrency markets is also underway. ETH touched its highest level since 2022. The total cryptocurrency market cap is 14% higher YTD.
A diverging outlook between BTC and Gold is emerging. After reaching all-time-high in December 2023, gold prices have pulled back this year. Stronger dollar fuelled by delayed rate cut expectations are taking shine off gold.
Halving event and bullishness from spot ETFs make for shining prospects ahead for BTC. In sharp contrast, macro backdrop dragging gold down leading to potentially lacklustre price performance. Collectively, this makes for a compelling spread positioning comprising long BTC and short Gold.
BTC RALLY HAS MORE STEAM
BTC is 12% higher YTD. It has marched higher with solid momentum post the spot ETF launch. Multiple factors point to further gains in store. For one, sustained net inflows to spot ETFs signal strong demand from US investors for BTC.
Volumes in spot ETFs reached its highest level since its launch on 21 February 2024. Participation was broad across several investors with 32,000 individual trades (sixty times the average), indicating widespread demand across investors.
BTC halving is due in a little less than a month, fuelling additional bullish sentiment. Lower supply of newly mined coins is expected to drive prices even higher.
BTC is currently trading 15% below its production cost, calculated by Capriole Investment using power consumption figures from the Cambridge Bitcoin Electricity Consumption Index . This index has served as a strong price floor over several years. Miners are unlikely to sell their BTC holdings below their cost of production, consequently reducing selling pressure below this key support level.
While BTC production cost acts as an indicative support level, BTC may continue to trade below this level. For one, miners have built up BTC holdings over the past year, which they can opt to sell for a substantial profit below the new production cost.
The surge in BTC over 2023 has started to spill over to other digital assets. A broader digital asset rally is under play with ETH retesting its highest level since 2022 this month.
The potential for further appreciation in BTC is high if markets are currently at the cusp of a wider crypto rally.
Finally, traders have been avoiding substantial short positions. As Bitfinex highlighted , the short-squeeze ratio is lower this year, compared to previous years which suggests large whale investors have not been taking substantial short positions.
However, institutional positioning in CME BTC futures paints a contrasting picture. Asset managers have built up record long positioning while leveraged funds have built up record short positioning on CME BTC futures.
DELAYED RATE CUTS TAKING SHINE OFF GOLD
Delayed rate cut expectations have led to a resurgence in the dollar causing a pull-back in gold prices.
Gold faces a double whammy in terms of asset rotation as both equities and the dollar remain strong.
RECESSION IS OFF THE CARDS
Mint Finance described gold performance during recessions and soft-landings in a previous paper . In summary, while gold prices rally sharply during recessions, performance is flat during soft landings, a situation where inflation subsides, and economic growth remains resilient. Over the past two soft landings, gold delivered flat returns.
While a soft landing is yet to be realized as both inflation and rate outlook for 2024 remains uncertain, a recession in the US has become a remote possibility. In fact, the Consumer Board has abandoned its long-running call for a recession in the US.
Consumer Board’s (“CB”) Leading Economic Indicator (LEI) signals turning points in business cycles and near term economic outlook. Since July 2022, the LEI signalled a US recession with the LEI in decline.
LEI fell to 102.7 in January 2024, its lowest level since 2020, yet CB has stated that it no longer anticipates a recession in the US.
CB still anticipates a slowdown this year with growth expected to be near zero in Q2 and Q3. Yet several LEI components have turned positive over the last six months, including equity performance.
An overly hawkish Fed makes the much expected Fed pivot less likely, for now, but the strength in the broader economy across businesses and consumers makes a slowdown unlikely.
FUND FLOWS – TALE OF TWO ETFs
Fund flows for BTC and Gold ETFs also suggest a vastly diverging picture. Investors have responded exceedingly well to spot ETFs. Cumulative flows for spot ETFs have exceeded USD 3 billion in a month.
For reference, it took GLD - the first Gold ETF - two years to get to this point. Though, as a counterpoint, the ETF market and money supply are much larger now compared to when GLD was launched.
Net fund flows for BTC ETFs were close to zero for the first few days after launch as GBTC outflows shifted towards lower-cost ETFs. Since February, inflows to spot ETFs (excluding GBTC) have accelerated while GBTC outflows have slowed. The result is sharp growth in net inflows suggesting strong and positive investor response to spot ETFs.
Data Source: TradingView and ETFDB
While BTC Spot ETFs has been enjoying consistent net inflows, Gold ETFs have been awash with fund withdrawals and redemptions.
Data Source: TradingView
Contrasting cumulative net flows into BTC ETFs & Gold ETFs shows a stark divergence in expectations ahead for the price of these two similar assets.
Data Source: TradingView and ETFDB
Outflows from gold ETF’s represent asset rotation out of gold with some of those assets going towards equities and bonds.
HYPOTHETICAL TRADE SETUP
An unfavorable macro outlook is weighing on gold while BTC faces a positive outlook with tailwinds likely to push prices higher. A position combining a long position in BTC and a short position in Gold benefits from both rising BTC and falling gold prices.
This spread does not compromise on performance as past rallies have yielded similar performance in the BTC/Gold ratio. BTC/Gold spread has not been an effective hedge as the ratio does not perform better during downturns.
A hypothetical spread trade consists of long four lots of Micro Bitcoin futures (MBTH2024) and short one lot of Micro Gold futures (MGCJ2024).
This position requires margin of 4 x USD 1,120 (=USD 4,480) on the BTC leg and USD 830 on the gold leg:
• Entry: 25.32
• Target: 30.60
• Stop Loss: 21.30
• Profit at Target: USD 4,310
• Loss at Stop: USD 3,285
• Reward/Risk: 1.3x
MARKET DATA
CME Real-time Market Data helps identify trading set-ups and express market views better. If you have futures in your trading portfolio, you can check out on CME Group data plans available that suit your trading needs www.tradingview.com
DISCLAIMER
This case study is for educational purposes only and does not constitute investment recommendations or advice. Nor are they used to promote any specific products, or services.
Trading or investment ideas cited here are for illustration only, as an integral part of a case study to demonstrate the fundamental concepts in risk management or trading under the market scenarios being discussed. Please read the FULL DISCLAIMER the link to which is provided in our profile description.

" BITCOIN " is getting ready !hello theres i see The countdown to the tsunami has begun for Bitcoin, anyone who is still holding the trade , I advise you to close immediately !
CME:BTC1!

BTC Bitcoin Futures
tight consolidation after a breakout of Feb Value Area
Price Target 61,560 ,+18% to go to upside VPOC using the MarketWebs technical trading system