Bitcoin Under Pressure but Eyeing BreakoutThe market remains bullish, but the price has been strongly rejected multiple times in the
108.980 – 108.085 zone. We'll have to see how it reacts.
In my view, Bitcoin appears to be setting up to break through the resistance zone between 114.130 and 109.520. If it manages to break above, we could
Related futures

Chart Pattern Analysis Of Bitcoin
K5 close below K2,
It verified the resistance or the bear gap at K2.
It seems that the following candles will fall to test 0.382-0.5fib area.
I will try to buy it there.
I don’t think the three years bull market will be terminated here,
I am expecting another bull run to test or break up the resis

Mastering Bitcoin Trends with the 55-Week Moving AverageMastering Bitcoin Trends with the 55-Week Moving Average: A KISS Approach to Trading
I want to emphasize the KISS principle—and provide an example of using the 55-week moving average (MA) on the Bitcoin chart. This is a great demonstration of how simple tools, when applied with consistency and insig

BITCOIN (BTC) Analysis For The WeekI've been studying BTC and others and want to share my analysis. Trading involves probabilities, so it's essential to be confident and prepared. Study the market thoroughly before trading with real money.
Let's test strategies this week. You may use a live account if you have capital, and manage you

Bitcoin Symmetrical Triangle & another pattern formingBTC is currently trading in a Symmetrical Triangle formation.
This is generally a continuation pattern.
There's also a longer term BTC pattern FORMING.
Do you see it?
Inverse Head & Shoulder.
But it is a ways off, time will tell.
Bitcoin Crypto

Chart Pattern Analysis Of Bitcoin
There are 4-5 candles consolidate around the resistance,
And the demands keep decreasing.
Compared to K3,
the demand at K4 increased, but it failed to close upon K3.
If K5 is a doji candle close at low price area,
Or,If K5 starts with a bear gap to close below K4,
It is likely that the following

BTC CMECRYPTOCAP:BTC CME :
If it couldn't break the channel it will be drop to 95k or fib 0.382.
so it's better to be careful guys.

BTC short term I expect to see the retest of the highlighted area such as the 100k$ level, where we left the closest imbalance unfilled after taking the highs and not spooling higher, I assume we receive some kind of distribution during the summer in the range from ATH to the marked levels, after which we would ha

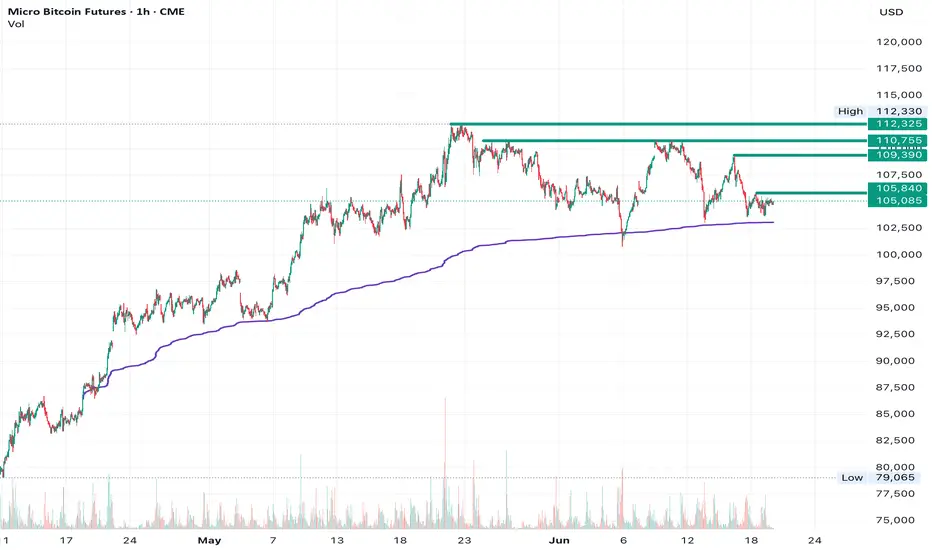
MBT! - Risk reward in favour for longs!After taking continuous supports from AVWAP there is bullish bias in Bitcoin. We remain in a higher high, higher low structure on every time frame from D to H1. Each pivot breakout(marked in green) will be opportunity to add more to your positions.
BTC 2H#BTC
All Eyes on the CME Gap: $101,390 – $100,880 📉
Given the heightened geopolitical tensions between Iran and Israel, market volatility remains elevated.
🎯 There’s a strong probability this gap will be filled.
⚠️ Trade cautiously and always use a stop-loss to protect your capital.

See all ideas
A representation of what an asset is worth today and what the market thinks it will be worth in the future.
Displays a symbol's price movements over previous years to identify recurring trends.