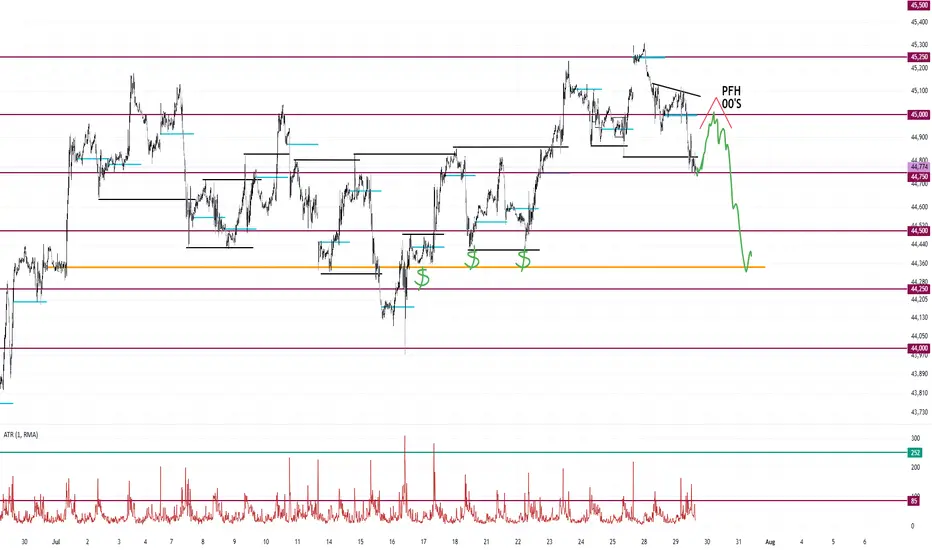
Mean Reversion Around 250. Buy at 00's and Sell 500I can see price mean reversion around 250. Therefore, buy the lows and sell the highs.
500 as resistance and 00's as support.
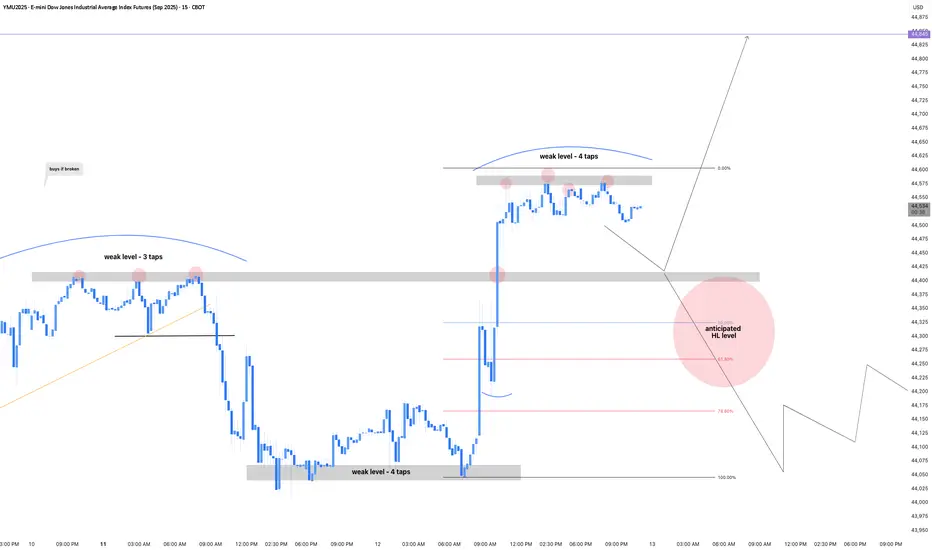
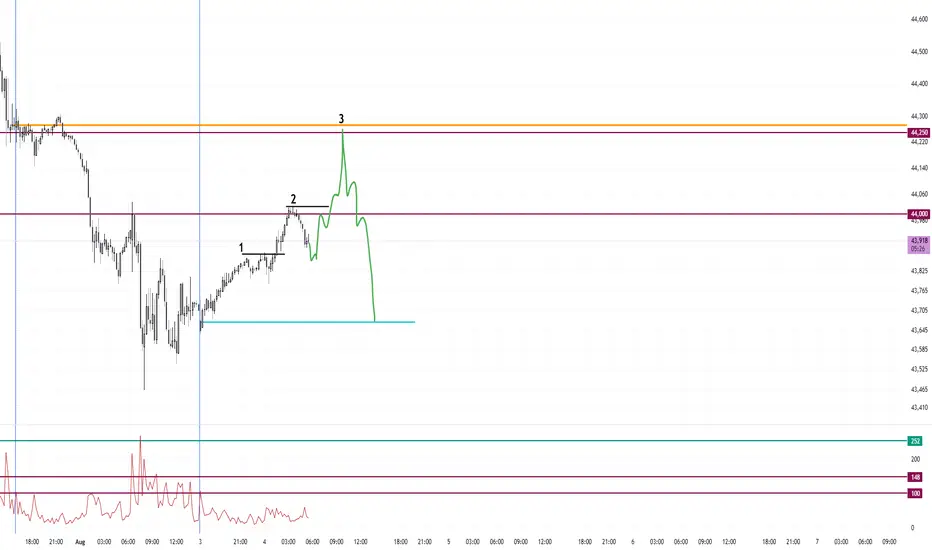
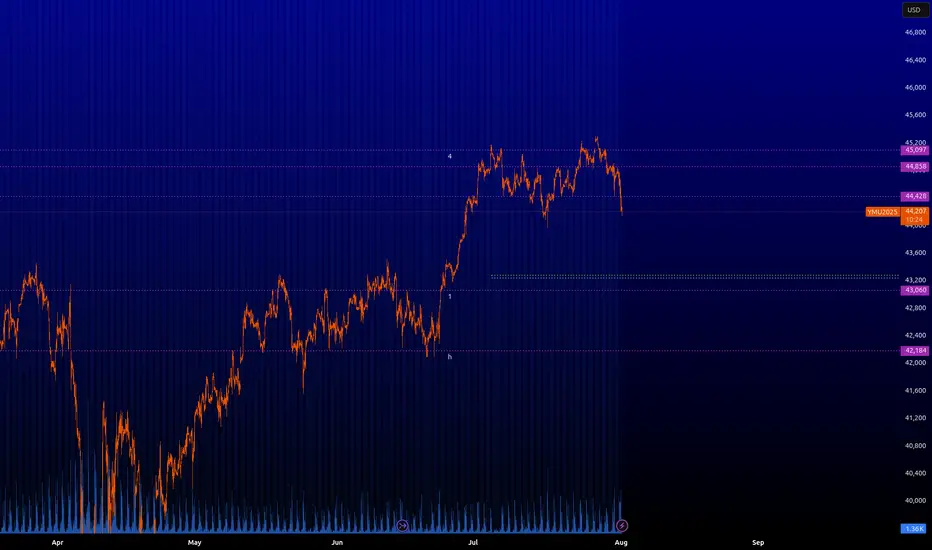
So far, the peak formation is at the low of August, therefore, the trend is bullish.
I am expecting a run of the high then a dump to 44,000 before the continuation of th
Related futures
YMUjust a play idea that could happen.
remember, the market will do what it wants.
i trade price action; utilizing pivots and sessions indicators
my charts are alot less messy when im trading
overall, i see bullish for YMU but anticipating a possibly deep pullback.
thoughts on this idea?
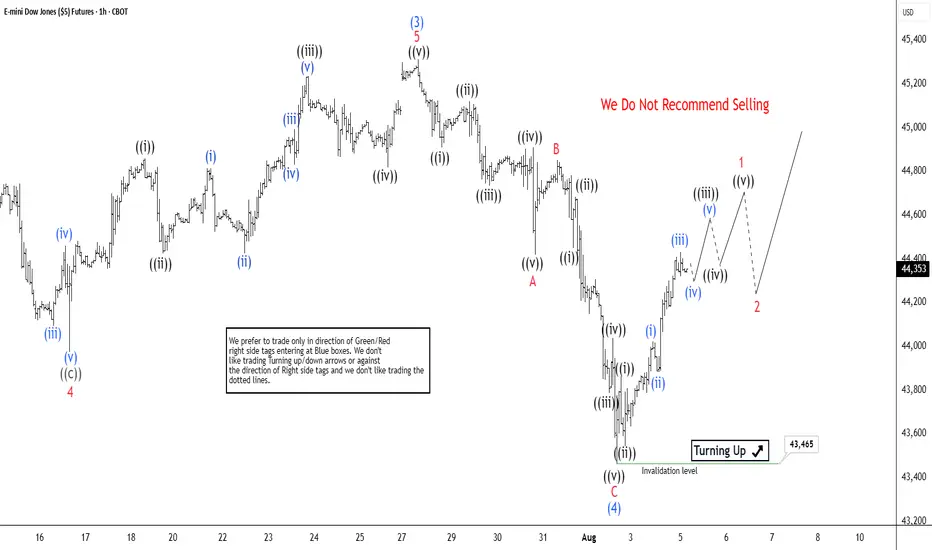
Dow Futures (YM) Nearing Final Push Before Significant RetreatThe Dow Futures (YM) cycle, initiated from the April 2025 low, has reached a mature phase and could conclude soon. We anticipate one final push higher to complete the impulsive cycle from that low. As shown on the one-hour chart, wave (3) of this impulse peaked at 45,312. The subsequent wave (4) pul
YM : Short levelThe level has been activated, so you can short it. I have slightly edited it since last time. It is best to scalp or pip it; I cannot promise any significant movement. Be careful when trading on news or at market close/open.
Monday Three Session Pump and Dump Sell DayI will be waiting for around an hour or so after NY opens to pump up into the monthly open and 250 level for the dump back down to the daily open
My bias for the next two weeks are bearish.
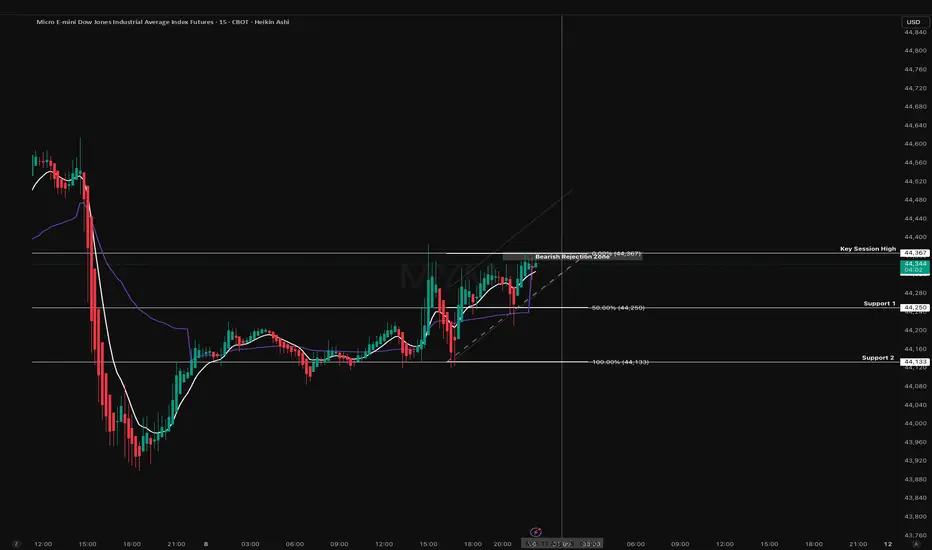
MYM Tokyo Open Battle Line: 44,367 Under SiegeHeading into the Tokyo open on MYM, price is pressing against the 44,367 resistance a level that has now rejected twice intraday.
From a structural standpoint, we’re trading within a rising short-term trend line, but momentum into this high has been relatively shallow, suggesting a potential fade
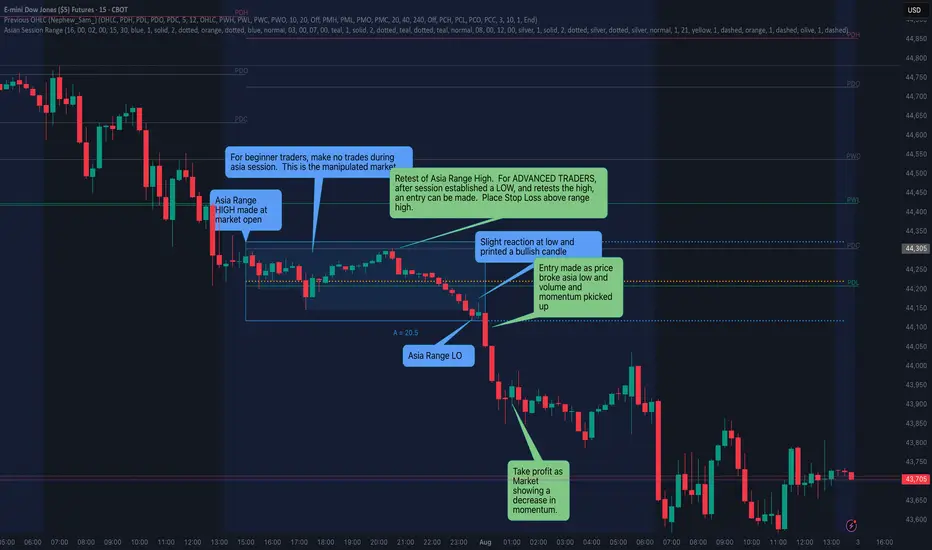
Asia Range Breakout - The trap and the entryDescription:
This chart illustrates a textbook Asia Session Range breakout, highlighting both the manipulative trap and the ideal entry based on the SquawkTradeFX strategy.
🔹 Asia Session Range (Grey Box):
This tight consolidation forms overnight during the Asia session.
Price oscillates within a n
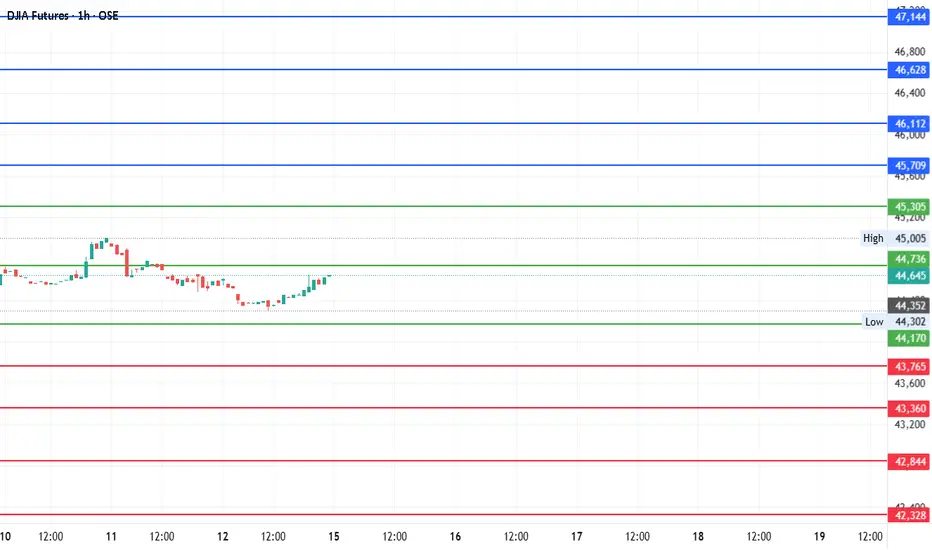
#DJI Futures Outlook: Key Levels to Watch Around Pivot 44,736Date: 14-07-2025
📊 Current Price: 44,645
📍 Pivot Point: 44,736.00
🔼 Upside / Bullish Scenario
If the price sustains above the pivot point (44,736), it could target the following resistance and bullish targets:
Immediate Resistance: 45,305.40
Target 1: 45,708.70
Target 2: 46,112.00
Target 3: 46
YM : Key levelsHere are the key levels that the market will be interested in. From the green zone it is ideal to look for longs. As it will be possible to enter somewhere by limitation and take some profit, I will inform you.
⚠️ VOLATILITY WARNING ⚠️
Trading around major news can be extremely unpredictable. Tra
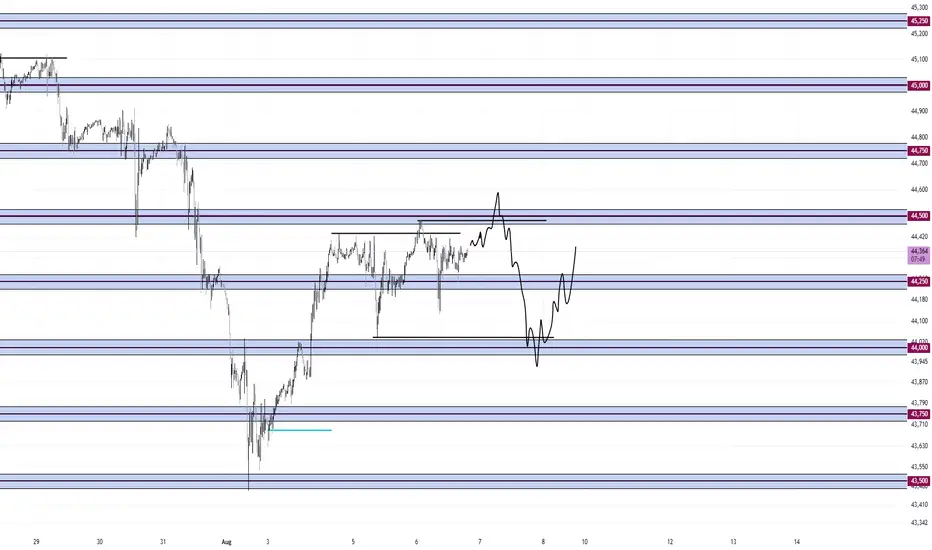
Peak Formation High Into Double Zero's Dump to Monthly OpenLooking for a peak formation high to form under the double zeros.
The market is most likely targeting the liquidity sitting around the monthly open.
I don't see any support until the market takes out some of these lows. Maybe at 44,250.
Highlighted in red brush is every peak formation high form
See all ideas
A representation of what an asset is worth today and what the market thinks it will be worth in the future.
Displays a symbol's price movements over previous years to identify recurring trends.
Frequently Asked Questions
The nearest expiration date for E-mini Dow Jones Industrial Average Index Futures (Mar 2019) is Mar 15, 2019.
Traders prefer to sell futures contracts when they've already made money on the investment, but still have plenty of time left before the expiration date. Thus, many consider it a good option to sell E-mini Dow Jones Industrial Average Index Futures (Mar 2019) before Mar 15, 2019.