The Gold Retrace for Ultimate Entry!looking for price to continue with its pullback to find where exactly support is. Once we see price establish support we should get some type of signal for entry and price can continue with this bullish price action to make new highs. If we get a full 71.8% pullback that should make for a nice bull run. Just need to wait for the confirmations first before reacting cause we might get a lot of chop until then.
GCQ2016 trade ideas

Gold and DXY. Day before CPI 14.07.2025, MondayExplaining about the thoughts on CPI. Expect major movements on GOLD

Twitter Speculation sent Gold FLIP Floppin!So yesterday there was a few Tweets that caused chaos in the market. Fed Rumors about Powell getting fired. Im still looking for my long. Waiting for a sweep on levels before getting active.


Gold LongsFollowing last weeks bias. Looking for REQH target.
Want to pair longs with a weekly profile. Ideally Monday or Tuesday creates the low of week. Will look to get onside with longs once theres a clear intraweek reversal. Trade the continuation higher. A close below 3320 is invalidation. Expecting previous week low to be protected and expansion to the upside

Gold is Setting up for another moveLooking for price to make some impulsive moves before we get active. Looking like they are trying to establish a low for the week before they go full on bullish. waiting for them to find that bottom.

This is a good video7.14 . 25 this is a great video because there are so many examples of patterns to look at and there weren't that many markets that I was following and about 3 or 4 of the markets actually had dramatic movement in the direction you would expect and this is an example of setting up your pattern and letting the pattern take care of you as it gives you the probable Direction the market would take and there would have been no significant drawdowns or retest associated with stops... As was seeing in the coffee Market.

Shorting Gold again and againYep, Iam still thinking that gold should be shorted. Even though that i can see there is some huge liquidity up which should draw the money to it, but still on bigger timeframes, it shows weakness.
So here it is with targets. hopefully it goes through.
Good luck everyone.
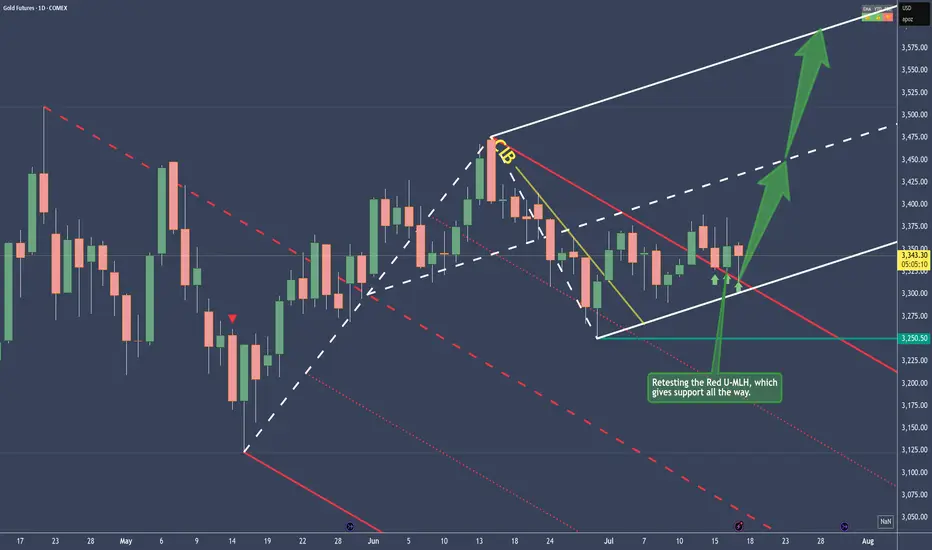
Gold - Bullish and here's whyPrice traveled within the Red Fork, until it broke the CIB Line, which is indicating a Change In Behavior.
From there on, sideways action, until the break of the Red U-MLH happened.
After the close above the Red U-MLH, price has tested it the 3rd time now. At the time of writing, the Bar looks like a PinBar. So it has good sepparation from the bottom, or a long Down-Wick. That's indicates good strenght.
To me this looks like a good long trade, but as everytime, play it save and don't let greed eat your brain ;-)
New Week on Gold! Will the Bullishness continue?I was bullish on gold and price ended up doing as expected last week and looking for it to continue this week. But i have to sit on hands for now to see how they want to play Monday. Will they move to create a Low for the week first? or will they break out to start early on new highs? I have to see some type of confirmation first. Then we can get active.

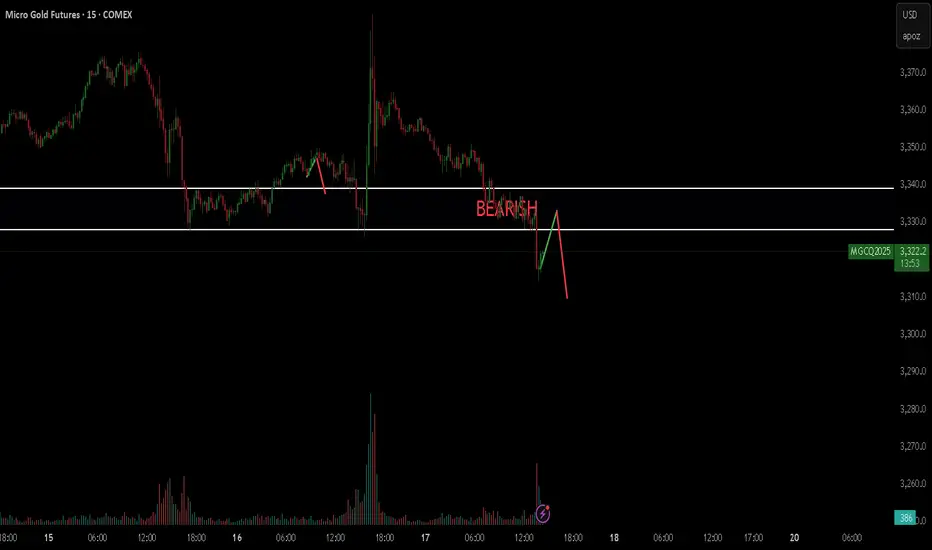
Shoring GoldSo here we go again with gold.
there are two theories at this point, a bullish case and a bearish case.
The bullish case that the price broke a bearish trend and moving upwards.
For a bearish case, the price didn't close that strong above the last swing. Also the whole structure is bearish so this last up move could be very well a trap for buyers.
On the 4h tf, there is an FVG, bearish one that the price so far is reacting to.
So Even though there is a strong up move, i still lean bearish.
Later today once i get a confirmation, i will update the idea.
I might be very wrong on this trade, my confidence in this trade is 4 out of 10. So Use smaller size position.
Also iam expecting the price to revisit 3320 USD

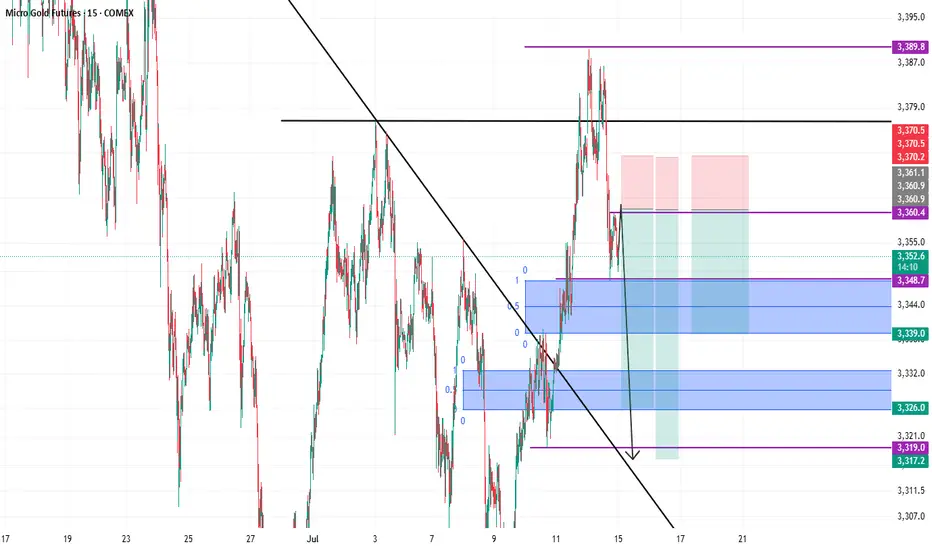
GOLD TRADING IDEA FOR 14-18 JULY 2025The price of Gold currently at the H4 liquidity control area at 3376. It's seem like there candlestick H4 rejection at that area but still not valid for market structure shift direction.
If the candlestick breakout above at H4 liquidity control ,I will looking opportunity for long position with target at next H4 liquidity control at 3390 or extension target at 3410.
short term SELL
Price retracement before the price going up.
If small timeframe show market structure shift or develop bearish engulfing pattern at H1 0r m30 below 3376 . The target will be h4 liquidity control at 3354 or 3320 depend on how price act at that area.

Goldman Says $4K – My Chart Says Sell💥📉 Gold Analysis – Divergences, Resistance, and a Short Bias 🪙⚠️
Hey Traders,
As promised in the latest video, here's the official chart update for Gold – and the message is clear: I'm short.
📊 What I See on the Chart
We're now well below the 3,446 resistance, with early signs of weakness showing up across multiple timeframes. I’ve laid out both the 2-Day and 4H charts in this post, and here’s what I’m tracking:
⚠️ Technical Warning Signs:
🔻 2D chart: Six bearish divergences
– RSI, Stochastic, CCI, OBV, MFI, and MACD all flashing red
📉 1D chart: Same thing — six divergences, telling me momentum is fading
⏳ 4H chart: Price action breaking trendlines, and support at 3,237 looks shaky
🚨 If that breaks, my main support zone is at $3,000 – and that’s where I believe we’re heading.
This is not just a pullback. This is the kind of confluence you can’t ignore if you trade technically.
🔁 Sentiment Shift
Back in December '22 and again earlier this year, I was long Gold – and it was the right call. But now?
📌 This chart has gone from momentum to exhaustion.
📌 I see less demand, softer momentum, and strong bearish divergence stacking across every major timeframe I watch.
🎯 Trade View
✅ I’m short Gold.
🎯 Targeting the $3,000–3,050 zone.
📉 Invalidated if we reclaim and close above $3,446 with strength.
It’s that simple. Nothing personal – just structure, divergence, and flow.
🧠 The Chart vs. The Narrative
Recently, I saw a note from Goldman Sachs forecasting $4,000 Gold. Maybe they’re right.
But I’ll be honest with you – I don’t buy the media hype.
I'm not here for the headlines.
I'm a chart guy. Always have been. Always will be.
The chart is the map to the treasure – and that’s the only thing I follow.
🧠 I cover this and the broader macro setup (Dollar, BTC, DAX, Tech, BTC.D, and more) in the full 20-min video just dropped. If you haven’t watched it yet, go catch up — it explains the logic and why this isn’t just a gold story.
One Love,
The FXPROFESSOR 💙
Disclosure: I am happy to be part of the Trade Nation's Influencer program and receive a monthly fee for using their TradingView charts in my analysis. Awesome broker, where the trader really comes first! 🌟🤝📈

Gold. The plan for the next few days.The nearest resistance zones are where it's interesting to look for purchases. We are waiting for a reaction and looking for an entry point.
The post will be adjusted if there are any changes.
Don't forget to click on the Rocket! =)

Longing GoldWell, it does look like a good long trade in here.
My confidence is moderate in this trade.
I would say 4 out of 10, this could hit. personally iam going to take this trade but will be more cautious with the amount of contracts that i will be putting on the line.
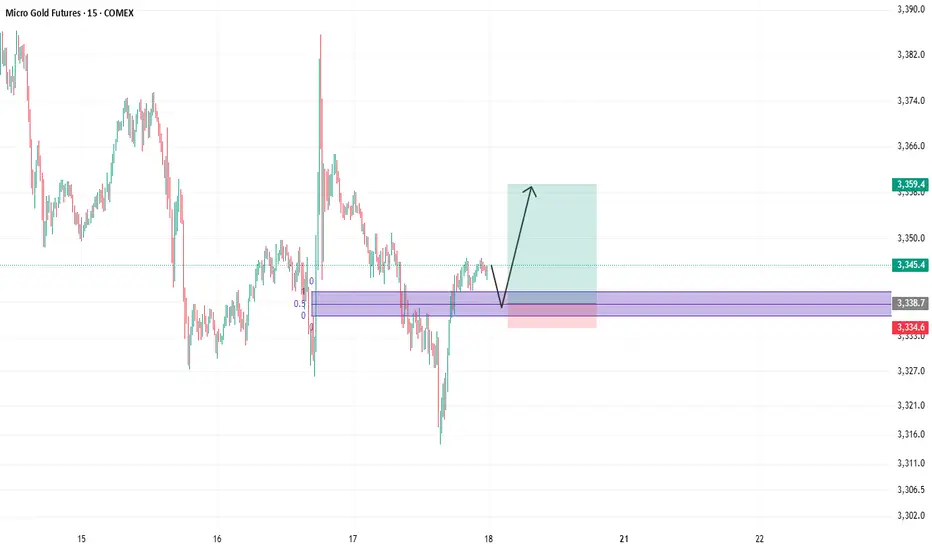
Gold Bulls Loading Up – Our Short Squeeze Trigger is Set!🚨 Gold Bulls Loading Up – Our Short Squeeze Trigger is Set!
We’re flipping the script on COMEX_MINI:MGC1! After a prolonged downtrend and textbook wedge compression, our breakout long is LIVE – but not without trapping the late shorts first.
💥 Entry: $3,312.1
🛑 Stop: $3,288.4
🎯 Target: $3,458.9
🧮 Risk/Reward: 6.19
Price just bounced at the retest of the wedge apex, and volume is confirming the move. If this holds, we’re riding momentum all the way up – and letting short pressure fuel the breakout.
📈 Trendline breached.
⏳ Time compression converging.
⚠️ If you’re still short, watch your stops!
Gold.. in the fog of global chaosNotes:
Markets for metals are at a ATH.
Global events are evolving rapidly.
Most of the time, war=raging gold prices
Markets are ripe to retrace and or maybe reverse at all. Taking setups on gold with a grain of salt.
Gold is an event driven market. I expect for now a consolidation until bearish signals show.
XAUUSD, GOLDBullish view on GOLD for New York session, Daily FVG, if price taps in will look for confirmations to go long

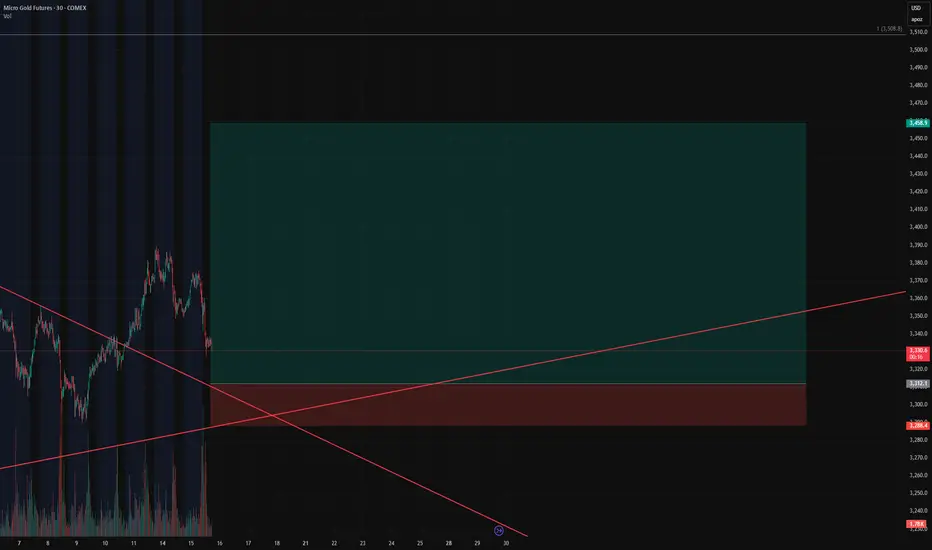
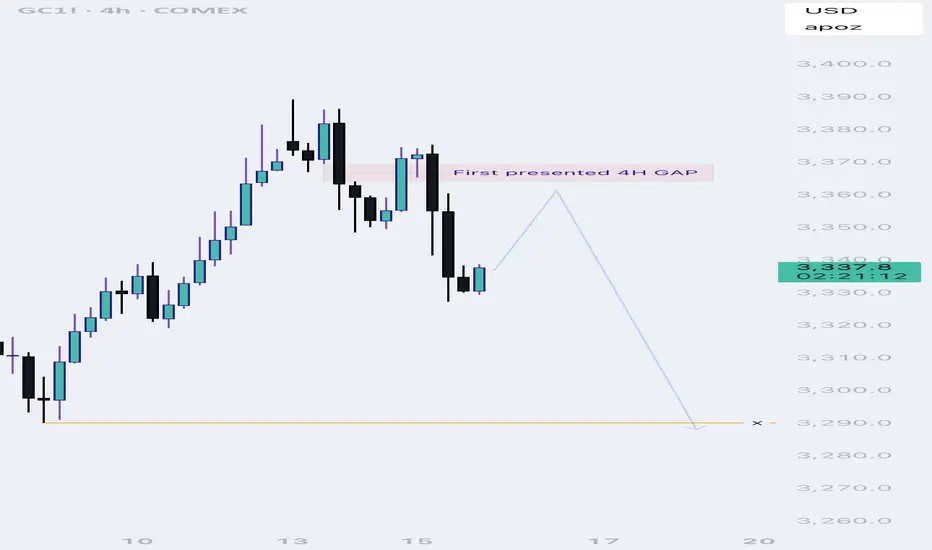
GOLD - GC | Weekly Recap & Plan 13.07.2025🟡 GOLD (GC) Weekly Recap & Outlook
Symbol: GC1!
Date: Week of July 8–12, 2025
Timeframes Used: 4H, Daily, Weekly, HTF structure
🔍 What Happened Last Week?
Gold saw a strong rejection from a confluence of two HTF trendlines, signaling resistance.
But that move was absorbed by:
🟦 Daily Demand (blue zone)
🔵 Daily Swing Liquidity (blue line)
This builds a bullish structure on the daily chart.
🧭 Scenarios I'm Watching
Scenario 1 — Minor Pullback:
🔹 Price may revisit the Daily Gap (pink line) and find support for continuation.
Scenario 2 — Deeper Pullback:
🟣 Price could retrace into the HTF bullish trendline (purple) before resuming upside.
🗞️ Bonus Macro Scenario: Powell Resignation?
There are growing rumors that Fed Chair Powell might resign this week.
📈 If that happens, I expect strong bullish momentum in Gold —
→ very limited retracement, and
→ potential straight breakout into new highs.
🎯 Targets for the Week:
✅ 1st Target:
W C DOL (purple line) → acts as a primary take profit area.
✅ 2nd Target (Expansion):
EQHs / DOL (extended purple levels)
Game Plan:
Watch for LTF confirmation on both retracement zones.
Maintain bullish bias unless Daily Demand fails.
If Powell resigns, be ready for breakout setups.

Gold. 14.07.2025. The plan for the next few days.The nearest resistance zones are where it's interesting to look for sales. It's not certain that there will be a big reversal, but I think we'll see a correction. We're waiting for a reaction and looking for an entry point.
The post will be adjusted based on any changes.
Don't forget to click on the Rocket! =)

Gold vs UNI – Is UNI in the Early Stages of AccumulationThis comparison between Gold (MGC1!) and Uniswap (UNIUSDT) on the weekly timeframe suggests that UNI could be in Phase 1 of a buy program, similar to how gold accumulated before its major breakout.
📌 Key Observations in the Chart Comparison:
PHASE 1: The Accumulation Zone (Green Highlighted Area)
Gold went through a long accumulation period (2013–2017), trading in a sideways range before its parabolic impulse leg kicked in.
UNI is currently in a similar consolidation phase, potentially in the early stages of accumulation.
The monkey face + pointing emoji suggest a "stealth phase" where most retail traders remain unaware of the underlying accumulation.
Old High & Market Structure
Gold formed a major high, crashed, and accumulated before breaking out.
UNI also reached an all-time high (~$44), crashed, and is now ranging in what looks like a potential accumulation phase.
Similar structural formation suggests UNI could be following gold’s footsteps.
Impulse Leg & Breakout Potential
Gold’s first major breakout came after a long accumulation, followed by a massive impulse move (Phase 2).
If UNI is mirroring gold, the next breakout could start the impulse leg leading to a retest of old highs and beyond.
Standard Deviation Extensions (STDVN) – Potential Price Targets
Gold reached 0.5 and 1 STDVN levels after its breakout, which became short-term targets before continuation.
If UNI follows a similar trajectory, targets could be $44.77, $64.98, and eventually $85+ if the accumulation plays out.
🔮 What This Means for UNI?
Early accumulation phase means the smart money is likely positioning.
Price compression leads to expansion—UNI could be preparing for an explosive move.
Similar to gold, UNI could break above accumulation and enter Phase 2, targeting 0.5 and 1 STDVN levels.
If UNI truly follows gold’s structure, long-term price discovery is on the table.
🚨 Lord MEDZ Trading Perspective
"Not financial advice, but let’s keep it real…"
Gold showed the exact same pattern before making a historic move. UNI is mirroring the early accumulation phase.
This is the shakeout before the breakout. Smart money is accumulating while retail panics.
Patience = Wealth. Stay ahead of the crowd.
🚀 UNI could be setting up for something massive. 🚀

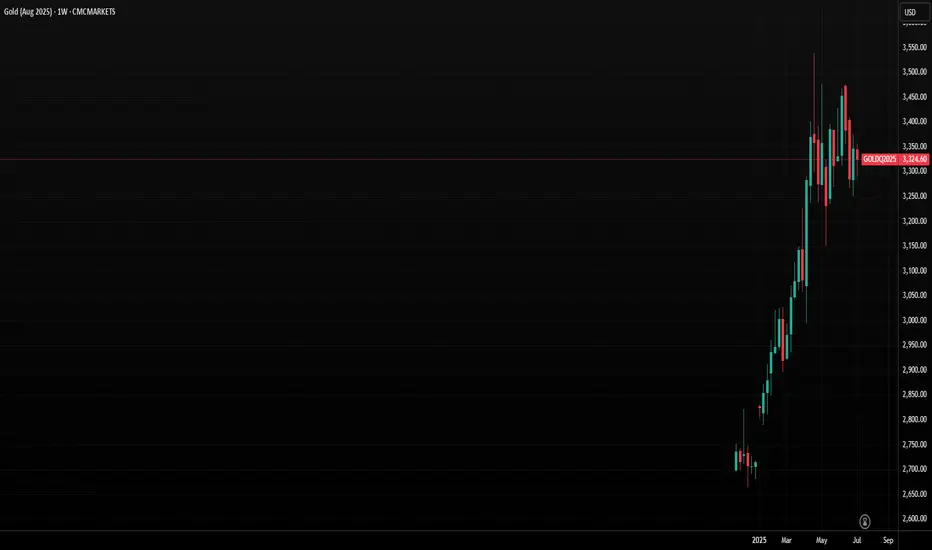
Gold at Critical Juncture as Bearish Momentum GrowsGold is showing signs of breaking down as the US dollar recovers from a steep decline. Gold and the dollar typically have an inverse relationship over the longer term. The precious metal has been trading sideways since April, but more importantly, it has been trending lower since mid-June. Gold is now approaching a critical juncture, testing an uptrend established in mid-May. Although it has previously held this support level, gold appears likely to break lower this time.
The Trend Lower Is Strengthening
The Relative Strength Index (RSI) is now trending steadily lower, forming a series of lower highs. This suggests that gold’s momentum is currently bearish, indicating potential for continued weakness in the days ahead. To reverse this bearish momentum and shift to a bullish outlook, the RSI would need to rise firmly above 50.
More significantly, gold is now very close to breaking a significant uptrend at $3,300, which was previously tested on June 27 and June 30. On both occasions, the price dipped intraday below this trendline but managed to close above it. The trendline was retested on 8 July, initially holding, but gold is dipping below this critical support level again on 9 July. A close below the trendline on July 9, followed by continued declines starting on July 10, would confirm that the uptrend has broken. This breakdown would signal further downside risk, with initial support at $3,230, followed by $3,170.
Triple Top
Perhaps even more crucially, a triple-top pattern established at the $3,400 becomes increasingly likely each time gold trends lower. The $3,170 support level is particularly significant because it forms the neckline of this triple-top pattern. A decisive break below $3,170 would confirm the triple top pattern and indicate a deeper decline, potentially targeting the range between $2,950 and $3,000.
Written by Michael J. Kramer, founder of Mott Capital Management.
Disclaimer: CMC Markets is an execution-only service provider. The material (whether or not it states any opinions) is for general information purposes only and does not take into account your personal circumstances or objectives. Nothing in this material is (or should be considered to be) financial, investment or other advice on which reliance should be placed.
No opinion given in the material constitutes a recommendation by CMC Markets or the author that any particular investment, security, transaction, or investment strategy is suitable for any specific person. The material has not been prepared in accordance with legal requirements designed to promote the independence of investment research. Although we are not specifically prevented from dealing before providing this material, we do not seek to take advantage of the material prior to its dissemination.