Long & Short Entry Forecast For GoldCooling war tensions seem to be cooling the Gold bullish rally as well.
But we're still in the same range since April 15th and will likely stay in the range until further notice *or the next tweet*
The Sell entry is great now cos we're near the top of the high volume node, so even if we consolidat
Related commodities

Gold: Bullish Pitchfork Holds Despite TurbulenceRecent geopolitical activity has caused turbulence in Gold Markets. News agencies are reporting stabilisation and the Pitchfork remains bullish.

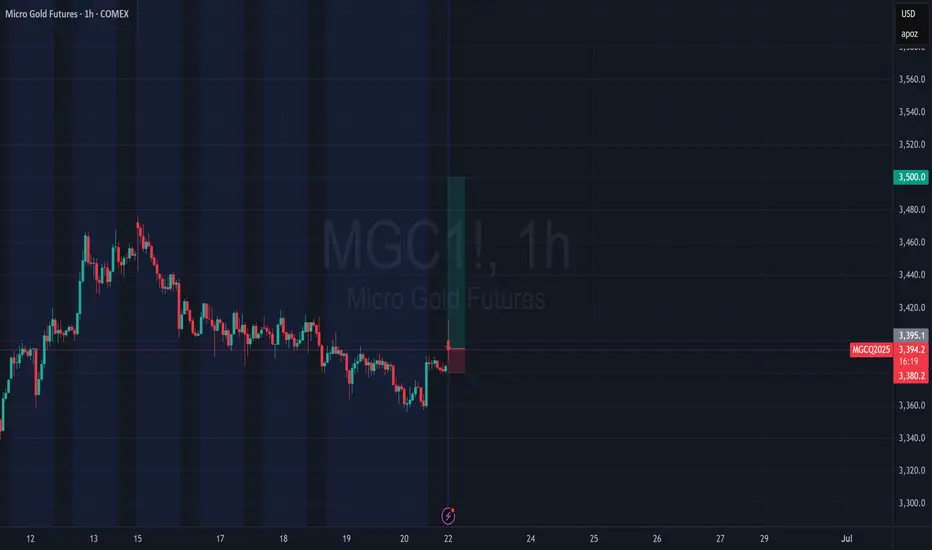
Move\Manipulate/Grab/Consolidate/PushFIrst ever idea on trading view.
Bias: Bullish
I have deveoped a stratagey that uses the Trend indicator (2.3) by dviz
Wont say everything but if you get a candle whos body is completly in the "cloud" of the trend indicator.. this is a signal
candle body
1 must be smaller than the wick
2 wick has

Patience has to be the Major Play in waiting on these Set ups! Was waiting for the sweep on gold to happen and they didnt do it till the very end of the day yesterday. Looking for the bullish action to continue. If we can get a breakout tonight then i will look for possible levels of support.

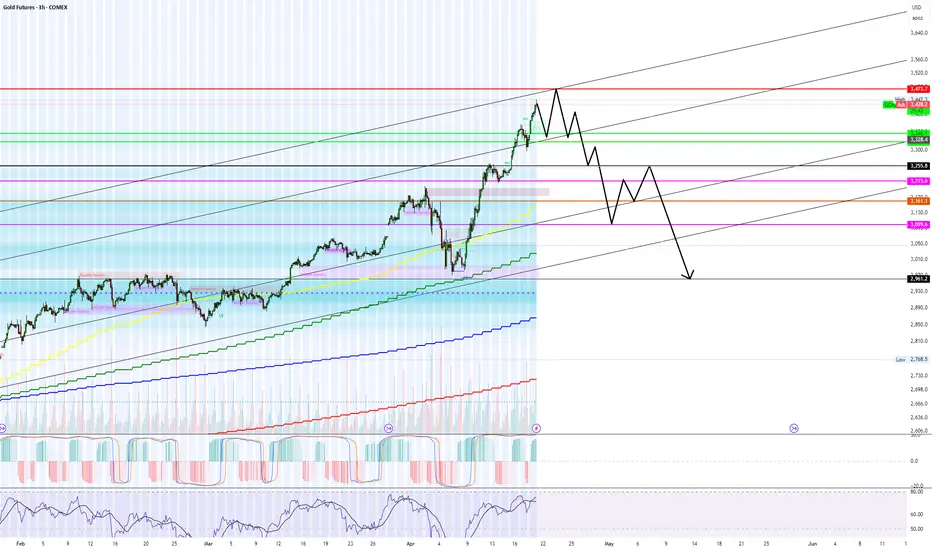
Agree to disagree... Gold is topping right now.My price path seen above is a complete guess but it stems from long term trend lines and more importantly order flow from last week.
On Thursday there was a #1 trade on AMEX:PHYS for $200+ Million at the green levels in my chart above (Equivalent levels). PRICE WILL 100% go to my green lines by
New Week! New Opportunities on GOLD! With the recent activity in the middle east expecting prices to continue bullish. I was looking for this move last week but it seems the holiday delayed the process. If we can get a full breakout above the previous daily High level that will be confidence that we are moving bullish for the rest of t

Have we made a Low for the Week yet on Gold???Im looking for price to sweep Monday's low before deciding what it wants to do. I want to see everything line up inside of the killzone to take advantage. Just have to be patient. We still have a lil time so sitting on my hands until it all looks clear to proceed with the move.

Gold Slides as Markets Downplay the Fallout of ME EscalationGold prices are trending lower today after a slight positive open, struggling to hold near $3,365 per ounce, hovering just above the lowest level in over ten days.
This weak performance comes as markets continue to downplay the consequences of the unprecedented U.S. strike on Iran’s nuclear facilit

Buying the Dip or Catching a Knife? My Gold Setup Explained.Entered a long position on XAU/USD from the 1H demand zone following sharp intraday selling into a key support level. With gold hovering near $3,300 and a significant testimony from Fed Chair Powell on deck, the setup aligns with both technical rebound potential and fundamental uncertainty that coul

See all ideas
Summarizing what the indicators are suggesting.
Neutral
SellBuy
Strong sellStrong buy
Strong sellSellNeutralBuyStrong buy
Neutral
SellBuy
Strong sellStrong buy
Strong sellSellNeutralBuyStrong buy
Neutral
SellBuy
Strong sellStrong buy
Strong sellSellNeutralBuyStrong buy
A representation of what an asset is worth today and what the market thinks it will be worth in the future.
Displays a symbol's price movements over previous years to identify recurring trends.
Frequently Asked Questions
The current price of Micro Gold Futures (Apr 2026) is 3,392.7 USD / APZ — it has fallen −1.78% in the past 24 hours. Watch Micro Gold Futures (Apr 2026) price in more detail on the chart.
The volume of Micro Gold Futures (Apr 2026) is 116.00. Track more important stats on the Micro Gold Futures (Apr 2026) chart.
The nearest expiration date for Micro Gold Futures (Apr 2026) is Apr 28, 2026.
Traders prefer to sell futures contracts when they've already made money on the investment, but still have plenty of time left before the expiration date. Thus, many consider it a good option to sell Micro Gold Futures (Apr 2026) before Apr 28, 2026.
Open interest is the number of contracts held by traders in active positions — they're not closed or expired. For Micro Gold Futures (Apr 2026) this number is 292.00. You can use it to track a prevailing market trend and adjust your own strategy: declining open interest for Micro Gold Futures (Apr 2026) shows that traders are closing their positions, which means a weakening trend.
Buying or selling futures contracts depends on many factors: season, underlying commodity, your own trading strategy. So mostly it's up to you, but if you look for some certain calculations to take into account, you can study technical analysis for Micro Gold Futures (Apr 2026). Today its technical rating is sell, but remember that market conditions change all the time, so it's always crucial to do your own research. See more of Micro Gold Futures (Apr 2026) technicals for a more comprehensive analysis.