Gold: Primarily HigherIn our primary scenario, we expect gold to set a new all-time high as part of the ongoing beige wave I. To achieve this, the price should soon generate more upward momentum during the subordinate light green wave 5 and surpass the current all-time high from April 22. Once the wave I cycle has concluded at higher levels, we anticipate the start of a new bearish phase. However, there remains a 40% chance that the precious metal has already completed the beige wave alt.I and is now entering a fresh downward cycle. Under this alternative scenario, the price would break directly below the supports at $3,123 and $2,970.
📈 Over 190 precise analyses, clear entry points, and defined Target Zones - that's what we do.
MGCQ2026 trade ideas


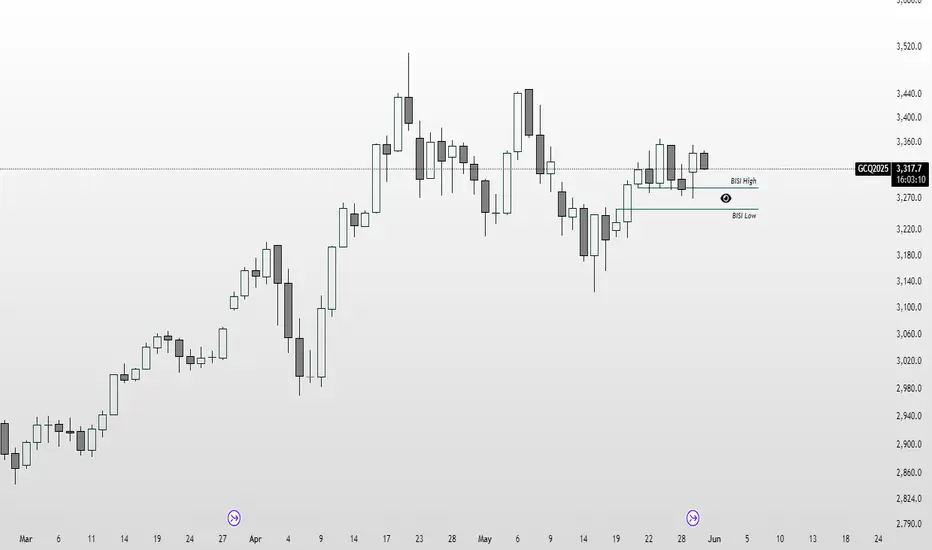
Gold's Daily BISI may hold the key Currently price action is within a range, and I'd be interested to see whether the Daily imbalance below may create a needed support to push price higher. Patience is a virtue.
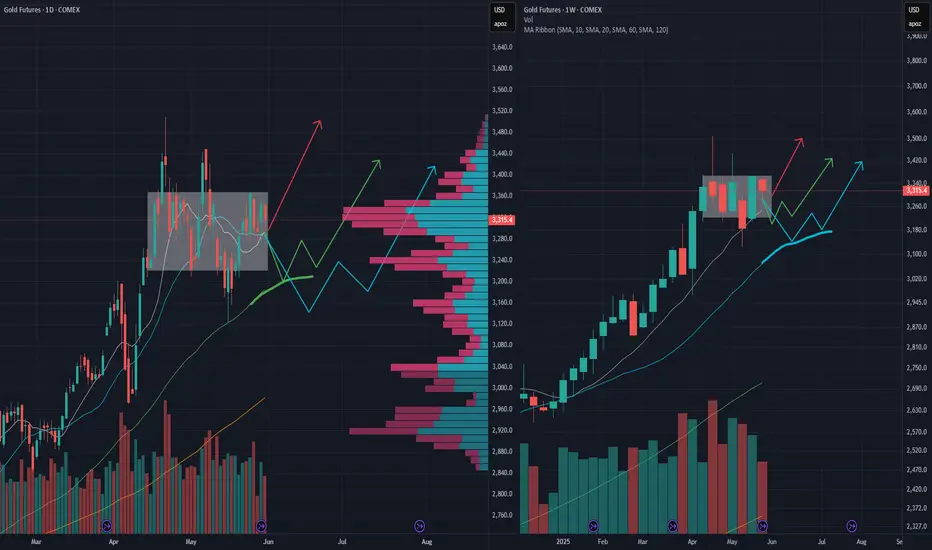
GC/GOLD bull rally setupHigh potential: looking for a 60 SMA support (~3200) in 2 weeks and then continue the bull rally (green path)
Medium potential: looking for a 20 weekly SMA support (~3140) in 1 month and then continue the bull rally (cyan path)
Low potential: directly break out next week (red path), but indicators do not quite support this case, so it may need some "external news"
gold Tesla ES versus the Russell and other markets November 2nd. gold looks bullish and may very well test the highs. I forgot to talk about silver as I was running out of time and that's trading very well and I will try to talk about silver tomorrow if I have time.

Short then Buy GOLDLong term bullish obv unless breaks happen. Shorting to get better entry then taking a long to the general upside from sustained movement and trend.

Scalp it or Swing it, but its bearish There is 65% chance that this trade would hit. Only time will tell though.
The upper trendline is bearish and it held for long, will whales manipulate the price and get the liquidity above then continue lower or the price will just hit lower? only time will tell.
I think maybe we will be visiting the 3000 again, hopefully soon.

Gold Still bearish for the momentLooking for gold to fill in a Bullish gap before I consider longs. price is pretty bearish this week and im thinking it due to the contract roll and month end close. Looking for price to find some area of support before considering going Long. As always we wait for the Killzones.

Gold Pullback Entry Opportunity Gold resumed its rally, sparked by recent tarrif news. Price is pulling back at the moment and has entered an sweet spot where we can confidently take our first low risk Buy.
BUYING HERE BECAUSE
1. We're entering into a low volume area, which is also in line with an FVG on the 1hr chart
2. When a new uptrend starts, i like to buy first 2 instances price pullback to bounce from my trend cloud indicator We didn't get a perfect bounce as it has broken below it, but i'am still buying regardless due to my first reason above about the low volume gap.
PROFIT TARGET
Setting my profit target to my trusted Exofade peak. As long as the uptrend continues, Exofade peaks will ALWAYS get taken out. That why i love this indicator, and its free. It's my gift to y'all :) . Just search for it in trading view indicators.

GOLD- BULL SIGN - BUY CALL - Bullish Flag patternMarket is making a Bullish Flag Pattern and it seems when breaksout with a Buy Stop order, it will move to its projected TPs

Gold at a Psychological Level Gold has now risen to 100 times its previously fixed price of $35 per ounce.
Is this a psychological milestone signaling a correction ahead, or is there still more upside potential?
Under the Gold Reserve Act of 1934, gold was officially priced at $35, a rate maintained until 1971, when President Nixon suspended the dollar’s convertibility into gold, effectively ending the gold standard. This historic move, known as the “Nixon Shock,” allowed gold to trade freely in the market. By December the same year, the market price had already climbed to around $43–44 per ounce.
So why has gold risen from $35 to $3,500?
Gold is widely recognized as a hedge against inflation—but in reality, it has proven to be more than that.
Let’s consider this:
If inflation had compounded at the target rate of 2% per year since 1971, gold should be priced at $102 today.
But at $3,500, the also implied that the compounded annual growth rate is around 8.9%.
So, what explains this outperformance?
One key driver is the expansion of the money supply, especially through debt, and more critically, debt financed by money printing.
Periods of high inflation are can be preceded by an unjustified increase in the money supply, not backed by corresponding income or production output.
In 2018, we saw the beginning of Trump’s Tariff 1.0. Since the anticipation of Trump’s Tariff 2.0, I’ve incorporated a framework I call the QTD Matrix—which stands for Quantitative Easing, Tariffs, and Debt—to track the trajectory of gold prices.
As long as we continue to see:
• Central banks deploying Quantitative Easing during crises,
• Ongoing or escalating Tariff wars, and
• Persistent growth in national Debt,
It is reasonable to expect gold to remain firm and potentially break into new highs.
Historical Observations:
• Let’s start with Gold vs QE. Each major wave of QE has triggered a significant rally in gold—from Japan’s QE in 2001, to US QE1, QE2, and QE3 following the 2008 crisis, and the massive Covid-era QE in 2020.
• Next Gold vs Tariffs. When Trump’s Tariff 1.0 was announced in August 2018, gold pivoted on that very day and began trending higher.
In October 2022, Biden’s export controls on advanced chips acted as a tariff-equivalent event, once again prompting gold to rise.
After Trump's re-election in November last year, markets began pricing in Tariff 2.0, and gold responded by trending upward once more.
• Finally Gold vs Debt. Gold has also moved in close tandem with the rising US debt over the years.
As of now, I believe that QE (Q), Tariffs (T), and Debt (D) will remain in play.
Hence, it's reasonable to expect:
• The cost of living to remain elevated,
• Inflationary pressures to persist, and
• Gold prices to continue their long-term uptrend.
That said, I’m also noticing technical and psychological resistance in the mid-term after it reached $3,500.
This is a quarterly chart, once I have identified its primary uptrend line, I would like to mirror it to its significant peak (going back way back the 1980s, a period of high inflation), which appears to intersect around the psychological level of $3,500.
With the trade war currently on pause, gold may temporarily take a breather. But as long as QTD remains intact, it may just be a matter of time before gold tests its recent resistance—and, if broken, continues its upward trajectory.
We should also ask:
Is there any possibility that the Q, T, or D could shift in the opposite direction?
If so, that could be a positive sign for equity markets.
Micro Gold Futures & Options
Ticker: MGC
Minimum fluctuation:
0.10 per troy ounce = $1.00
Disclaimer:
• What presented here is not a recommendation, please consult your licensed broker.
• Our mission is to create lateral thinking skills for every investor and trader, knowing when to take a calculated risk with market uncertainty and a bolder risk when opportunity arises.
CME Real-time Market Data help identify trading set-ups in real-time and express my market views. If you have futures in your trading portfolio, you can check out on CME Group data plans available that suit your trading needs www.tradingview.com
Trading the Micro: www.cmegroup.com
www.cmegroup.com

GOLD SqueezeLooking at the 4-hour timeframe. Price is failing to make LL or HH, with pressure getting tighter and tighter. Personally, I'm not really interested in trading a market like this till price breaks out.

What does the coming month implying?These are the questions that we should ponder:
1. Where are we coming off of? A Premium or Discount price?
2. Where is price likely to go?
3. Does the market have a reason to:
- Seek liquidity above or below the marketplace?
- Seek to mitigate inefficiencies?
4. How did Previous Month Candle close?
5. Do we have bullish or bearish Order Flow?
6. Does the correlated asset (ie. Silver) shows a crack or a change in the state of delivery?
7. Does the Fundamental support the Technical? Note: The shiny metal is an event driven asset.
I'm taking my time to study the Higher Time Frame chart to see the bigger picture, and keeping up-to-date with the current world event.

Gold is going to have a slow fall to set up for a bullish playLooking for the bearish pressure to continue. Price looks like it is ultimately setting up for a bullish play. We just need to see it hit a area of support first before that bullish play happens.

2025.05.28 gold analysis
This is the daily chart analysis for gold.
After an upward move, a broadening descending pattern is forming on the daily chart.
For the past four days, price has been supported by the 20-day moving average, with rebounds and pullbacks occurring repeatedly in similar zones. However, with the May 27th candle closing as a bearish candle, it’s wise to approach the market with the possibility of a 20MA retest and potential breakdown in mind.
If the 20MA breaks, there's a high probability price will decline to clear the left-hand blue demand zone. At that point, the Ichimoku Cloud support may turn into resistance.
Looking at the 2-hour chart, we can see a bounce from the bottom of the Ichimoku Cloud.
The key turning point for gold seems to be a break below the cloud.
Currently, the important level to watch is around 3286.
If the cloud breaks and the low at 3277.8 is breached, the price could fall to the low 3200s or even down to the 3100s.
From a bullish perspective, a break above the descending resistance trendline and 3366.5 would be needed to shift the view to bullish.
If that trendline is broken, it would signal a breakout from the descending broadening pattern, and a move up to around the 3500 level — where the pattern initially started — could be targeted.
Conclusion
For now, a bearish approach seems appropriate. A breakdown of the daily 20MA could lead to a sharp drop, and its timing is uncertain.
A bullish setup is still premature. It’s better to wait for the descending broadening pattern to be invalidated before considering a long position. The pattern still favors the downside.

Gold is Setting up for a Move! Could it be a big one?Looking for price to set up for a solid move. One thing is for sure we are waiting for the killzones before taking any action. The price action the last few days has been giving fake outs just before we roll into the killzone. Be patient. Wait for things to line up.

Gold Looks Bullish. But need more confirmation! Looking for more supporting signs that gold is ready to go bullish. I think it will pull back first. But waiting to see where price is at inside of the killzone before making any decision on direction. Being that it is Monday price could end up acting flaky on action. So keeping expectations low.

Gold Pops the Channel and Retest Holding Strong Gold FuturesJust Broke Structure with Authority!
Gold smashed through the regular channel resistance with a surge in volume, confirming strong buyer intent. We’re now seeing a pullback retest right above the previous resistance — classic breakout behavior.
Here's what I’m tracking:
- Channel Break with Institutional Volume
- Retest holding above previous resistance = support flip
- Smart Money accumulation signs
- High-Probability Entry Zone forming for the next leg
This move aligns perfectly with the smart money model I use inside my private group — and historically, this setup has a 90%+ win-rate when confirmed with our rules.
Next Target Zones:
Buy-side liquidity zones
Imbalance fills
Next high timeframe swing point
I won’t reveal the entry rules here, but if you want the precise entry, SL, and TP for this setup:
👉 DM me “GOLD SETUP” or
📩 Join our GoldenZoneFX private signal group.
Real institutional setups. Real results. No fluff.
Follow for more smart money-based trade insights
Follow @GoldenZoneFX For more content and valuable Insights.

Intensions to go SHORT from HTF Daily Fib. Levels 78.5-88.6%COMEX_MINI:MGC1!
If all else fails, Try Again. -500K
In this short vid. I have given my narrative as to why I am interested in this POI to go SHORT... Nothing is set in stone, however we play the long-term game of probability.
Remember our profession is to Manage the Downside costs of printing Highside returns of $$$ consistently. Done correctly, well an abundance of fruit awaits us... #BHM500K

Short. range boundGold range bound. Possible fake out to the upside. This is just speculation. Do your own research.

GOld trend directionGold 94790 is showing too congested volume pattern suggests aggressive distribution. We expect Gold will be back to its fair value 88000 to 60000 Zone ( Zone valid till Jan 26 )

Gold looks like it wants to go higher. We might need to wait. Waiting for more confirmation on what direction price wants to go in. Now that we are past the holiday more volatility should come back. Just waiting for it to confirm a direction first before getting active.

Gold Up?Gold might continue to go up even more, seems like a 4th wave in hourly
Price currently at a gap resistance, need to wait and watch what it does
4 Hourly Chart showed price taking a retest of trendline
Daily chart shows a clear ABC wave, possible all time high soon?
