COMPUSDT longHi Traders
Today we are analysing COMP/USDT (BINANCE) on 4-hour timeframe.
The price has been consolidating heavily around $40 support level, showing multiple rejections and signs of potential exhaustion.
I recommend waiting for a slight dip below this support zone ($40) to trap late sellers and

COMPUSDT Accumulation Ending? Massive Bullish Reversal Ahead!
🧠 Weekly Analysis
After peaking near $911 in 2021, COMPUSDT experienced a prolonged downtrend, followed by a wide sideways accumulation phase around the $33–$41 range.
📉 This consolidation has formed a classic Wyckoff Accumulation structure, often seen before strong bullish reversals.
🟨 Key Sup

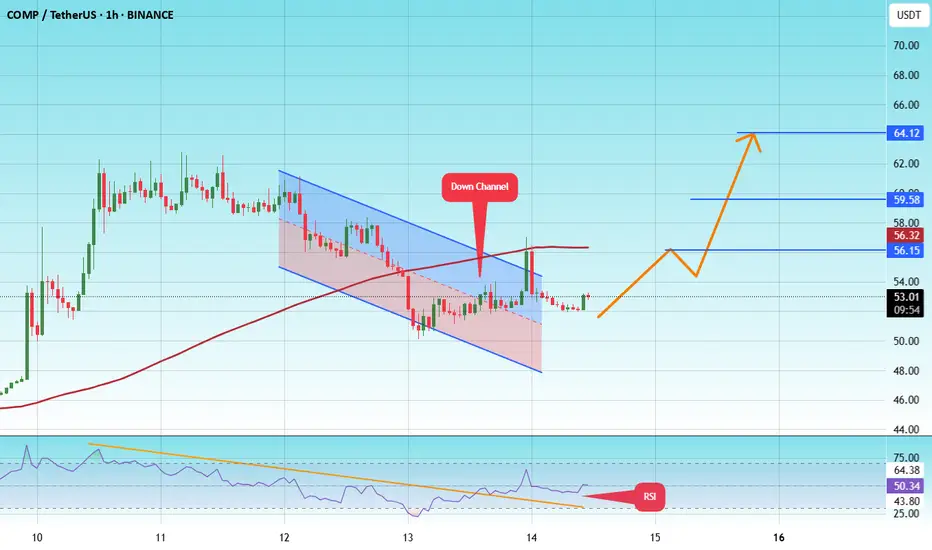
#COMP/USDT#COMP
The price is moving within a descending channel on the 1-hour frame and is expected to break and continue upward.
We have a trend to stabilize above the 100 moving average once again.
We have a downtrend on the RSI indicator that supports the upward move by breaking it upward.
We have a su
Compound 4X Lev. Full PREMIUM Trade-Numbers (PP: 2428%)This is a very, very easy set of targets that I am setting up here for Compound (COMPUSDT). And this trade setup with 4X leverage is low risk, very low risk. High potential for reward (more than 2,000%).
After June 2023, the dynamics changed from lower highs and lower lows, to higher highs and high

Compound Gets Even Better —Bull Market ConfirmedThe trading pair COMPUSDT seems to be struggling short-term, daily timeframe, but what is actually happening? Why all the daily candles continue to close so small even while volume is high? Let me explain.
Resistance was present on the form of EMAs. Recently, COMPUSDT managed to break above EMA21 a

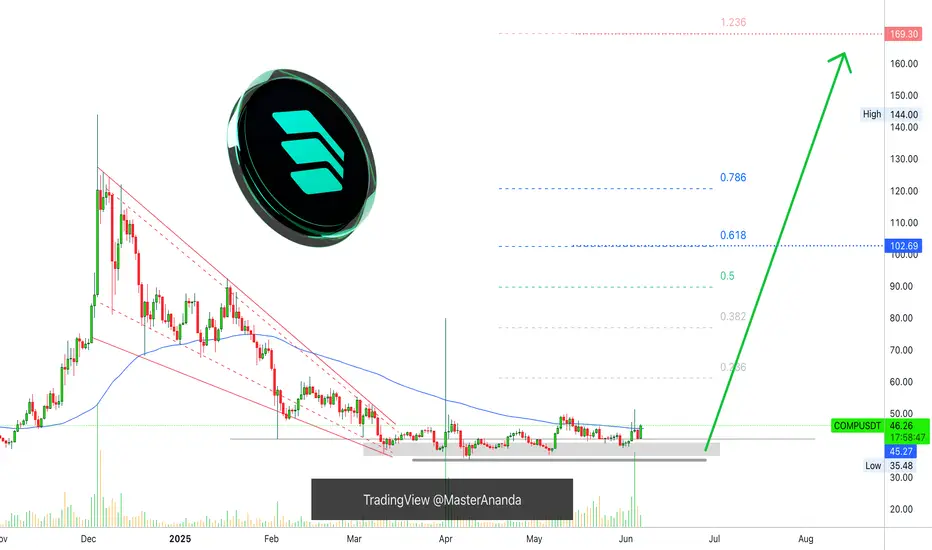
COMP/USDTThis is a bullish setup based on:
Breakout potential from a multi-year wedge or triangle pattern.
Higher highs suggesting accumulation and buying strength.

Compound Turns Bullish: Buy & Hold, Trade & WinCOMPUSDT challenged EMA89 June-4 but was rejected. June-5 ended as a red day. Today, the action is green again and back above EMA89. A close above this level and a wave above $100 is confirmed.
Good evening my fellow Cryptocurrency trader—it is still early for Compound—I hope you are having a wonde
COMP/USDT Breakout Alert !!COMPUSDT has broken out of a long-term downtrend line on the daily timeframe, signaling a potential bullish reversal.
Chart Analysis:
Downtrend line broken with a strong bullish candle
RSI recovering to 57.28 — showing improving momentum
Price holding above local support near $36.41
Key Levels:
Su

COMPUSDT 1D#COMP — Bullish Breakout Confirmed ✅
#COMP has broken above the Falling Wedge resistance and the daily MA100, signaling a bullish reversal.
The retest is nearly complete — setting the stage for a potential strong upward rally.
If momentum holds, here are the upside targets:
🎯 $56.60
🎯 $68.76
🎯 $7

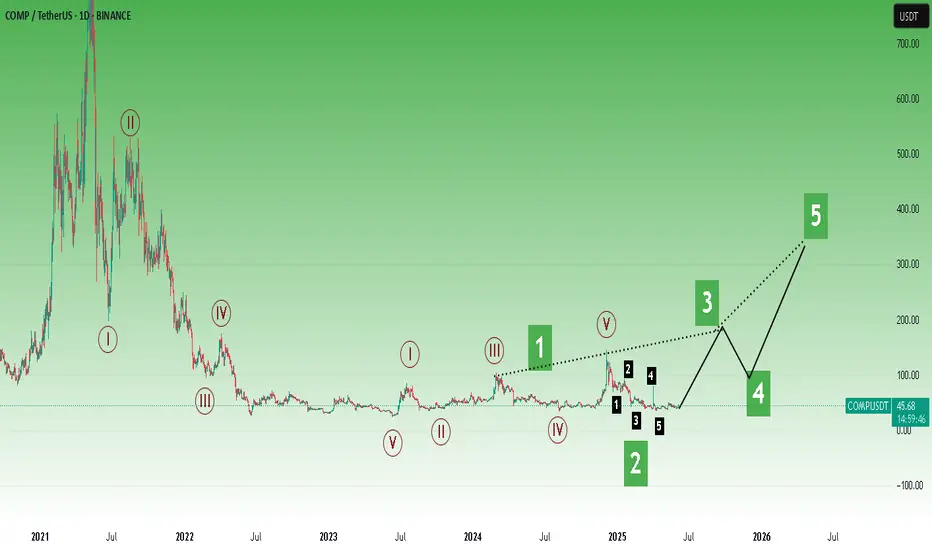
COMP ROADMAPTo me the view is pretty clear.
* The purpose of my graphic drawings is purely educational.
* What i write here is not an investment advice. Please do your own research before investing in any asset.
* Never take my personal opinions as investment advice, you may lose your money.
See all ideas
Summarizing what the indicators are suggesting.
Oscillators
Neutral
SellBuy
Strong sellStrong buy
Strong sellSellNeutralBuyStrong buy
Oscillators
Neutral
SellBuy
Strong sellStrong buy
Strong sellSellNeutralBuyStrong buy
Summary
Neutral
SellBuy
Strong sellStrong buy
Strong sellSellNeutralBuyStrong buy
Summary
Neutral
SellBuy
Strong sellStrong buy
Strong sellSellNeutralBuyStrong buy
Summary
Neutral
SellBuy
Strong sellStrong buy
Strong sellSellNeutralBuyStrong buy
Moving Averages
Neutral
SellBuy
Strong sellStrong buy
Strong sellSellNeutralBuyStrong buy
Moving Averages
Neutral
SellBuy
Strong sellStrong buy
Strong sellSellNeutralBuyStrong buy
Displays a symbol's price movements over previous years to identify recurring trends.