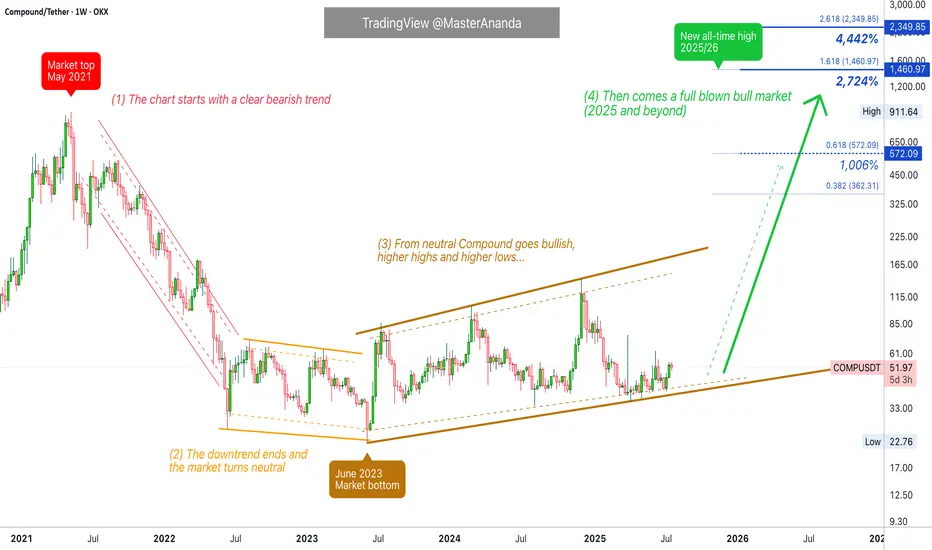
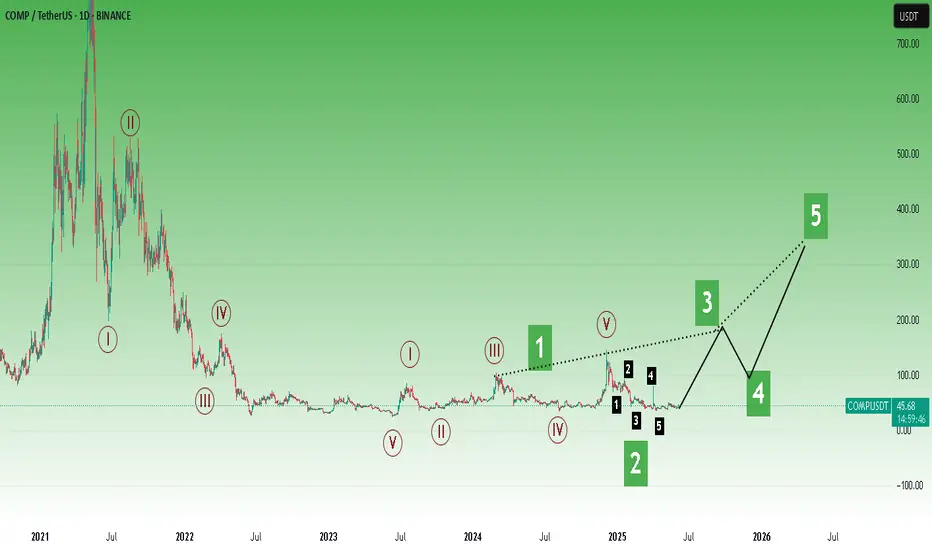
Compound Full Market Cycle · 1, 2, 3 & 4 (PP: 2,700% - 4,442%)This is the full long-term Compound (COMPUSDT) chart.
1) The market top happened May 2021. Notice how the bull market in 2021 ended early compared to 2025. While May signaled the start of a bear market, in 2025 we are already in July while trading at bottom prices.
High prices, a new all-time high, signals the start of a descent and bear market. COMPUSDT dropped from May 2021 until June 2022, more than a year. A shy lower low happened next around June 2023, a technical double-bottom.
2) Between June 2022 and June 2023 we have a neutral period, sideways. This is a "lost year."
3) Market dynamics change after June 2023. COMPUSDT stops producing lower lows and instead starts a bullish consolidation phase. Higher highs but still sideways. No major uptrend. This period lasts from June 2023 until present day, July 2025.
The pattern will break with a strong close above $150 followed by a sustained uptrend.
4) This is the 2025 bull market which can extend beyond this year into 2026, hopefully. Here instead of neutral or sideways, we should see a major uptrend as the mirror image of the 2021 downtrend. Also, a new all-time high is needed and expected to end this cycle. When the new all-time high hits, bearish conditions develop and the next bear market starts.
Potential for growth is huge, between 28 and 45X.
Thank you for reading.
Namaste.
COMPUSDT trade ideas
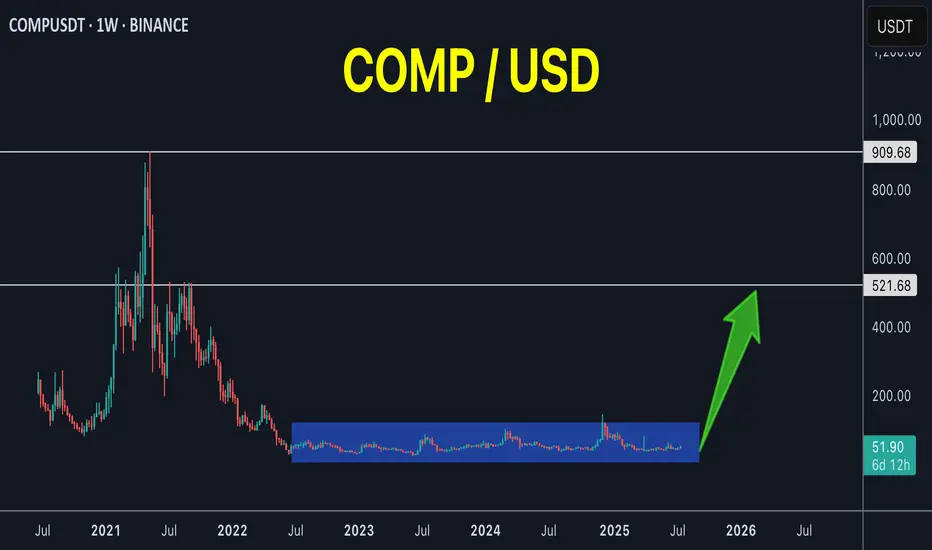
COMP 3 years of accumulation!COMP / USDT
3 years of accumulation and volume start to enter again
Just imagine if it breaks out from this long accumulation, the target will be very high but first we must breakout this accumulation box
Best of wishes
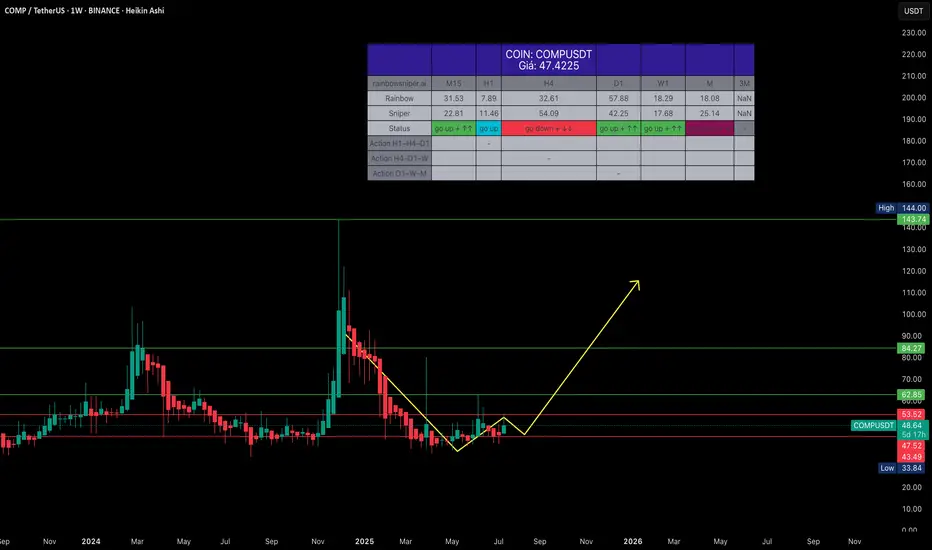
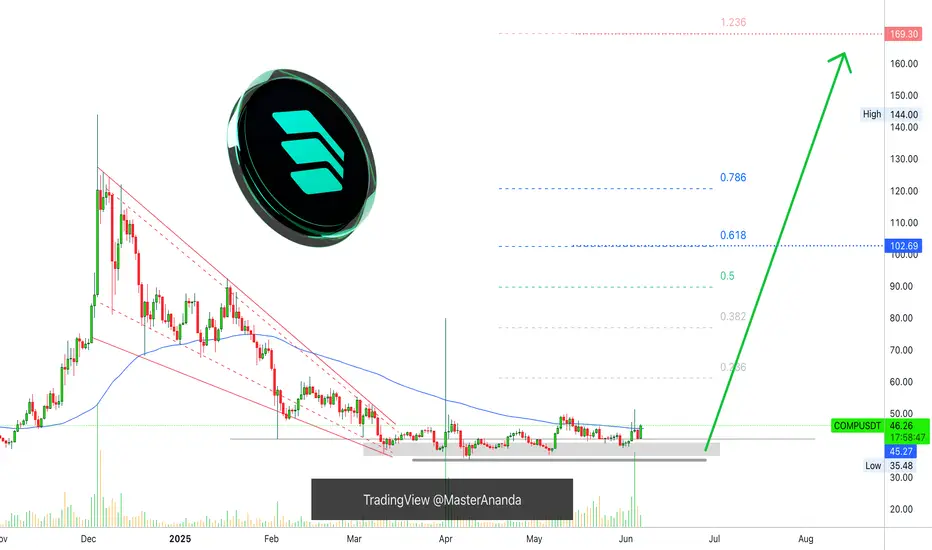
COMPUSDT – Long-term Spot Buy RecommendationCOMPUSDT – Long-term Spot Buy Recommendation
Hello,
In a market flooded with thousands of tokens, manually scanning for trending coins is exhausting and often ineffective. If that resonates with you, COMPUSDT is a worthy candidate to consider.
Current Outlook: COMPUSDT is in an accumulation phase, and the current price zone offers an ideal long-term buying opportunity. Though it's a long-term play, you can still expect to take profits within 2025.
Trade Type: Long-term Spot (2025 hold)
Entry Zone: Around $43 – $47, accumulate within this range.
Take Profit Strategy:
_Based on Weekly (W) peaks.
_Price reference points: $84 – $140.
_Strongly recommend holding above $100 for maximum gains.
Note:
If you're seeking quick profits, this isn’t the coin.
But with patience over 1-2 months, this investment should reward you handsomely.
Hỏi ChatGPT
COMPUSDT longHi Traders
Today we are analysing COMP/USDT (BINANCE) on 4-hour timeframe.
The price has been consolidating heavily around $40 support level, showing multiple rejections and signs of potential exhaustion.
I recommend waiting for a slight dip below this support zone ($40) to trap late sellers and look for a potential long entry.
If the pattern holds, we could see a strong bullish reversal targeting the resistance ($60) which offers a favourable risk-to-reward setup.
Keep an eye on price action for confirmation before entering.

COMPUSDT Accumulation Ending? Massive Bullish Reversal Ahead!
🧠 Weekly Analysis
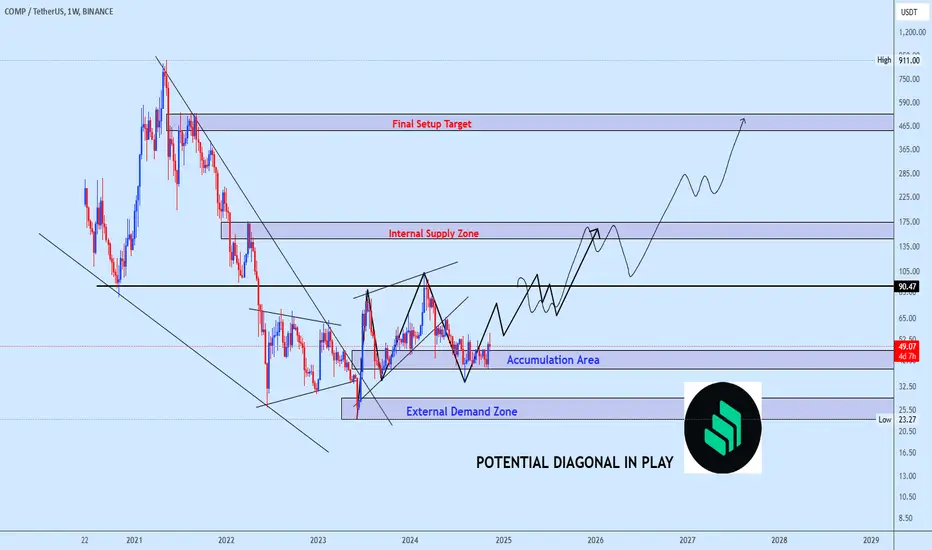
After peaking near $911 in 2021, COMPUSDT experienced a prolonged downtrend, followed by a wide sideways accumulation phase around the $33–$41 range.
📉 This consolidation has formed a classic Wyckoff Accumulation structure, often seen before strong bullish reversals.
🟨 Key Support & Demand Zone:
🔻 Accumulation Zone: $33–$41
This range has acted as a strong floor since mid-2022.
Multiple rejections from this zone hint at smart money accumulation.
Recent long wicks and bullish rejections from this zone signal a potential reversal brewing.
🔮 Bullish Scenario:
If the price holds above the accumulation zone and breaks key resistance, the bullish case unfolds as follows:
📈 Bullish Price Targets:
1. ✅ $62.64 — First breakout confirmation.
2. ✅ $89.03 — Minor resistance and psychological level.
3. ✅ $117.27 — Major historical resistance.
4. ✅ $173.11 — Medium-term target.
5. ✅ $246.03 — Potential full target from pattern projection.
6. 🚀 Extension Targets: $363–$516 in case of a strong altcoin rally.
🔥 Breakout Confirmation: Weekly candle close above $62.64 with volume surge.
🧨 Bearish Scenario:
If the $33 support zone breaks and closes below:
⚠️ Possible downside:
Drop toward $23.27 (2022 low)
Extreme scenario: retest of $17 zone
This invalidates the current bullish structure and resumes macro downtrend
📊 Patterns Observed:
🔹 Extended Accumulation Range
🔹 Potential Inverse Head & Shoulders (in development)
🔹 Double Bottom Structure (awaiting neckline breakout)
These patterns suggest a market gearing up for a major shift — but volume and breakout confirmation remain crucial.
📅 Summary & Strategy:
🟢 Entry Zone: $35–$42 (low-risk accumulation)
🟡 Breakout Zone: Above $62.64
🔴 Stop Loss: Weekly close below $33
➡️ Favorable risk-to-reward setup for mid- to long-term swing traders and investors.
💡 Watch for breakout volume and BTC’s direction for confluence.
#COMPUSDT #CryptoBreakout #AltcoinSeason #WyckoffAccumulation #SwingTrading #CryptoTechnicalAnalysis #COMP #BreakoutSetup #CryptoAnalysis #BullishStructure

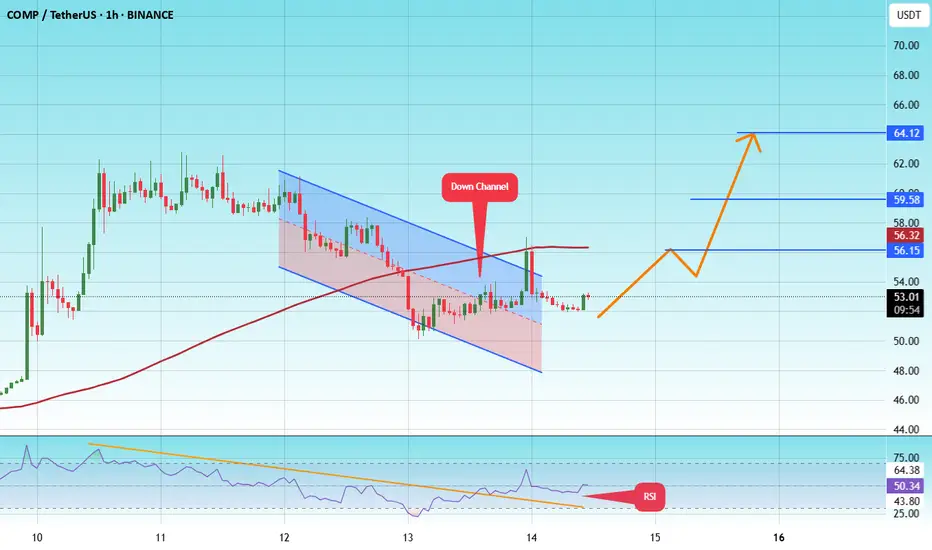
#COMP/USDT#COMP
The price is moving within a descending channel on the 1-hour frame and is expected to break and continue upward.
We have a trend to stabilize above the 100 moving average once again.
We have a downtrend on the RSI indicator that supports the upward move by breaking it upward.
We have a support area at the lower limit of the channel at 48, acting as strong support from which the price can rebound.
Entry price 53
First target 56
Second target 60
Third target 64
Compound 4X Lev. Full PREMIUM Trade-Numbers (PP: 2428%)This is a very, very easy set of targets that I am setting up here for Compound (COMPUSDT). And this trade setup with 4X leverage is low risk, very low risk. High potential for reward (more than 2,000%).
After June 2023, the dynamics changed from lower highs and lower lows, to higher highs and higher lows.
Late March produced the highest (buy)volume ever for this pair on this exchange. Someone in the background knows what is about to happen. Someone big. Now you know too thanks to this chart and trade-numbers.
The stop-loss is not meant for your liquidation nor for any trading, it is meant to indicate when the chart setup goes bad. Leveraged trading is for advanced traders.
If the stop-loss conditions are met, maybe monthly rather than weekly, the chart setup and market conditions are lost. Obviously, the stop-loss conditions can be activated and yet, growth still happens within weeks or months. Stop-losses should be ignored. Only advanced traders should use those.
This is a high probability trade setup. High risk vs a high potential for reward.
The numbers are meant for illustration only. Some people can use them to make predictions, others to decide where to buy as simply Cryptocurrency investors, while still others can use them to trade.
How you use these numbers is to you. I am not responsible for any loses, for how the market behaves nor any of your mistakes. Trading is a game for adults. A game, truly. This game can produce money as well as losses.
Trade at your own risk. I am wishing you success and great profits. You can do this. Just keep trying, work hard, study... Focus.
Full trade-numbers below:
_____
LONG COMPUSDT
Leverage: 4X
Entry levels:
1) $46
2) $43
3) $41
4) $36
Targets:
1) $50
2) $55
3) $60
4) $75
5) $88
6) $100
7) $122
8) $140
9) $165
10) $180
11) $205
12) $245
13) $274
14) $311
Stop-loss:
Close weekly below $35
Potential profits: 2428%
Capital allocation: 3%
_____
Don't mind my disclaimer on these trades. Some people can't face the fact of a losing trade. It is for those.
Responsible people like you and me know how the game works. We are happy to accept our winnings as well as any loss. We do not blame others for our mistakes. Life is full of challenges, we use these challenges as learning experiences. Trying circumstances are what made us into who we are today.
When you are going through something hard, it can be tough to face this reality with a smile in your face. When you look back to the past, in retrospect after all is great, you might even laugh and wear a badge of honor for the hard times you were able to overcome.
Think about it, a challenge that was once a nightmare, is now only a story that you can share and enjoy while you continue to grow.
Trading can help you improve your life, if you are honest with yourself and accept the fact that the market cannot be controlled. Yes, there is some manipulation, but nothing can control how nature works.
Nature works in cycles... After going down, everything grows.
Cryptocurrency is going up. Get used to it, because we are about to be showered with tons of profits, lots of money for all those who take the risk to buy and hold. Buy and hold now that prices are low.
Namaste.

Compound Gets Even Better —Bull Market ConfirmedThe trading pair COMPUSDT seems to be struggling short-term, daily timeframe, but what is actually happening? Why all the daily candles continue to close so small even while volume is high? Let me explain.
Resistance was present on the form of EMAs. Recently, COMPUSDT managed to break above EMA21 and EMA34, then EMA55. But one major level still needed to be taken out, EMA89. This is the blue line on the chart.
Two days ago COMPUSDT moved and close above this level. Yesterday, there was a Doji but no retrace. And today the action is green above $45.27 (EMA89). This is bullish confirmed.
See what happened back in November 2024, it is all the same. When COMPUSDT managed to close daily above EMA89, we have a massive bullish wave. It will be the same but different. The difference is that this time around the bullish wave will be many times bigger, prices will go much more higher.
Thank you for reading.
Namaste.

COMP/USDTThis is a bullish setup based on:
Breakout potential from a multi-year wedge or triangle pattern.
Higher highs suggesting accumulation and buying strength.

Compound Turns Bullish: Buy & Hold, Trade & WinCOMPUSDT challenged EMA89 June-4 but was rejected. June-5 ended as a red day. Today, the action is green again and back above EMA89. A close above this level and a wave above $100 is confirmed.
Good evening my fellow Cryptocurrency trader—it is still early for Compound—I hope you are having a wonderful day.
April-1 again, COMPUSDT tried to move above EMA55 and EMA89 but was rejected. The difference today is that the action is happening slowly, after several failed attempts, with high volume and two months of higher lows. In short, there won't be a rejection this time. And once the action moves above this level, blue on the chart, bullish confirmed.
This is just a friendly reminder, I posted about this one recently; this is one that you can't miss.
Whatever you do » Buy and hold, trade and win.
Namaste.
COMP/USDT Breakout Alert !!COMPUSDT has broken out of a long-term downtrend line on the daily timeframe, signaling a potential bullish reversal.
Chart Analysis:
Downtrend line broken with a strong bullish candle
RSI recovering to 57.28 — showing improving momentum
Price holding above local support near $36.41
Key Levels:
Support: $36.41
Resistance Levels / Targets:
Target 1: $54.68
Target 2: $89.71
Final Target: $123.13
Bias: Bullish — as long as price sustains above the downtrend line and holds support
Timeframe: 1D
Strategy: Watch for retest of breakout zone ($43–$45) as potential entry, with targets as mentioned.
This is not financial advice, please research before investing, as we are not responsible for any of your losses or profits.
Please like, share, and comment on this idea if you liked it.
#COMPUSDT #CryptoTrading #TechnicalAnalysis #Altcoins #Breakout #BullishSetup

COMPUSDT 1D#COMP — Bullish Breakout Confirmed ✅
#COMP has broken above the Falling Wedge resistance and the daily MA100, signaling a bullish reversal.
The retest is nearly complete — setting the stage for a potential strong upward rally.
If momentum holds, here are the upside targets:
🎯 $56.60
🎯 $68.76
🎯 $78.58
🎯 $88.40
🎯 $102.39
⚠️ Always use a tight stop-loss to manage risk and protect your capital.

COMP ROADMAPTo me the view is pretty clear.
* The purpose of my graphic drawings is purely educational.
* What i write here is not an investment advice. Please do your own research before investing in any asset.
* Never take my personal opinions as investment advice, you may lose your money.
Compound 3 Years Consolidation = Ultra-Bull Market (PP: 3,164%)Compound has been consolidating for three years now, similar to DigiByte in time but the chart situation is different, the price here is much better because it is trading lower near support.
I cannot stress it enough. You cannot fail with a pair like this one. Trading at bottom prices after years of consolidation. Once it starts going/growing you will be sitting on a very strong position. Long-term growth. Huge potential for profits vs a minimum risk potential.
Ok. I say "no leverage" but I share leveraged trades. Remember, many people so there is a little bit for everybody.
The trick is to go below 5X. If you do 3X, you are always safe basically, very little risk and you can maximize profits. 5X is also do-able. If you go beyond 5X, it is possible of course and we do it all the time but you run the risk of getting liquidated. So there are some trade-offs.
But of course, you need to do your own thing I am only sharing the charts.
Spot trading, 100% success guaranteed. Worst case scenario, a long wait.
To achieve these two you cannot use a stop-loss. If you do use a stop-loss then you can be shaken out of your position through a market flush. If you buy and hold, set it and forget it, you can win for sure long-term.
Compound has been consolidating for three years and is getting ready to move. Once it starts moving there is no going back. The longer the consolidation phase the stronger the bull market that follows.
Namaste.


Compusdt trading ideaCOMPUSDT is displaying a leading diagonal formation, with waves 1 and 2 completed and accumulation underway for a strong wave 3 rally. This is an ideal opportunity to accumulate while the coin remains undervalued. The designated accumulation area offers a strategic entry, with target levels marked on the chart to guide positioning.
Share your thoughts on this setup!
OMG, Which One? Too Many Altcoins To Choose From —CompoundIt goes something like this, and this is easy: One of my friends ask me for a coin that is set to move now. High level of accuracy. Of course, the first thing I think about is all the trades in the past month that already went up, but, ok the show goes on and the market has lots to offer. This pair is the one that I showed him. This one is going up.
Compound here is easy and I will explain the chart for you right away. Quick and simple of course because simple is best.
We have the higher lows since June 2023.
We have higher highs as well. That's as simple as it gets cuz it reveals the bullish bias and bullish trend.
Now, how do we know if it will move right away?
Value. This is valuable... Notice the high volume candle 7-April. This reveals the bullish bias.
You can choose your own target of course, but my point is, this one is the ones that is going up.
There are many pairs to choose from, but some will move in three months, other in three weeks and other in three days. Some will not move at all... Choose wisely.
Thank you for reading.
Namaste.

compusdtBroke all the previous trendlines like many other coins in this rally but it has lot of room to go till 57 easily in less then a next 2,3 days which is about 30% however it can go far beyond that. as it is showing lil bit of divergence so i suggest it should be bought at pullback. current buying levels at pull back will be 46 and 42. SL is 40.5

COMPUSDT 1D AnalysisCOMP ~ 1D Analysis
#COMP Buy gradually from here if you still have a Conviction on this coin with a short -term target of at least 10%+ from here.

Comp Spot Buy✅ Trade Setup Plan
🟢 Bullish Scenario (Long Entry)
📥 Entry:
Aggressive Entry: Now (~$41) after breakout from the descending trendline
Safer Entry (Confirmation): Break and close above $44 with volume
🎯 Targets:
TP1: $47.90 – $48.50 (recent local high)
TP2: $50.80 – $51.50 (resistance zone)
TP3: $56 (major resistance)
🛑 Stop-Loss:
Below $38.50 or tighter at $39.80 if you entered at $41
Below $36.50 if you're targeting a wider swing trade
🔴 Bearish Scenario (Short Entry)
📥 Entry:
If price fails to hold $39.80 and breaks below $38.50 with volume
🎯 Targets:
TP1: $35 (support region)
TP2: $33.20 – last tested bottom
🛑 Stop-Loss:
Above $41.20 or $42 depending on entry
📊 Indicators to Monitor
RSI: A clean push above 60 = bullish strength; drop below 40 = bearish pressure
MACD: A strong bullish crossover + increasing histogram = momentum confirmation
Volume: Confirm breakouts with increasing volume

COMPUSDT 1WCOMP ~ 1W Analysis
#COMP Buy back from here with a short -term target of at least 20%+. This is a very good support for now.

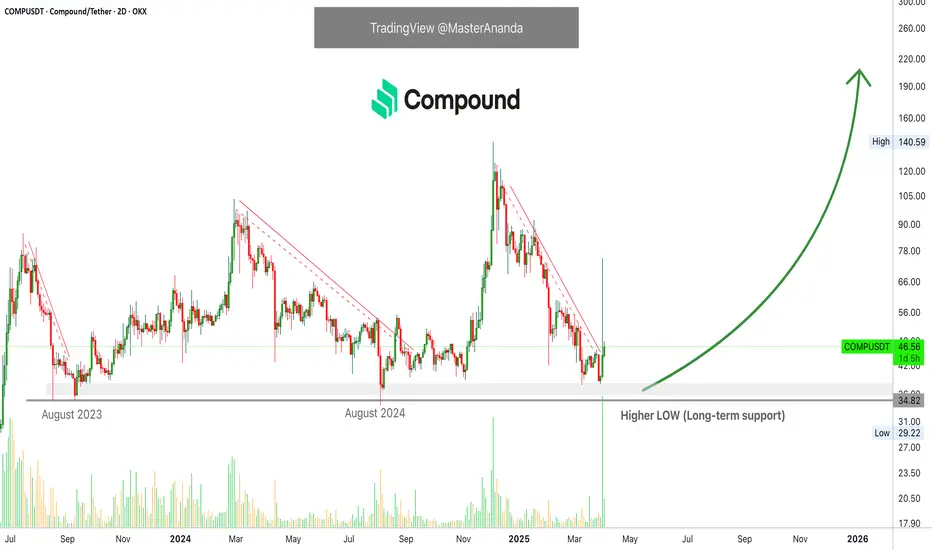
Compound: Ready, Bullish, LONG (More Than 30X Growth Potential)Compound is ready. COMPUSDT is now confirmed bullish. Time to go LONG.
How are you doing my friend in this beautiful day?
I hope you are doing great. Another interesting pair with a great entry price, a great project as well.
Compound produced the highest volume in several years as we entered April 2025. This is huge. This signal alone reveals that the next bullish wave is already here.
A long-term support holds —fails to be tested, which is bullish; we have a higher low. A yearly double-bottom is present on the chart, August 2023 and August 2024. March 2025 produced the higher low.
The previous session produced the highest buy (bullish) volume since March 2022, three years ago. There is also a long upper wick on the candle. This means that resistance has been removed. The rise can now happen smoothly as all the sell orders all the way to $75 have been fulfilled. We are LONG on this pair.
Compound has been producing higher highs since mid-2023. These higher highs are part of a long-term, wide, consolidation phase. This consolidation is the preparation for the 2025 bull-market. We are looking at a potential of... I don't know, maybe $1,444 as the next All-Time High. Let's do the maths. Some 30X.
This is a timing based chart. "Seek you first great entry prices and timing, and all these profits shall be added unto you."
If you want to know more about the numbers and signals, search for COMPUSDT when you visit my profile, you will find all the numbers for the 2025 All-Time High and beyond.
This pair is good now to buy and hold.
Leveraged traders can also approach this pair with low risk and a high potential for reward.
Thank you for reading.
Your support is appreciated.
Namaste.
Compound COMP price analysisWhat is happening today?) Some coins are falling -50% per hour, and #COMP has grown +85% from $40 to $75 per hour
Does anyone know what kind of "breakthrough" happened in #Compound ?
Is this what we get, can we start dreaming about the growth of OKX:COMPUSDT to $175, and if we are lucky, to $215?)
_____________________
Did you like our analysis? Leave a comment, like, and follow to get more
