Strategies to Save Capital and Thrive in Bear MarketsEver felt stuck in a downtrend, unsure how to protect your capital?
Most traders burn their portfolios in bear markets just because they lack a real escape plan.
In this analysis, you'll uncover little-known strategies that could literally rescue your investments.
Hello✌
Spend 3 minutes ⏰ reading this educational material.
🎯 Analytical Insight on Dogecoin:
If Dogecoin fails to gain at least 20% in the next two weeks—while Bitcoin continues to rally—this divergence could signal a broader market weakness. When BTC outperforms and altcoins lag, it often reflects declining risk appetite and potential capital rotation out of speculative assets. A move toward the $0.27 target is key for confirming bullish continuation across the altcoin sector. 📉
Now , let's dive into the educational section,
🔧 TradingView Tools to Hunt Opportunities in Bear Markets
In bearish conditions, most traders only stare at price movements. But smart ones go deeper. With the right TradingView tools, you don’t just survive a bear market—you exploit it. Here are some must-use tools that can change your game:
Volume Profile: This helps highlight where trading activity is concentrated. These zones often act as hidden support in bearish phases.
Fixed Range Volume Profile: Use this to scan specific chart segments to understand volume-based zones of control. Perfect for pinpointing possible rebounds.
Auto Fib Retracement: TradingView’s automated Fibonacci retracement tool helps identify pullback levels. A critical asset when timing entries during downtrends.
Divergence Detector: Combine RSI or MACD to catch bullish divergences—these subtle signs often come before a trend reversal.
Multi-Timeframe S/R Indicator: This reveals support and resistance levels across different timeframes. Knowing where multiple levels align helps predict strong reactions.
For practical use, open a BTC or ETH chart, apply these tools, and look for volume clusters, divergences, and Fibonacci confluences. The more layers you add, the stronger your edge becomes. TradingView isn’t just a charting platform—it’s your bear market radar .
📉 Understanding Bear Market Psychology
Bear markets are all about fear and exhaustion. But that doesn’t mean opportunity is gone. If you learn to read the crowd’s psychology, you’ll see it’s just a phase—one you can use to your advantage.
🛡️ Capital Protection Comes First
Rule one in bear phases: protect, not profit. Logical stop-losses, reducing position sizes, using stablecoins, and cutting emotional trades are your survival kit.
🧲 Catching Opportunities in Pullbacks
Even bearish trends have bounces. These are golden moments to take short-term trades or exit from poor positions. The 4H chart with Fib retracement is your best friend here.
🔄 Range Trading = Consistent Gains
Sideways movement = scalping zone. Once price enters a range, clearly marked support/resistance levels from your indicators give sniper-level entries and exits.
🔮 Reverse Market Sentiment Like a Pro
In bear markets, everyone’s scared. Which means smart money starts buying. Flip your emotional lens. Fear on the street = quiet opportunity for the patient.
📊 Indicator Fusion for Early Signals
RSI + MACD + Volume = market whisperers. If RSI bottoms while volume spikes, you’re probably seeing the quiet before a bullish storm. Most won’t notice. You will.
🧬 Learn From the Past Market Cycles
History repeats. Mark previous bear market lows on your chart. Compare price action. Similar structure = similar outcome. Patterns from BTC 2018 or COVID crash are still valid today.
🧠 Your Mindset Is Your Strongest Tool
More than any tool or strategy, it’s your mental control that saves capital. If you can master your thoughts, you can master your trades. Bear markets punish the weak-minded—not just the unskilled.
🧭 Final Thoughts:
If you take away just one insight, let it be this: in bear markets, survival is the goal, and hidden opportunities are born from fear. No trend lasts forever. But the prepared trader lasts through every trend.
always conduct your own research before making investment decisions. That being said, please take note of the disclaimer section at the bottom of each post for further details 📜✅.
Give me some energy !!
✨We invest countless hours researching opportunities and crafting valuable ideas. Your support means the world to us! If you have any questions, feel free to drop them in the comment box.
Cheers, Mad Whale. 🐋
DOGEUSDT trade ideas

Lingrid | DOGEUSDT Corrective Move Completed. Possible LongThe price perfectly fulfilled my last idea . BINANCE:DOGEUSDT just printed a higher low on the ascending channel support, bouncing off the 0.188–0.190 zone. The prior A-B-C pullback is fading, and early bullish signals are showing above 0.192. If buyers regain control, the price could target 0.215 resistance as momentum rebuilds. Structure remains bullish while above the trendline and support block.
📈 Key Levels
Buy zone: 0.187–0.190
Buy trigger: reclaim of 0.195 with bullish confirmation
Target: 0.215
Sell trigger: breakdown below 0.187
💡 Risks
A breakdown below the higher low invalidates the setup
Consolidation under 0.195 may delay breakout
A sharp BTC drop could weaken this bullish scenario
Traders, if you liked this idea or if you have your own opinion about it, write in the comments. I will be glad 👩💻

#DOGEUSDT: Targeting $2 By End Of The Year| Comment Your Views|DOGEUSDT stands as one of the most significant cryptocurrency pairs, yet its price has experienced substantial consolidation within a defined range, presenting challenges for trading and investment. However, we posit that the current price juncture holds the potential for a reversal, and we anticipate that by the end of the year, DOGEUSDT will reach approximately $2. In the interim, we recommend targeting smaller price ranges rather than aiming for $2, which may require months or even years to attain.
We extend our best wishes for your trading endeavours. It is imperative that you conduct your own analysis prior to making any investment decisions, as this does not guarantee any potential price movement.
If you’re feeling inspired by our content, we’d love to hear from you! Just give it a like, comment, or share your thoughts. It means the world to us!
Cheers,
Team Setupsfx_

DOGE Ready for PUMP or what ?What I see now is that the price could correct to the PRZ and then pump again, and currently, there is no specific bullish pattern in the chart. which could cause the price to drop below 17 cents.
Best regards CobraVanguard.💚

$DOGE At Key Support Reversal Ahead?The DOGEUSDT 1D chart shows price testing a strong support zone around $0.18–$0.19.
If this level holds, a bullish reversal could push DOGE toward the $0.32 resistance area.
The setup suggests a potential uptrend with higher highs, but a breakdown below support may invalidate this move.
DYRO, NFA

Dogecoin Bearish (BD) but Bullish (BU)You see, Dogecoin is bearish but this bearish is only short-term. This retrace can last a few days more and then the market will turn and start growing again. In the worst case scenario, the drop can extend and last one or two weeks, that's it. Nothing more.
So, what does it matter if it goes down short-term when it will grow in the long haul.
See the pattern on the chart and the rising trendline at the bottom. This is the main support. The bullish structure will remain intact, the market is adapting because obviously, too much leverage can never work.
Once the over-leverage is removed from the market, we resume growing and this resumption is just around the corner. Next week or the week after, it doesn't matter, we are going higher.
Namaste.

DOGE - Critical support - Going Up. Going up if support holds. Higher low. Next resistance 25c. Enter new long. 18.5c. Tight stop loss.

DOGE/USDT – Key Support Holding for Possible 194% Rally
Dogecoin has recently shown renewed signs of strength after reacting positively to the 200-week moving average. This level acted as a major dynamic support and helped ignite a bullish impulse from oversold conditions. The response from this zone suggests potential accumulation and a shift in short-term sentiment.
The most important level to watch is the $0.16 support. This zone is critical for the bullish thesis to remain intact. If price holds above this level, it increases the probability of a continued rally, especially with recent market structure favoring higher lows.
From a technical perspective, Dogecoin has now broken above a short-term descending trendline. This breakout, coupled with sustained strength above the 200-week MA, may set the stage for a significant move to the upside. The ultimate technical target remains the all-time high zone near $0.48, which represents a potential 194% gain from current levels.

DOGEUSDT 1D Analysis DOGE ~ 1D Analysis
#DOGE Buy back gradually from here with a short term target of at least 15%+ from here.

#DOGEUSDT: Upcoming Big Bullish Move| Crypto| Setupsfx_| BINANCE:DOGEUSDT price is still bearish, however, after some point we can see strong bullish volume kicking in the market. After NFP today, we might see price dropping a little more until it reaches our area of entry. From which we can see strong price rebound towards our target area which would be 0.23.
We wish you all the best and always maintain a great risk to reward ratio.

The key is whether it can find support at 0.18951 and go up
Hello, traders.
If you "Follow", you can always get new information quickly.
Have a nice day today.
-------------------------------------
(DOGEUSDT 1D chart)
It touched the A section, which was the previous breakout trading section, again.
That is, if it is supported and rises near 0.18951, it is a time to buy.
If not, it will fall below the M-Signal indicator of the 1M chart, so caution is required when trading.
This is because in order to continue the upward trend in the medium to long term, the price must be maintained above the M-Signal indicator of the 1M chart.
Therefore, a short and quick response is required when trading below the M-Signal indicator of the 1M chart.
-
The channel of the High Line ~ Low Line of the OBV indicator is showing signs of turning into a downward channel.
Therefore, you should check whether the OBV shows signs of rising above the High Line.
-
The basic trading strategy is to buy near the HA-Low indicator and sell near the HA-High indicator.
It currently meets the HA-High indicator and falls to meet the HA-Low indicator.
Therefore, this wave should be interpreted as closed.
Therefore, a new wave will start from the HA-Low indicator that we met this time.
If it falls from the HA-Low indicator, it is likely to show a stepwise downtrend, and if it rises from the HA-High indicator, it is likely to show a stepwise uptrend.
Therefore, we need to check whether the HA-Low indicator supports the new wave to see if it is a downtrend or an uptrend.
-
Thank you for reading to the end.
I hope you have a successful trade.
--------------------------------------------------
- This is an explanation of the big picture.
(3-year bull market, 1-year bear market pattern)
I will explain more details when the bear market starts.
------------------------------------------------------

#DOGEUSDT: Swing Buy Coming Up, Get Ready Dear Traders,
Price of Dogecoin has dropped similarly to the other crypto pairs, price is on the way to fill the void area and then we can see price reversal. Wait for price to drop a bit more than you can enter a buy entry, taking price to a new level.

DOGEUSDT 0.2550 TPWe are seeing a price rebound from strong support around the ~0.1900 level, which may signal the end of the correction. A potential double bottom formation is forming, which often indicates a trend reversal to the upside.
Additional arguments:
The WT_LB oscillator shows an oversold zone and initial upward curvature of signal lines – a typical buy signal.
After a strong downtrend, a consolidation phase has occurred, likely acting as an accumulation zone before a potential move upward.
The risk-to-reward ratio (R/R) is very favorable (around 1:5), supporting a long entry at the current market structure.
📌Technical signals and a strong R/R ratio support a bullish scenario, with a target around 0.252 and a stop-loss set near 0.185.

A sweet dream that will most likely come true.This is the best thing that has happened to the Dogecoin community. This cup pattern has generally worked.

DOGE: Setting Up for a Bounce?Eyeing a potential reaction at the 100% Fibonacci retracement of the recent 3-wave correction.
Entry: ~0.2080
Stop: ~0.1800
T1: ~0.2340
T2: ~0.2980
NFA

Price tapped the discount — now it’s time to test premium.This setup on DOGE/USDT was mechanical. Not emotional.
I’ve seen this formation enough to know what comes next. The chart has already spoken.
After a clean markdown into the 4H OB, price hit the 0.786 retracement level — right inside a prior imbalance zone. That wasn’t a random drop. That was engineered. Liquidity was swept, sentiment reset, and now we have structure ready to reverse.
Notice this:
We’re sitting in a 4H demand OB with confluence from the FVG just above.
The Fibonacci levels are aligning with Smart Money delivery: 0.5 sits right at the base of the new rally expectation.
The 0.20928 level is the first key reaction point — I expect a stall or consolidation there.
But the real test comes higher: the 0.22094 OB, which also aligns with the 0.382 fib level — the market’s threshold between discount and premium.
I’ll be watching price closely on its approach into that 0.209–0.22094 region. If it delivers clean displacement through FVG, the next liquidity grab sets up a premium continuation model.
If we reject early — that tells me distribution is starting, and I’ll prep for a secondary sweep below 0.18 to retest the deeper 4H OB near 0.16387.
This setup didn’t require a confirmation signal.
It required understanding why price dropped — and where it’s designed to go.
I don’t need to guess. I just need to be aligned.

DOGEUSDT → Long squeeze before growth?BINANCE:DOGEUSDT.P is consolidating. A range with clear boundaries has formed. Before a possible breakout, a liquidation (false breakdown) may form
On D1, the structure is quite positive. Earlier, the price tested the downward resistance, but there was no reaction (fall) as such. Instead, the price is consolidating within the range of 0.211 (0.205) - 0.23 - 0.253.
Bitcoin, like the entire crypto market, is consolidating within fairly clear boundaries. Based on the current situation, it would be logical to wait for one part of the market to be liquidated before the price can move in either direction. Based on the bullish market, there may be a retest of support in the form of a false break...
Resistance levels: 0.2308, 0.253
Support levels: 0.213, 0.2116, 0.205
DOGE is consolidating with a focus on the 0.23–0.211 range. Against the backdrop of a bullish trend, a liquidation (long squeeze) relative to the lower boundary of the 0.23–0.205 range is possible before growth continues. A false break of support and liquidity capture would be useful maneuvers before implementation. However, if the market is aggressive enough and resistance at 0.23 is broken with subsequent consolidation above this level, it could trigger premature growth.
Best regards, R. Linda!

DOGECOIN. USDTDogecoin is a meme coin that top investors are looking at.
So it works very technically.
Don't rush into fake failures or you'll get liquidated.

They see relief. I see rebalancing.BINANCE:DOGEUSDT.P isn't bullish — it's rebalancing. What we’re witnessing now is price doing what it always does after manipulation: return to efficiency before delivering its next displacement.
Here’s the setup:
Price tapped into the 4H discount zone — a structural STB
We’re now reacting from the 0.618 (0.1940) and pushing up toward the 4H OB at 0.20403
That OB is perfectly nested just above the 0.5 fib (0.20190), and below the 0.382 (0.20970) — prime for internal liquidity collection
If price fails to break structure above that 4H OB, the move is complete. This isn’t bullish continuation — it’s cleanup. From there, I’m watching closely for signs of rejection and displacement back toward the OB + BTS zone near 0.16884.
This is where real risk is priced in — and where Smart Money actually loads up.
Execution mindset:
Let price reach into 0.204–0.209
Watch for rejection — that’s the trigger
Downside target: 0.18299 → 0.16884
If we impulsively break 0.2097 and reclaim it, the bearish thesis is invalidated and I’ll re-evaluate
This isn’t trading a bounce. It’s reading the cleanup.
You want real entries, real invalidations, real structure? Check the profile description. The trades speak louder than the noise.

DOGE – Monthly Round Bottom Test🐶 CRYPTOCAP:DOGE is testing the round bottom support line on the monthly timeframe.
👀 Watch closely — either a bounce or rejection could shape the next big move!
🟢 Stay alert! GATEIO:DOGEUSDT CRYPTOCAP:DOGE

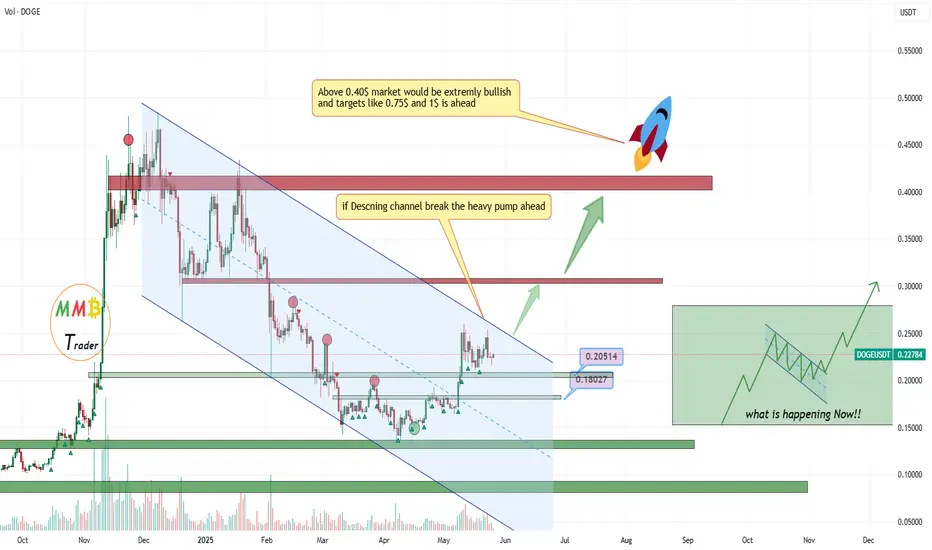
DOGEUSDT Above channel resistance will pump non stop get readyAs we can see price is getting ready for a breakout to the upside which cause DOGEUSDT pump non stop and even maybe will lead DOGE to new ATH.
All is needed which will happen soon is price break blue channel resistance and price above 0.27$ is sign of that.
DISCLAIMER: ((trade based on your own decision))
<<press like👍 if you enjoy💚
#DOGEUSDT: Another Big Time Buying Chance! BINANCE:DOGEUSDT
Price has fallen to previous lowest low, indicating another reversal from the same area, however, please wait to witness some bullish behaviour to occur. After that, we can have a buy entry and target the previous Higher High. Our final target is 0.22.
Good Luck

Doge which path? Red or green? take your pick, on HTF honestly pretty interesting for sure, worth keeping an eye just how we did back in last cycle with XRP
