ETC TO THE MOONBullish divergence on the 3M chart forming on RSI imdicator. Very very high probability of seeing new highs. Dont be fooled by the news. Numbers are more important than words.
Stay blessed.
DYTRDR.
ETCUSD trade ideas

ETC, UNI, SHIB, to the moon.ETC, UNI, SHIB, who will lead? 3 level fractals. One of my favorite patterns.

Ethereum Classic (ETC) Breakout Alert: Is $20+ the Next Stop?ETC/USD 4H Chart Analysis – Bullish Momentum Incoming?
Ethereum Classic (ETC) is showing signs of a potential breakout, as seen in the 4-hour chart. Here’s a deep dive into the technical setup and what traders should watch for in the coming sessions.
🔥 Key Takeaways:
✅ Ascending Triangle Formation: A strong bullish pattern, indicating possible upside continuation.
✅ Breakout Confirmation: Price has pushed above a key resistance level, suggesting buyers are stepping in.
✅ Targets in Sight:
🎯 TP1: Around $19.17 (previous resistance)
🎯 TP2: Around $19.95 (strong historical supply zone)
✅ Support & Risk Management:
Stop-Loss (SL): Placed around $18.00, ensuring a good risk-to-reward ratio.
✅ Moving Averages: Price is approaching the 200MA, a key dynamic resistance around $18.90—a break above this would confirm further bullish momentum.
📈 Trading Outlook:
If ETC holds above $18.30 and successfully flips $18.90 into support, we could see a quick move towards $19.95+. However, rejection at this level could lead to a pullback towards the $18.00 region.
🚨 Bullish or Bearish?
This setup leans bullish, but confirmation of a clean breakout above $19.00-$19.20 will be key. Keep an eye on volume and overall market sentiment!
📊 What’s your take? Are you long or waiting for more confirmation? Drop your thoughts below! 🔥


will this pattern complete?copied the purple pattern from xrp 2014 - 2017.5
do these patterns complete?

April is critical for ETCif ETF of ETC will approve in future months we have a bullish wave in April for ETC. the last correction has completely ended and April or May will start a new bullish wave for ETC

ETH Classic: Massive Breakout Incoming (800% Gain Potential)As long as ETH Classic remains about 15.737, this EW count is valid. I'm expecting explosive price action to the upside in the next couple of months.
The initial long-term target is at 197, giving us a potential gain of +800%.
Let me know what you think.
Good luck.

ETC will risea great opportunity in 12 to 12.4$ for ETC in the latest down wave.i think May or June is a good time for this correction and buying in the great zone.

ETC LongETC looks amazing.
23$ is one of the most important levels on this chart. For the past 4 weeks ETC has been regarding it as support.
- Bullish Divergence on both oscillators and all higher time frames.
- Bullish Dragon broken and backtested at support.
- Rising volume after consolidation and break of the spine.
- Holding 23$ as support and the 200MA.
- Weekly reversal candles confirmed for now.
Most coins don't look great, but this one does. I'd be cautious and not over allocate.

ETC Bullish ScenarioEthereum Classic has a huge potential for a bullish movement toward a new all-time high across multiple possible scenarios as long as the price holds above $17.4, which is the stop-loss. Breaking this level would invalidate this bullish idea.

This is a recent video of ETCUSD-1 of only a few cryptos nowThis is a setup involving the most important momentum indicator of all Volume and probably the number 1 ingredient that's needed for your trade to run towards a nice profit.
Unfortunately where I am Australia, from here is where I do trading from, well the most important thing Volume is usually missing right through the morning session, but not always.
But there did seem to be much buying during the recording of this pair and this trade went live from about 10am on Tuesday 7 January.
Another wonderul indicator ftht is often overlooked with a view towards it not working, could not be further form the truth. When used correctly the MACD won't be only a trigger to buy or sell into a trade, but I use it sometimes in the current traded timeframe or the next timeframe up will allow me to steer price up or down by watching for any cross of the MACD and Signal lines. Standby

Possible falling wedge!Hi all,
Possible falling wedge pattern in 1D time frame.
Target around 50 usdt,

Possible cup and handle pattern in 1hHi all,
ETC/USDT
in 1h possible cap and handle! Target price around 28 usdt

update to my last chartthere is a classic wyckoff accumulation schematic happening with ETC. This may be your last chance to pick up some more. But please trade within your means.

Ethereum Classic (ETC): Eyeing a Massive +207% Surge to $77 – CrEthereum Classic (ETC/USD) is at a pivotal moment, with the potential for significant movement in either direction based on current technical patterns. Here's a detailed outlook:
Key Scenarios:
Bullish Case:
The price is forming higher highs and higher lows, indicating an emerging bullish structure.
A breakout above $77.45 (Fibonacci resistance) could signal a continuation toward $77.45, representing a potential upside of approximately +207% from the current level of $25.25.
Momentum indicators suggest growing buying interest, supported by increased volume in recent sessions.
Bearish Case:
A failure to hold current levels could push ETC into a deeper pullback phase, with potential for consolidation before resuming upward momentum.
Key Levels to Watch:
Resistance Levels: $77.45 (major breakout zone).
Goal Target: $77.45 (+207% potential upside).
Conclusion:
Ethereum Classic is at a make-or-break level. A successful breakout above $77.45 could trigger a strong bullish rally, with the next target at $77.45 (+207%). Watch this level closely to confirm the trend direction and momentum.
📢 Disclaimer:
This analysis is for educational purposes only and is not financial advice. Always conduct your own research and consult a professional before making trading decisions. 🛑

Something cooking with ETC Ethereum Classic?Chart opens a possibility for a bullish multicycle continuation for ETCUSD chart. Key zones to watch are in blue. One more level to conquer to make this upward movement definitive and sustainable. If it goes beyond 47 dollars, it opens pathway to ATH with no resistance until 175 dollars.

ETC with a possible (+50%) moveETC could try to reach between $47 to $54 the highs from 2022 in the next weeks, the momentum is favoring higher prices with with huge hidden bullish divergences, if stays above $33 in a weekly close would be a good sign for it. The target is in confluence with monthly levels, anchored vwap from the may 2021 high, fibonacci levels and strong resistance zone.

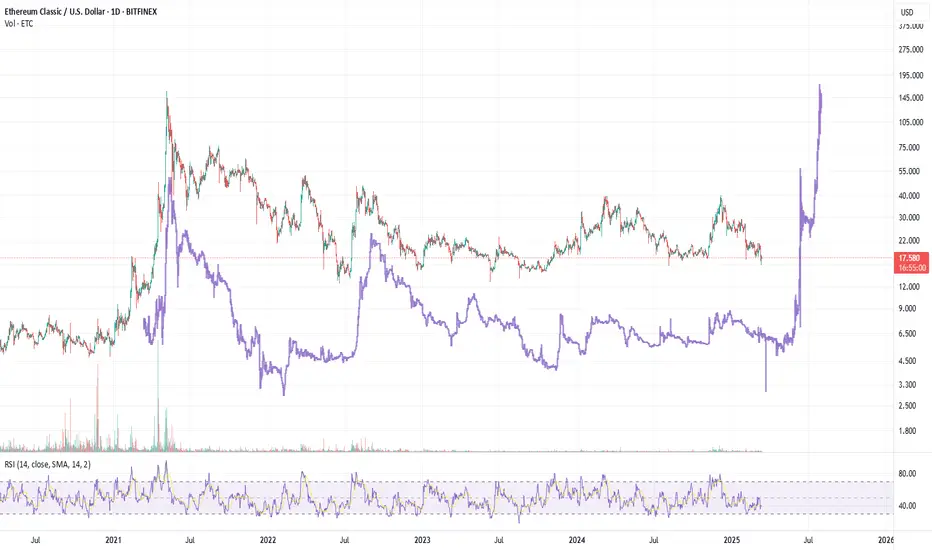
ETC/ USD * Ethereum Classic - EWP FIB TC WEEKLY TF ANALYSISThe RSI on the lower part of the chart, currently around 39, indicating a slightly oversold condition. This suggests the market could be near a potential bottom, but further confirmation is needed.
If this ABC correction holds, the price might find support near the 0.786 Fibonacci level ($15.65) or the lower boundary of the channel. This could signal the end of the corrective phase and the start of a new upward movement (Wave 1 of a new cycle). Alternatively, if price breaks below these support levels, it could suggest further downside, extending the correction.

Ethereum Classic: A Breakout That Could Ignite a New Bull RunEthereum Classic (ETC/USD) has broken out of a multi-year descending trendline, signaling a potential shift from prolonged consolidation to a new bullish phase. This breakout ignites optimism among long-term investors, suggesting that the long-awaited rally might finally be here.
A Fibonacci projection highlights the 1.618 level at $274 as a key long-term profit target, representing significant upside potential from current levels near $36.50. This technical milestone could attract fresh interest in ETC, positioning it as a standout performer in the crypto market.
For long-term holders, this breakout marks a pivotal moment, offering renewed hope of ETC reclaiming its strength. While challenges may arise, the current move sets the stage for a potential historic rally, making this a critical time for investors to remain optimistic and informed.
**Disclaimer:**
This post is for informational and educational purposes only and should not be considered financial or investment advice. Cryptocurrency investments are highly volatile and involve significant risk. Always conduct your own research and consult with a licensed financial advisor before making any investment decisions. Past performance is not indicative of future results.

Crazy targetIknow, this is insane. But yeah its crypto. Just spent money you can loose. We could be in a wave 3. Would be amazing if this happens after 8 years.

ETCUSD - Bull RSIThis RSI pattern on the Monthly is a W pattern with the sides being lower than the middle peak
A very bullish sign for people in long on ETCUSD
If you see a chart similar to this recognize the W pattern as it is a great sign
Monthly

ETCUSD (1W) - buy the dipHi traders,
Here it is my idea for a long position on ETCUSD (1 week time frame).
the price hit a local high in March 2024 and hit another high in November 2024, after that the price bounced back and is currently experiencing the pullback. The idea is to enter in the buy area, which is determined by a previous resistance zone that can be a support for a bounce up now. The best would be if the price will hit the SMA in the buy area and use it as a support too. The buy area is between 24.28 and 22.43.
We will put our first take profit at the level of the last high, at 36.23. the second take profit will be at 41.63 when the price hit a local high in August 2022.
Good luck!
