ETHEREUM: THE NEW BOND OF THE DIGITAL WORLDPrice isn’t the goal. Price is the side effect.
Meanwhile, BlackRock - a black hole with a trust-backed logo - just absorbed 42,000 ETH more.
Yesterday, you may have read this "regular" headline:
BlackRock increases its Ethereum exposure to $4 billion, adding $109.5 million via ETFs.
But here’s what you missed: there are no random numbers on the market.
When a player like this moves - it’s not hype. It’s a blueprint for the future.
Ethereum is no longer an altcoin.
It’s no longer speculation. It’s a financial infrastructure, already recognized by law, exchanges, and institutions.
What does this mean?
💡 Ethereum is now a digital bond - with yield flowing from blocks.
Profit is no longer built on promises, but on the structure of the chain itself.
Trust lies not in faces, but in code.
Growth is not artificial — it’s architectural.
And here’s why this is terrifyingly beautiful:
While you sleep, they are building an era.
Each ETF purchase removes ETH from circulation - permanently. Because:
✅ This ETH is gone from the open market
✅ It won’t be panic-sold
✅ It becomes income-bearing collateral, not a speculative asset
Still waiting for an entry signal?
The big players are already in.
This is no longer crypto - this is cash flow infrastructure, embedded into the digital economy.
And when pension funds, insurers, and sovereign investors move into Ethereum - they will come via ETFs.
Not because it’s trendy, but because it’s regulated, stable, and profitable.
📉 When institutional demand meets vanishing supply - the price won’t simply rise. It will explode, not as growth, but as a structural liquidity shift.
Ethereum is:
💸 Staking = passive yield
🔗 Backbone of DeFi
🖼 Fuel for NFTs
⚙️ Millions of transactions per second
⚖️ A regulated ETF asset
This is the new digital bond system, where the bet isn’t on the dollar - it’s on ETH as an income-producing asset.
💥 While you're reading this, the game is already on.
ETFs are rewriting the rules of time-ownership.
No hype. Just filings. Just intention.
Best regards EXCAVO
ETHUSD.P trade ideas

ETHEREUM (ETHUSD): Bullish Continuation is Coming?!📈ETHEREUM is in a long-term bullish trend, but since late May, it has been consolidating within a horizontal range.
However, the price bounced yesterday and closed above the range's resistance, which is likely to initiate a trend-following movement.
The next resistance level is at 3000.

Ethereum - This structure decides everything!Ethereum - CRYPTO:ETHUSD - trades at a key structure:
(click chart above to see the in depth analysis👆🏻)
After Ethereum retested the previous all time high in the end of 2024, we saw quite a harsh move lower. This move was followed by an expected recovery, however Ethereum is still trading below a key structure. Either move is still possible and will shape the future of Ethereum.
Levels to watch: $2.500, $4.000
Keep your long term vision!
Philip (BasicTrading)

ETHEREUM This Megaphone emerged on all previous Cycles.Ethereum (ETHUSD) is showing incredible strength at the moment as it broke above its 1W MA50 (blue trend-line) and its goal now will be to close the week above it.
This resembles May 2020 and January 2017 when again the price was struggling to break above its 1W MA50, all within a similar Megaphone pattern, and eventually succeeding. The similarities among those 3 patterns so far are striking despite being formed on different Cycles.
As you can see, we are currently on the 0.618 Fibonacci level of the Megaphone, which is exactly where ETH was during the other 2 Cycles when it tested the 1W MA50 and broke out. Once the 1W MA50 turned into Support, the market never looked back and initiated the parabolic rallies of 2020/ 2021 and 2017.
Based on that, we expect ETH to test the 1.5 Fibonacci extension, around $7000.
-------------------------------------------------------------------------------
** Please LIKE 👍, FOLLOW ✅, SHARE 🙌 and COMMENT ✍ if you enjoy this idea! Also share your ideas and charts in the comments section below! This is best way to keep it relevant, support us, keep the content here free and allow the idea to reach as many people as possible. **
-------------------------------------------------------------------------------
💸💸💸💸💸💸
👇 👇 👇 👇 👇 👇

ETH/USD LONG SETUPThe chart displays the Ethereum/U.S. Dollar (ETHUSD) price action on a 1-day timeframe. The price has broken through a descending channel, indicating a potential buying opportunity. A blue rectangle highlights a support zone, and a blue shaded area projects a potential price increase. The current price is around 2736.7. The chart suggests a possible reversal, with the price potentially rising. The overall trend appears to be shifting upwards. The price action is being monitored for potential trading opportunities. The chart provides a visual representation of the ETHUSD price movement, allowing for analysis and decision-making. Trading decisions can be made accordingly.
Entry: 2700/2420
Target : 4100
If you found this analysis helpful, don’t forget to drop a like and comment. Your support keeps quality ideas flowing—let’s grow and win together! 💪📈

ETH/USD.1D CHART PATTERN.I'm looking at a long trade idea on ETH/USD with the following structure:
Buy Entry: $2,740
Target 1: $3,320
Target 2: $4,000
Here's a breakdown of the trade setup and key considerations:
---
📈 Trade Summary
Parameter Value
Entry $2,740
Target 1 $3,320
Target 2 $4,000
Potential Upside (to T1) ~21.2%
Potential Upside (to T2) ~46%
---
🔍 Technical Considerations
Before entering, consider:
1. Support at $2,740:
Check if this level aligns with major moving averages (e.g., 100/200-day) or prior demand zones.
2. Resistance Zones:
Around $3,320: Watch for profit-taking pressure or horizontal resistance.
$4,000: Likely a strong psychological and technical barrier.
3. Volume Confirmation:
Look for rising volume or breakout candles to confirm momentum.
---
⚠ Risk Management
Stop Loss: Consider placing it below recent support (e.g., ~$2,600 or tighter, depending on strategy).
Position Sizing: Use a % of your portfolio that fits your risk tolerance (e.g., risking 1–2% per trade).
---
✅ Example Risk/Reward (R:R)
To Target 1:
Risking $140 (Stop at $2,600), Gain of $580 → R:R ~4.1:1
To Target 2:
Gain of $1,260 → R:R ~9:1
---
Would you like a chart with technical indicators or help automating alerts on TradingView?

Inverse cup and handle + Symetrical triangle (continuation) ETHInverse cup and handle + Symetrical triangle (down)
Bearish
Target 2100 ish
Thank me later,
The Short Master

UPDATE ON ETH SELL ,Anything above $2780 is a good sellUPDATE ON ETH SELL
Anything above $2780 is a good sell
Targeting $2670 or Down
Not a Financial advice

ETH Just Broke Out — Here’s Why $3,445 and $3,995 Are TPsEthereum is showing a strong bullish structure on the daily chart, having recently broken out of a month-long consolidation channel. After spending over 35 days trading in a narrow sideways range between approximately $2,345 and $2,780, ETH has now pushed through the upper boundary of that zone, signaling a shift in momentum.
This breakout from the accumulation zone is significant. The highlighted box on the chart indicates a period of low volatility and tight price compression—often a precursor to a sharp directional move. The breakout candle was decisive and supported by rising volume, as confirmed by the PVT (Price Volume Trend) indicator, which shows a clear uptick in accumulation. This suggests that institutional and smart money may be positioning for further upside.
The reclaimed level around $2,503, previously acting as major support, is now serving as a strong base. If ETH continues to close daily candles above this threshold, the bullish momentum is likely to continue. The immediate resistance lies around $3,445, marking the first target zone (TP1), followed by a more ambitious extension toward $3,995, which aligns with Resistance Level 2 (TP2). These targets represent gains of approximately 21% and 41% from current levels, respectively.
A measured trade setup from the current zone offers a solid risk-reward ratio of 2.4. The stop loss is reasonably placed just below the breakout structure at $2,344. If ETH falls back below this level and closes inside the previous channel, the breakout would be invalidated, and bulls would need to reassess.
This setup aligns with a classic trend continuation pattern—breakout from consolidation, volume confirmation, and a potential retest of the breakout level. As long as price remains above $2,503, bulls remain in control, and the medium-term outlook remains favorable.
In conclusion, Ethereum appears poised for a bullish continuation on the daily timeframe. The channel breakout, rising accumulation pressure, and clean technical structure support the idea that ETH may soon challenge higher resistance zones. However, price must hold above key support to maintain this bias. Traders and investors may view current levels as a favorable risk-entry opportunity with eyes on $3,445 and $3,995 as major profit zones.

ETH Short to Support or breakout candle retestIf it is and ascending triangle and things are bearish we can go deep into the cloud support
If it's super bullish we will quickly just test the trend line of the last breakout candle

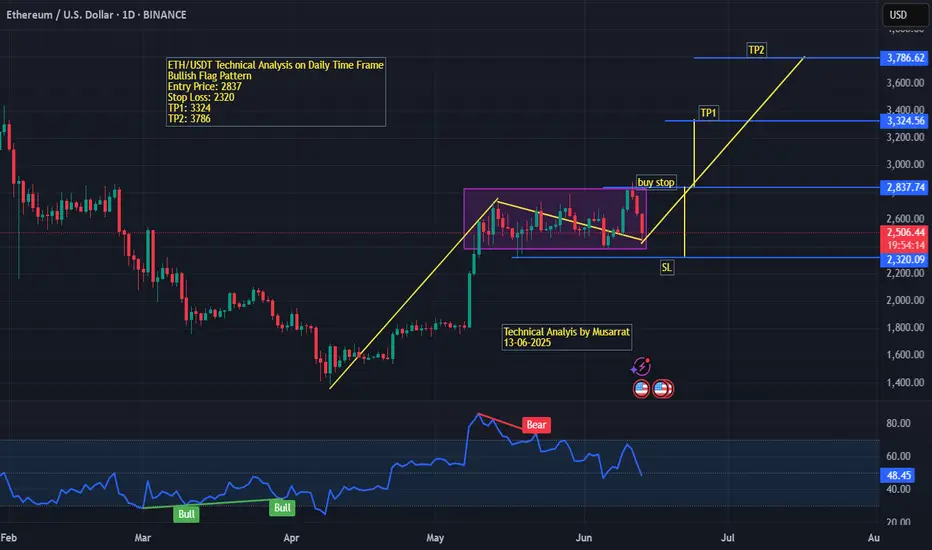
ETH/USDT (Daily Time Frame) Technical Analysis – ETH/USDT (Daily Time Frame)
Chart Date: June 13, 2025
Pattern: Bullish Flag
Ethereum (ETH) against USDT is currently forming a bullish flag pattern on the daily chart, indicating a potential continuation of the previous uptrend. The price action shows a sharp bullish rally followed by a consolidation phase within a descending channel (flag), which is typical in such setups.
Entry Point: The breakout level is marked at $2,837, which serves as a potential buy-stop trigger.
Stop Loss (SL): Placed at $2,320, just below the support zone and the lower boundary of the consolidation flag. This helps protect against a false breakout.
Target 1 (TP1): $3,324, derived from the height of the flagpole projected from the breakout point.
Target 2 (TP2): $3,786, a more aggressive upside target in line with the full measured move of the flag pattern.
The RSI indicator at the bottom reflects a bearish divergence during the latter part of the flag, which led to the current retracement. However, previous bullish divergences in March and April triggered strong upswings, indicating that momentum could return if price breaks above resistance.
The price currently trades at $2,522, below the breakout level, suggesting traders should wait for confirmation of the breakout before entering the trade.
Conclusion:
This chart sets up a high-probability bullish continuation trade. Traders should monitor for a strong breakout above $2,837 with volume confirmation before entering long. Risk management is key, with a tight SL near $2,320 and clear profit-taking zones at TP1 and TP2.
ETH USD LONG!The price has been a trading in a channel on the 4hrs timeframe, and recently it traded on the lower bound of the channel and a reversal pattern is observed on the 1Hr timeframe.
Hence, the price is now expected to rise.

Ethereum bulls are enjoying the momentAfter violating the upper side of the range, MARKETSCOM:ETHEREUM is now aiming for the 3000 zone. Will the buyers have enough steam to drag it there? Let's have a look.
CRYPTO:ETHUSD
Let us know what you think in the comments below.
Thank you.
77.3% of retail investor accounts lose money when trading CFDs with this provider. You should consider whether you understand how CFDs work and whether you can afford to take the high risk of losing your money. Past performance is not necessarily indicative of future results. The value of investments may fall as well as rise and the investor may not get back the amount initially invested. This content is not intended for nor applicable to residents of the UK. Cryptocurrency CFDs and spread bets are restricted in the UK for all retail clients.

Ethereum / US Dollar (ETH/USD) ETH/USD is forming a short-term ascending channel on the 15-minute chart after a strong rebound from the 2510 level. As long as price remains inside this channel, a move toward 2604 and possibly 2657 is likely. A break below 2510 would weaken this bullish momentum and could trigger a new wave of selling.

Bitcoin Mid-Term, 4H Timeframe, Bullish ($119,165 Next Target)On the 4H timeframe we have a consolidation pattern with a bullish bias. Bitcoin is aiming higher after a close above EMA8 & 13 with higher lows.
The drop 13-June found support perfectly at 0.786 Fib. retracement on a wick. The session closed above 0.618. The action turned bullish immediately and we are seeing slow but steady growth.
The recent drop was a market reaction due to a geopolitical situation. As soon as the event is priced in, the market seeks balance and goes back to its previous trend.
Bitcoin's bullish bias is not only supported by strong prices, $105,600 is very strong, but also by the altcoins and the cyclical nature of the market.
While Bitcoin already produced several new all-time highs this year the altcoins are yet to do the same. A bull market happens every four years or the year after the halving. For Bitcoin this is already true but this is a marketwide event and the altcoins are yet to go there and this is a bullish factor and soon this will be obvious on the chart.
We are 5-6 days away only from very strong bullish action. Notice that this isn't a long time, it is less than a week. The altcoins will reveal this bullish bias much sooner than Bitcoin but Bitcoin will also grow and hit a new all-time high soon. This new all-time high will be the catalyst for everything to boom.
» Ignore the short-term it is all noise—crypto is going up.
The next target is $107,558, followed by $109,508 on this timeframe. The latter being a mild resistance.
The main target here is $119,165 and this is a good resistance zone. It can be rounded up to $120,000. If this level gets hit it will only confirm additional growth. The target that follows is $130,000 and the minimum for this cycle is $160,000 but we are aiming higher.
Feel free to follow for more.
I will continue to detail Bitcoin on all the timeframes as well as many of the top, mid- and small altcoins.

ETH NEXT MOVE The chart shows **ETH/USD (Ethereum to USD)** on the **4H timeframe**, forming a **rising channel** pattern. Here's a breakdown of the analysis:
---
### 🔍 **Pattern Identified**
* **Rising Channel** (also known as an ascending channel):
* **Upper Resistance Line:** Price is currently testing this line.
* **Lower Support Line:** Held multiple times, confirming structure.
---
### 📈 **Current Price Action**
* **Price:** \~\$2,796.7
* ETH is **at the top of the channel**, facing strong **resistance**.
* Recent move was sharp and bullish, indicating momentum.
---
### ⚠️ **Possible Scenarios**
#### ✅ **Bullish Breakout (Less Common in Channels)**
* If price **breaks above** and **closes convincingly above the channel**, especially with high volume:
* Target zones: \$2,900 → \$3,000 → \$3,200.
* Look for **bullish continuation setups** on lower timeframes.
#### ❌ **Rejection from Resistance (More Likely)**
* If price **rejects the top** of the channel:
* Expect a pullback toward the **mid-line** or **lower support** (\~\$2,550 to \$2,400).
* This would offer a potential **buy-the-dip** opportunity.
---
### 📉 **Bearish Confirmation**
* A **breakdown below the lower trendline** (\~\$2,400):
* Invalidates the channel.
* Could trigger deeper correction toward \$2,200 and below.
---
### 📊 **Strategy Suggestions**
#### If Trading the Range:
* **Sell/Short** near top of channel (\~\$2,800), SL above channel.
* **Buy/Long** near bottom of channel (\~\$2,400), SL below channel.
#### If Anticipating Breakout:
* **Wait for retest** after breakout and enter on confirmation.
* Use trailing stops to manage risk.
---
### 🧠 Summary
| Bias | Direction | Reason |
| ------- | ------------- | ------------------------------------------- |
| Neutral | Ranging | Still inside the channel |
| Bullish | Above \$2,850 | Breakout with volume can fuel momentum |
| Bearish | Below \$2,400 | Breakdown from channel means trend reversal |

Watching 4H and 30min Reaction
Price is now finding resistance on the 4H at the 200MA, and on the 30min at the 50MA.
On the 4H, the SMA has flattened, and the MLR is starting to flatten too—after price found support at the 0.5 Fib and weekly 200MA.
Buying volume is starting to pick up on both timeframes.
For stop-loss, I’m using push notifications instead of an open order.
Always take profits and manage risk.
Interaction is welcome.

Ethereum Liquidity Pool RangeOn the ETH/USDC liquidity pool on the Base network, Ethereum’s volatility is beginning to stabilize, creating a favorable range for liquidity provision, as indicated by the horizontal red lines. There may be an opportunity to tighten this range further in the coming hours, but additional data is needed to confirm. For now, the concentrated range is being set slightly wider, given that we’re still relatively close to the significant volatility spike from earlier in the week.
ETH SHORT TERM/MID TERM BEARISH PRICE MOVEMENTHello everyone,
i would like to share my view of ETH, in the future it will hit between 6500/7000 no doubt but short to mid term i believe we will see the lower price levels once again before it takes off to new highs!
targets: 1545 , 1288
Greetings,
The Short Master

ETH is riding to meet WAVE 5 !hello traders
as you can see wave 4 is formed as an triangle .
we can consider it as an ABC too!
we can expect a niiiice wave 5 as an impulsive wave

ETH/USD Rejection at Supply Zone – Bearish Move LoadingETH/USD is currently showing a potential short opportunity after rejecting the key supply zone around $2,640 – $2,645, a level that previously acted as strong resistance.
🔍 Key Observations:
Price tapped into a visible Supply Zone (highlighted in blue) and is now consolidating below it.
Strong resistance is confirmed by repeated rejections at $2,640.
A clean support level lies at $2,576, which could act as the first target if sellers take control.
Below $2,576, watch out for a potential drop toward the demand zone around $2,508 – $2,500, a level where bulls previously stepped in aggressively.
📉 Bearish Scenario: If ETH breaks below $2,576 with volume, expect momentum to build toward the $2,508 demand area. A break below $2,500 could open the door for further downside.
📌 Trade Idea:
Entry: Below $2,576 on strong bearish candle
TP1: $2,508
TP2: $2,500
SL: Above $2,645
🚨 Note: Confirmation is key. Watch for bearish candlestick formations or volume spikes before entering short.
🔔 Follow me for more clean setups and live trade ideas.
#ETHUSD #Ethereum #CryptoTrading #SupplyAndDemand #PriceAction #Scalping #DayTrading #ShortSetup

ETHUSD likely to reach 2474 levelETHUSD is in uptrend and has possible reversals. Once the reversal is confirmed, price is likely to reach 2474 level.
All the analysis is for educational purpose only. Not an investment or financial advise.

How Wall Street Will Play ETH this Bull CycleI think once that stable coin bill is approved, it will be very bullish for ETH.
I have ETH going to about ~8k or ~9k sometime this cycle, conservative estimate.
I'm thinking an upward trajectory of about 100% from the previous all time high.
Please let me know your thoughts on this one. Thanks.
